University of Windsor University of Windsor
Scholarship at UWindsor
Scholarship at UWindsor
Electronic Theses and Dissertations Theses, Dissertations, and Major Papers
9-18-2018
Accessible POI Recommendation Using Adaptive Aggregation of
Accessible POI Recommendation Using Adaptive Aggregation of
Binary Ratings
Binary Ratings
Bidur Subedi
University of Windsor
Follow this and additional works at: https://scholar.uwindsor.ca/etd
Recommended Citation Recommended Citation
Subedi, Bidur, "Accessible POI Recommendation Using Adaptive Aggregation of Binary Ratings" (2018). Electronic Theses and Dissertations. 7575.
https://scholar.uwindsor.ca/etd/7575
This online database contains the full-text of PhD dissertations and Masters’ theses of University of Windsor students from 1954 forward. These documents are made available for personal study and research purposes only, in accordance with the Canadian Copyright Act and the Creative Commons license—CC BY-NC-ND (Attribution, Non-Commercial, No Derivative Works). Under this license, works must always be attributed to the copyright holder (original author), cannot be used for any commercial purposes, and may not be altered. Any other use would require the permission of the copyright holder. Students may inquire about withdrawing their dissertation and/or thesis from this database. For additional inquiries, please contact the repository administrator via email
Accessible POI Recommendation Using Adaptive Aggregation of Binary Ratings
By
Bidur Subedi
A Thesis
Submitted to the Faculty of Graduate Studies through the School of Computer Science in Partial Fulfillment of the Requirements for the
Degree of Master of Science at the University of Windsor
Windsor, Ontario, Canada
2018
Accessible POI Recommendation Using Adaptive Aggregation of Binary Ratings
by
Bidur Subedi
APPROVED BY:
______________________________________________ G. Bhandari
Odette School of Business
______________________________________________ D. Wu
School of Computer Science
______________________________________________ X. Yuan, Co-Advisor
School of Computer Science
_______________________________________________ S. Mavromoustakos, Co-Advisor
School of Computer Science
iii
DECLARATION OF ORIGINALITY
I hereby certify that I am the sole author of this thesis and that no part of this thesis has
been published or submitted for publication.
I certify that, to the best of my knowledge, my thesis does not infringe upon anyone’s
copyright nor violate any proprietary rights and that any ideas, techniques, quotations, or
any other material from the work of other people included in my thesis, published or
otherwise, are fully acknowledged in accordance with the standard referencing practices.
Furthermore, to the extent that I have included copyrighted material that surpasses the
bounds of fair dealing within the meaning of the Canada Copyright Act, I certify that I have
obtained a written permission from the copyright owner(s) to include such material(s) in
my thesis and have included copies of such copyright clearances to my appendix.
I declare that this is a true copy of my thesis, including any final revisions, as approved by
my thesis committee and the Graduate Studies office, and that this thesis has not been
iv
ABSTRACT
Everyone needs one or more forms of accessibility at some point in life due to age, medical
conditions, accidents, etc. People with accessibility needs have the right to accessible
services, as well as the right to information about accessibility at various places or Points
of Interest (POI). While most popular POI recommendation services do not take
accessibility into account, some of them only consider a few specific needs, such as ramp
for wheelchair users.
However, different users have different accessibility needs regarding the structure of the
building, special aid devices, and facilities to be able to independently visit a place. The
proposed system focuses on finding the personalized accessibility score for a (user, POI)
pair. It can be used with other factors such as historical behavior, social influence,
geographical conditions, etc. to recommend accessible places. It uses time decaying
aggregate on the crowd-sourced binary rating data to find accurate approximation of
current accessibility status for each accessibility criteria. Also, we propose a tunnel-based
algorithm to detect the trend of binary stream data to update the rate of decay. This ensures
v
DEDICATION
To my beloved family:
Parents: Keshab and Bidhya
Sister: Binita
vi
ACKNOWLEDGEMENT
I want to express my gratitude to my advisors Dr. Stephanos Mavromoustakos and Dr.
Xiaobu Yuan for their support, encouragement and advice. I am grateful for their time and
immense knowledge without which my Master’s would be incomplete. I would also like
to express my gratitude to my committee members Dr. Gokul Bhandari and Dr. Dan Wu
for their advice and support on my thesis.
My sincere thank goes to all faculties and staffs at the School of Computer Science for their
assistance, motivation and support.
Finally, I would like to thank my family and friends for supporting me over the course of
vii
TABLE OF CONTENTS
DECLARATION OF ORIGINALITY ... III
ABSTRACT ... IV
DEDICATION ... V
ACKNOWLEDGEMENT ... VI
TABLE OF FIGURES ... IX
LIST OF TABLES ... IX
LIST OF EQUATIONS ... XI
CHAPTER 1: INTRODUCTION ... 1
1.1 OVERVIEW ... 1
1.2 MOTIVATION ... 2
1.3 SCOPE OF THESIS ... 3
1.4 STRUCTURE OF THESIS... 4
CHAPTER 2: REVIEW OF RELATED TOPICS ... 5
2.1DISABILITY AND ACCESSIBILITY ... 5
2.1.1 Government regulations and plans ... 6
2.2RECOMMENDATION SYSTEMS... 7
2.2.1 Introduction ... 7
2.2.2 Recommendation Approaches ... 8
2.2.3 Evaluation of Recommendation Systems ... 12
2.3POINT OF INTEREST (POI)RECOMMENDATION SYSTEM: ... 13
2.3.1 Factors affecting POI recommendation ... 14
2.4ACCESSIBLE POIRECOMMENDATION ... 15
2.4.1 Crowdsourced information on Accessibility ... 15
2.4.2 Existing POI search and recommendation services on the web for people with disabilities ... 16
2.4.3 Related Work: Using POI functionality and accessibility levels for delivering personalized tourism recommendations ... 17
2.5RATING AGGREGATION ... 19
2.5.1 Rating Aggregation Techniques: ... 21
2.5.2 Temporal Aggregation Techniques ... 22
viii
3.1 OVERVIEW ... 27
3.2KNOWLEDGE LAYER ... 28
3.2.1 User Profile ... 29
3.2.2 POI Database ... 30
3.2.3 User Ratings ... 30
3.3RATING AGGREGATOR LAYER:ADAPTIVE TIME FADING AGGREGATE ... 31
3.3.1 Damped Aggregate Computation ... 32
3.3.2 Updating the half-life (T0) ... 33
3.3.3 Algorithmic Complexity ... 36
3.4ACCESSIBILITY BASED RECOMMENDATION SYSTEM ... 37
3.4.1 Accuracy of Accessibility Based Recommendation... 39
CHAPTER 4: EXPERIMENTS AND RESULTS ... 40
4.1SIMULATION OF EXPERIMENTAL DATA ... 40
4.1.1 Pseudocode to generate synthetic data:... 40
4.2EXPERIMENTAL SETUP... 41
4.3RESULT AND DISCUSSION ... 43
4.3.1 Evaluation Metrics ... 43
4.3.2 Results ... 44
CHAPTER 5: CONCLUSION AND FUTURE WORK ... 50
5.1CONCLUSION ... 50
5.2FUTURE WORK ... 50
REFERENCES ... 52
ix
TABLE OF FIGURES
Figure 1: Wheelmap: Online tool that helps find wheelchair accessible places. ... 2
Figure 2: Example of user's check-in sequence ... 14
Figure 3: Overall satisfaction rating on Google Map ... 20
Figure 4: Specific Issue rating on Google Map ... 20
Figure 5: Confidence Window of last 10 ratings ... 23
Figure 6: Constant error on Sliding aggregate (window size=10) ... 23
Figure 7: Graph representing the curve of functions for different T0 values ... 25
Figure 8: Example of rating streams for different criteria. ... 25
Figure 9: Proposed Architecture of recommendation system ... 28
Figure 10 Components of Knowledge Layer ... 29
Figure 11: Two phases of Adaptive Aggregation ... 32
Figure 12: Expected change in half life ... 34
Figure 13: Calculating base probability as window average ... 35
Figure 14: Error bars as tunnel... 36
Figure 15: Probability of positive rating on simulated data (set 1)... 42
Figure 16: Probability of positive rating on simulated data (set 2)... 42
Figure 17: Probability of positive rating on simulated data (set 3)... 43
Figure 18: MAE for Windowed Average using different window sizes (Set 1) ... 45
Figure 19: MAE for Windowed Average using different window sizes (Set 2) ... 45
Figure 20: MAE for Windowed Average using different window sizes (Set 3) ... 46
Figure 21: Relation between the real probability and aggregates (Set 2) ... 47
Figure 22: Error for different Aggregation Technique ... 48
x
LIST OF TABLES
Table 1: Co-occurring disabilities, by type, aged 15 years or older with disabilities ... 6
Table 2: An example of a user-item matrix ... 9
Table 3: Existing crowdsourced accessible POI web applications ... 17
Table 4: Votes for ratings for example data... 22
Table 5: Example of user profile ... 29
Table 6: Example of POI Database ... 30
Table 7: Example User Rating Data ... 31
Table 8: Size and nature of experimental data sets ... 41
xi
LIST OF EQUATIONS
Equation 1: Pearson Correlation ... 9
Equation 2: Cosine Similarity ... 10
Equation 3: Predicted Rating ... 10
Equation 4: Root Mean Square Error (RMSE) ... 12
Equation 5: Mean Square Error (MSE) ... 12
Equation 6: Time Weight Function... 24
Equation 7: Half-life Function ... 24
Equation 8: Time Weight Function... 32
Equation 9: Decay rate as a function of Half Life ... 32
Equation 10: Damped aggregate function... 33
Equation 11: Standard deviation of mean of Binomial Distribution ... 33
1
CHAPTER 1:
INTRODUCTION
1.1Overview
Recommendation Systems have been helping people is a number of domains such as
e-commerce, social networks, music and videos, news, information retrieval, etc. With the
data available from Location-Based Social Networks (LBSNs), smartphones, and the
crowdsourced data contributed by users, recommendation systems can help people
discover attractive and interesting places. (Xie, et al., 2016). Applications such as Google
Maps, FourSquare, Facebook, etc. have been helping people find interesting places by
tracking their preference and various features of places. Such Point of Interest (POI)
recommendation systems use factors, such as distance and geographical factors (Ye, Yin,
Lee, & Lee, 2011), activities of related people (Chen, Li, Cheung, & Li, 2016), current
location and movement pattern (Cheng, Yang, Lyu, & King, 2013).
In addition to interest, social and geographic factors, people with disability have additional
needs and preferences when they visit any place. Accessibility aids, such as wheelchair
ramp, accessible entrance, accessible toilet, elevators for multi-storied buildings enable a
person with disability access the facilities of places independently (Imrie, 2005). Though
some POI recommendation systems consider one or more accessibility factors to
recommend places (AXS Map, 2015) (Mobasheri, Deister, & Dieterich, 2017), there is still
a huge potential of accessible POI recommendation systems to help people with multiple
disabilities find places they could enjoy independently.
This research explores techniques to analyze the crowdsourced ratings to determine the
confidence that the place meets various accessibility needs of users. The ratings are
considered to be stream data, and we will use the damped/time-fading window model to
compute the confidence of fulfillment of accessibility criteria by a place. This model gives
higher emphasis to recent information allowing us to find relevant confidence in the status
2
Gonçalves, & José, 2017) to use confidence calculated from crowdsourced ratings to
calculate a personalized accessibility score for a user and a place.
1.2Motivation
Access to information is one of the most important accessibility tools for people with
disabilities. Ability to know the accessibility status of places, and find places that cater
accessibility needs not only enables disabled people to live a dignified life, but also
generates awareness about accessibility in a public space (Mobasheri, Deister, & Dieterich,
2017). While some existing applications have been collecting and using data to help people
find accessible places for some specific accessibility criteria (Access Now, 2017) space
(Mobasheri, Deister, & Dieterich, 2017), we realized there is a gap in the services available
for general people and people with disabilities. An example of wheel chair based
recommendation is illustrated in figure 1:
Figure 1: Wheelmap: Online tool that helps find wheelchair accessible places. (Mobasheri, Deister, & Dieterich, 2017)
One of the important recent works in this area is “Using POI functionality and accessibility
levels for delivering personalized tourism recommendations” by (Santos, Almeida, Martins,
Gonçalves, & José, 2017). The algorithm proposed in the work for POI recommendations
assumes the accessibility score of each POI would be defined in the system by an expert
human user. But, this approach could be error prone as the output depends on the judgement
3
place before it is added to the system. Also, places are changing continuously and with
more awareness in people, the accessibility of places are improving. If an expert user needs
to visit the place to update the accessibility status of places, the recommendation system
could be producing outdated results until then.
To solve the problem, we would investigate techniques to model the accessibility status of
various factors of Point of Interests (POIs) using explicit feedback given by users. The
value of status can be used to recommend personalized places based on the disability
profile of users. This ensures that people with disabilities have access to information about
private and public places before they visit.
1.3Scope of Thesis
In this work, we analyze techniques to model the accessibility status of a place based on
the feedback of other users. The model could be used in conjunction with the preference of
the user to recommend accessible places. The key contribution of this work would be:
i. Improve the POI recommendation algorithm proposed by (Santos, Almeida,
Martins, Gonçalves, & José, 2017) by automating the calculation of accessibility
confidence of places based on crowdsourced ratings.
ii. Propose tunnel-based adaptive aggregation technique for binary ratings based on
the algorithm used by (Gorawski, Gorawska, & Pasterak, 2017).
iii. Design an architecture of a recommendation system to recommend accessible POIs
for people with multiple disabilities.
We will generate a dataset to cover various scenarios for places, ratings and person profiles
and analyze the performance and results of the system when that data is fed. The test data
will compose of different combinations of user profiles and ratings across a duration of
time which are both consistent as well as random. We will also analyze the result of the
system when some noise is introduced in the rating.
4
i. We do not have access to real movement data of people with disabilities at this
point. The project is aimed to develop a crowdsourced recommendation system
which would help us collect data for future collection and analysis of real data.
ii. With lack of a real disability profile, we cannot analyze the relationship between
accessibility ratings and the satisfaction of the person from the service provided by
the place. The rating prediction could be improved by using the correlation between
the user’s profile, accessibility profile of place as well as the check-in history of the
user.
1.4Structure of Thesis
The remaining of the thesis is organized as follows: First part of Chapter 2 discusses the
disability and government policies surrounding disabilities and accessibility. We have also
reviewed basic concepts of recommendation systems and common recommendation
algorithms from literature. Next, the thesis talks about Point of Interest (POI)
recommendation as one of the application areas of recommendation systems. The next part
of Chapter 2 provides the current status of POI recommendation for people with disabilities
and discusses the work by (Santos, Almeida, Martins, Gonçalves, & José, 2017) on
accessible POI recommendation. This is followed by brief overview of rating aggregation
techniques. Chapter 3 discusses the implementation details of our approach. It is classified
into Knowledge layer, Rating Aggregation Layer (pre-processing), and the
recommendation layer. Chapter 4 discusses the data used for experiments and results.
5
CHAPTER 2:
REVIEW OF RELATED TOPICS
2.1 Disability and Accessibility
Disability is the physical or mental limitation or the gap between an individual’s
capabilities and the demand of the environment where s/he is living (Pope & Tarlov, 1991).
Depending on the type of disability, people face multiple barriers in their everyday life that
prevents them from performing daily activities without assistance. So, it is not the physical
condition of the people, but the barriers that prevent them from performing their work
independently is what makes them disabled. To make them independent, the products,
services, physical infrastructures as well as the policy and attitude of people should cater
to their need.
It is estimated that 14% of the total population of the world live with some form of
disability (World Health Organization, 2011). They are facing physical, psychological and
financial barriers that not only hinder their daily life but also restrict their access to
education, health services, rehabilitation, employment and quality life. Three out of four
Canadians with disabilities have reported more than one type of disability (Statistics
Canada, 2012) which adds further barriers and sets them back on accessing services and
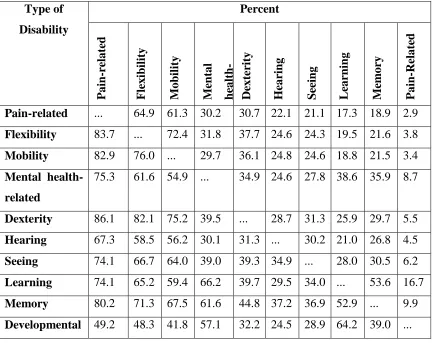
facilities. Table 1 lists the proportion of people with disabilities, aged 15 or older living
6
Table 1: Co-occurring disabilities, by type, aged 15 years or older with disabilities, Canada (Statistics Canada, 2012) Type of Disability Percent Pain -r elate d Fle xib il ity M ob il ity M en tal h ealth -re late d De xte rity Hear in g S ee in g L ear n in g M em or y Pain -Re late d
Pain-related ... 64.9 61.3 30.2 30.7 22.1 21.1 17.3 18.9 2.9
Flexibility 83.7 ... 72.4 31.8 37.7 24.6 24.3 19.5 21.6 3.8
Mobility 82.9 76.0 ... 29.7 36.1 24.8 24.6 18.8 21.5 3.4
Mental
health-related
75.3 61.6 54.9 ... 34.9 24.6 27.8 38.6 35.9 8.7
Dexterity 86.1 82.1 75.2 39.5 ... 28.7 31.3 25.9 29.7 5.5
Hearing 67.3 58.5 56.2 30.1 31.3 ... 30.2 21.0 26.8 4.5
Seeing 74.1 66.7 64.0 39.0 39.3 34.9 ... 28.0 30.5 6.2
Learning 74.1 65.2 59.4 66.2 39.7 29.5 34.0 ... 53.6 16.7
Memory 80.2 71.3 67.5 61.6 44.8 37.2 36.9 52.9 ... 9.9
Developmental 49.2 48.3 41.8 57.1 32.2 24.5 28.9 64.2 39.0 ...
2.1.1 Government regulations and plans
Through Accessibility for Ontarians with Disabilities Act (Government of Ontario, 2005),
the Government of Ontario has aimed to make all private and public spaces in Ontario
accessible by 2025. It sets out process for developing and enforcing accessibility standards
that every public and private organization should meet. The standards have been
categorized into:
a. Customer Service Standard: Customer Service Standard consists of a set of
regulations that ensures that the goods, service or facilities provided by an
organization are served in a manner that respects the dignity and independence of
7
service as any other person would get. It also ensures that the service premise allows
access to service animals or support person.
b. Information and Communication Standard: The information and
communication standard ensures that a person with disability has access to
information provided by an organization in a format that is accessible at no
additional cost. This applies to all the information provided by organization
including the training resources, web site and materials published online.
c. Transportation standard: The transportation standard ensures that all the
transportation service providers make the information about accessibility features
of their vehicles available to public. It also ensures that people with a disability
should be provided with needed accommodation while they are on the vehicles with
no additional cost.
d. Employment Standard: The employment standard ensures the rights of people
with disabilities during the hiring and selection process. It also ensures that the
employees with disabilities are provided with needed accommodation at the work
place.
e. Design of Public space standard: This standard applies to all the public spaces
maintained by government or public organizations such as recreational trails, beach
access routes, outdoor picnic area and playground, parking, etc. The standard
mandates that the space can be used by people with disabilities such as people using
mobility equipment. It includes the policies for minimum width of trail, design of
entrance, signage and information, slope of trail and wheelchair ramp, accessible
washrooms, etc. This ensures that people with accessibility need would face
minimum physical barriers while visiting such place.
2.2 Recommendation Systems
2.2.1 Introduction
Recommendation Systems are software tools and techniques that help people make choices
by presenting them with suggestions based on the experience of other users. (Resnick &
8
publicly available information and choices, recommendation systems have gained
significant popularity on both industry and academia and have been widely used on the
internet by e-commerce websites, music and media services, news, social networks etc. to
promote the sales as well as help users find interesting items.
Recommendation algorithms are used as a tool for personalization so that the products and
services offered to a user during his interaction with the service are filtered according to
his interest (Linden, Smith, & York, 2003). This ensures that the user would have a better
experience finding interesting goods and services and the service will benefit from the
increased sale.
Recommendation systems may use implicit, explicit or both types of feedback as the data
required to generate a recommendation. Explicit feedback is collected by asking users to
directly rate an item or service they used (Pazzani & Billsus, 2007). An example of explicit
feedback is rating the product purchased in an e-commerce system. Implicit feedback is
the data collected through the use of the system without asking them to rate them (Oard &
Kim, 1998). For example, if the user adds an item to wishlist, it means that the user liked
that item. While explicit ratings are more reliable and less noisy, users are less likely to
explicitly rate each item they interact with (Pazzani & Billsus, 2007).
2.2.2 Recommendation Approaches
Recommendation Systems can be broadly classified into three types based on the
techniques used to recommend items to the user:
2.2.2.1 Collaborative Filtering (CF):
CF is the recommendation technique based on the principle that people like the
product/services liked by people similar to them. It uses algorithms to find the unknown
preference of a product or service to a user based on the known preference for the same
product by similar users (Su & Khoshgoftaar, 2009).
Memory-Based CF algorithms use statistical methods to find a set of neighboring users
selected based on the similarity between them (Su & Khoshgoftaar, 2009). The similarity
9
ratings do not agree. Once the neighborhood is found, the rating for an unknown item for
a user is calculated by aggregating the ratings for the same items by the users in his
neighborhood.
Memory-based CF algorithms use a database of user-item preference matrix that consists
of a list of users as rows and a list of items as columns. Each entry represents whether the
user likes or dislikes the item in some form of rating scale like 0-5, like-neutral-dislike, etc.
Algorithms are used to predict the probability that the user would like any additional item
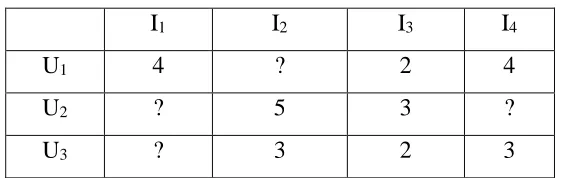
that he has not rated. For example, table 2 represents a user-item matrix with three users
and four items:
Table 2: An example of a user-item matrix
I1 I2 I3 I4
U1 4 ? 2 4
U2 ? 5 3 ?
U3 ? 3 2 3
CF algorithm finds the predicted rating of an unrated item using the following steps
(Sarwar, Karypis, Konstan, & Riedl, 2001):
Calculate similarity weight 𝑠𝑖𝑚(𝑢, 𝑣) between the user 𝑢 and𝑣 : Different
similarity measures such as cosine-based similarity, correlation based similarity
(Sarwar, Karypis, Konstan, & Riedl, 2001) can be used to calculate the similarity.
o Pearson correlation is calculated by first identifying the set of items 𝐼𝑢𝑣
rated by both 𝑢 and 𝑣.
Where 𝑟𝑢,𝑖 is the rating for item i by user u and 𝑟̅𝑢 is the average ratings by user u
for items rated by both the users. For example, the similarity between users 1 and
3 in example table 2 is 𝑠𝑖𝑚(𝑈1, 𝑈3) = 0.71.
o The cosine-based similarity between user 𝑢 and 𝑣 can be calculated as:
𝑠𝑖𝑚(𝑢, 𝑣) = ∑𝑖∈𝐼𝑢𝑣(𝑟𝑢,𝑖− 𝑟̅𝑢)(𝑟𝑣,𝑖− 𝑟̅𝑣) √∑ (𝑟𝑢,𝑖 − 𝑟̅𝑢)2
𝑖∈𝐼𝑢𝑣 √∑𝑖∈𝐼𝑢𝑣(𝑟𝑣,𝑖− 𝑟̅𝑣)2
10
Where 𝐼𝑢𝑣 is the set of items rated by both user 𝑢 and 𝑣 and 𝑟𝑢,𝑖 is the rating for
item i by user u.
Predict unknown rating: Once a set of neighbors 𝑢 ∈ 𝑈 have been decided based
on the similarity weight defined above, the predicted rating 𝑃(𝑎, 𝑖) for user ‘𝑢’ and
item ‘i’ is calculated as (Resnick, Iacovou, Suchak, Bergstrom, & Riedl, 1994):
Where 𝑟̅𝑎 and 𝑟̅𝑢 are the average ratings for all the rated items by users a and u
respectively.
Top-N recommendation: a set of N top-ranked items are generated for
recommendation to the user.
Model-Based CF approach creates a summarized model of data using machine learning
methods such as Bayesian network, clustering and rule-based approaches (Sarwar, Karypis,
Konstan, & Riedl, 2001). The trained model is used to predict the unknown rating and then
generate a top-N recommendation (Aggarwal, 2016).
2.2.2.2 Content-Based Filtering
Content-based recommendation systems use an algorithm to analyze the match between a
user and an item based on the description of the item and the user profile information
(Pazzani & Billsus, 2007). Item description could consist of structured data such as a
database of books consisting of a title, author, and publisher, as well as unstructured text
consisting of book descriptions, cover image and reviews. Similarly, a user profile could
consist of preference and historical interactions by the user with different items (Pazzani
& Billsus, 2007). If both user and item profile are complete and accurate, an effective and
𝑠𝑖𝑚(𝑢, 𝑣) = cos(𝑢⃗ , 𝑣 ) = 𝑢⃗ ∙ 𝑣 ‖𝑢⃗ ‖ × ‖𝑣 ‖=
∑𝑖∈𝐼𝑢𝑣𝑟𝑢,𝑖𝑟𝑣,𝑖
√∑ 𝑟𝑢,𝑖2
𝑖∈𝐼𝑢 √∑𝑖∈𝐼𝑣𝑟𝑣,𝑖2
Equation 2: Cosine Similarity
11
accurate recommendation can be made to the user. Following are general components
being used by content-based recommendation systems (Lops, De Gemmis, & Semeraro,
2011).
Content Analyzer: It performs the pre-processing of unstructured information
(such as text description) so that the result can be used as input to the next stage.
Feature extraction techniques are used to extract actionable information such as
keywords and their frequency. For example, Term-frequency
Inverse-document-frequency (TF-IDF) is used to identify the importance of keywords to a given
document (Salton, 1989).
Profile Learner: This module uses learning techniques such as clustering, neural
networks, and classification algorithms to learn the general preference of the user
(Ali, El Desouky, & Saleh, 2016). Details of items liked or disliked in the past is
used to infer the interest of the user.
Filtering Component: Filtering Component uses the profile learned by the Profile
Learner and the item information extracted by Content Analyzer to find the match
between the user’s profile and the content. A higher match indicates that the item
could be more interesting to the user.
2.2.2.3 Hybrid Recommendation
Hybrid Recommendation System is the combination of two or more recommendation
approaches such as collaborative filtering, content-based filtering, data mining techniques
and a mathematical model to gain better performance (Burke, 2002). Following are some
of the approaches used to combine multiple recommendation techniques:
Weighted: Recommendation generated using multiple techniques are combined
using some weights for the result from each technique. For example, the
recommendation system proposed by (Santos, Almeida, Martins, Gonçalves, &
José, 2017) computes recommendation using multiple criteria and techniques and
later combines them using weighted sum.
12
collaborative filtering technique is less than the set threshold, the system can switch
and execute the content-based filtering to generate the recommendation for the user
(Burke, 2002).
Mixed: This is a popular technique to combine multiple recommendation
techniques in which techniques from two or more approaches are mixed during the
recommendation process. For example, a collaborative filtering system can use the
keywords extracted from user profiles in addition to the ratings to find the similarity
between users.
2.2.3 Evaluation of Recommendation Systems
Different methods have been discussed in the literature for evaluation of recommendation
systems (Herlocker, Konstan, Terveen, & Riedl, 2004) (Shani & Gunawardana, 2011)
(Schein, Popescul, Ungar, & Pennock, 2002). Following are the major aspects considered
for evaluation:
Accuracy: It is the most important aspect for the evaluation of recommendation
system. Most of the recommendation system depend on the prediction of utility
such as predicted rating, the match between user and items, etc. Prediction accuracy
of the system is calculated by comparing the predicted rating from the system with
the real rating from the user. Prediction accuracy is calculated offline using either
natural or synthesized data set (Herlocker, Konstan, Terveen, & Riedl, 2004). Mean
Square Error (MSE) and Root Mean Square Error (RMSE) are the most popular
metrics used to evaluate the accuracy of the system. Given a test set Τ of user-item
pairs (𝑢, 𝑖) for which the rating 𝑟𝑢𝑖 by user 𝑢 for item 𝑖 are known, computed rating
𝑟̂𝑢𝑖 by user 𝑢 for item 𝑖 is calculated using the algorithm. RMSE is computed as:
And, MSE is computed as:
𝑅𝑀𝑆𝐸 = √ 1
|Τ|∑(𝑢,𝑖)∈𝑇(𝑟̂𝑢𝑖− 𝑟𝑢𝑖 )2
Equation 4: Root Mean Square Error (RMSE)
𝑀𝑆𝐸 = √ 1
|Τ|∑(𝑢,𝑖)∈𝑇|𝑟̂𝑢𝑖− 𝑟𝑢𝑖 |
13
Cold Start: The recommendation system is evaluated by its ability to address to a
new user and items whose preference and relation with other items are unknown
(Schein, Popescul, Ungar, & Pennock, 2002). Content-Based filtering algorithms
perform better than collaborative filtering techniques when a new user or item is
introduced to the system because collaborative filtering depends on the historical
preference of a user as well as the ratings received by an item.
Diversity: Suggesting similar items to the user might fill the result with items or
products from the same category that are similar to each other. The user would have
a hard time finding the product if diverse products are not recommended (Shani &
Gunawardana, 2011). For example, if the user is trying to find a restaurant,
recommending him five restaurants serving similar cuisine in the same area might
not be effective. A good recommendation system should have a balance between
accuracy and diversity of result.
Utility: Utility is the measure of value for recommending an item for the
recommender system owner (Shani & Gunawardana, 2011). For example: for an
e-commerce system, the utility is the profit earned by selling an item. Utility has to
be considered along with accuracy and diversity to maximize the profit while giving
maximum value to the user.
2.3 Point Of Interest (POI) Recommendation System:
Point of Interest (POI) means any places such as a library, restaurant, hospital, park etc.
that people could be interested to visit. This includes business, buildings, public places that
can be represented on a map. POI recommendation services help users find new places and
help them know their city better [7]. These help people decide the places to visit in their
own cities as well as in a new city based on criteria such as preference (He, Li, Liao, Song,
& Cheung, 2016), geographical and social influence (Ye, Yin, Lee, & Lee, 2011), temporal
information (Quan & Cong, 2013), road conditions(Megen, Grummon, Lobben, Omri, &
14
2.3.1 Factors affecting POI recommendation
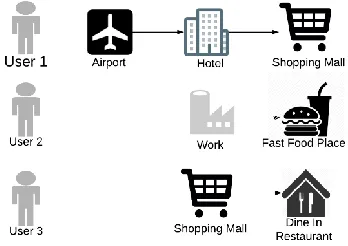
Successive Places of visit: It is based on the assumption that the next place people would visit is influenced by the current location of the person (Cheng, Yang, Lyu,
& King, 2013) (Chen, Li, Cheung, & Li, 2016). For instance, if a swimmer at an
airport has options to go to a water park or a hotel, he will prefer to visit the hotel.
Figure 2 below shows examples of different check in sequence for users. Matrix
factorization method FPMC-LR (Cheng, Yang, Lyu, & King, 2013) has been used
to find next best place for a given user by analyzing the movement pattern of other
users. While most of the recommendation methods only consider the transition
between POI categories, (Zhao, et al., 2018) proposed Long Short-Term Memory
(LSTM) based method to model the Spatio-temporal relationship between
check-ins of users and hence make recommendation based on short-term and long-term
interest of users.
Figure 2: Example of user's check-in sequence
Social Influence: The places a person visits are influenced by his friends and
various social groups he belongs to. (Chen, Li, Cheung, & Li, 2016) Having used
distance weighted Hyperlink-Induced Topic Search (HITS) algorithm to find the
visiting frequency of people in the social group. Also (Song, et al., 2015) analyzed
Location Based Social Network (LBSN) data and proposed the probabilistic model
to predict next location considering temporal, spatial and social influence.
15
Distance has been used by (Chen, Li, Cheung, & Li, 2016) as a weighting factor to
calculate the relation between place and users.
User Reviews: Extracting information from reviews and using it to model users
and POIs on various aspects can help generate helpful and explainable
recommendation for users. (Baral, Zhu, Iyengar, & Li, 2018) proposed the use of
deep neural network to formulate the correlation between reviews and various
aspects discussed in it. For example, the review sentence “though the staffs were
not very friendly, the coffee there was really good” indicates positive sentiment for
the food but negative sentiment for customer service; where ‘food’ and ‘customer
service’ can be two different aspects used for recommendation. With this
information, user can know the reason why an item is recommended to him.
2.4 Accessible POI Recommendation
People with disabilities have one or more accessibility needs that has to be fulfilled to
enable them to visit the place independently. POI Recommendation system for people with
disabilities should be able to recommend places to the people based on the accessibility
needs of the users and the accommodations provided by the place (Santos, Almeida,
Martins, Gonçalves, & José, 2017). Systems like this help people with disabilities find
accessible places to visit independently.
The experiment conducted by (Lyu, 2017) (Lyu, 2017), studied the travel choice of people
with disabilities. Based on the responses collected, it was found that people with disabilities
care most about the accessibility accommodation facilities while deciding on the place to
visit (Lyu, 2017). While extensive research has been conducted on POI recommendation,
only a few of them have considered disability of a user and accessibility of places into
account (Santos, Almeida, Martins, Gonçalves, & José, 2017).
2.4.1 Crowdsourced information on Accessibility
Crowdsourcing to collect information from a large group of people have been successfully
used in a number of ways to help people with disabilities. (Bigham & Ladner, 2011) In
16
collect information about road hazards (Santani, et al., 2015), public health issues
(Brabham, Ribisl, Kirchne, & Bernhardt, 2014) and various another application area.
Most of the crowdsourced applications for people with disabilities on the web use maps
and provide information layers that show the places being searched with additional
information represented by colors or text on whether or not the places are accessible (AXS
Map, 2015) (Access Now, 2017). But, none of these applications seem to have utilized the
profile information of the user to determine whether the place meets user’s accessibility
needs. In addition, they do not fulfill all the needs of people with multiple disabilities which
is common among people (Statistics Canada, 2012).
2.4.2 Existing POI search and recommendation services on the web for people with
disabilities
A number of applications have been developed to collect accessibility information of
places from the pool of volunteer users and using those data to help people with disabilities
find accessible places (Mobasheri, Deister, & Dieterich, 2017) (AXS Map, 2015) (Megen,
Grummon, Lobben, Omri, & Perdue, 2017)(Access Now, 2017) (Access Locator, 2017).
While most of these services focus on a single category of disability; for example: finding
wheelchair accessible places (Mobasheri, Deister, & Dieterich, 2017) (AXS Map, 2015)
(Megen, Grummon, Lobben, Omri, & Perdue, 2017), some of these systems collect and
utilize crowdsourced data to help people with multiple disabilities (Access Now, 2017)
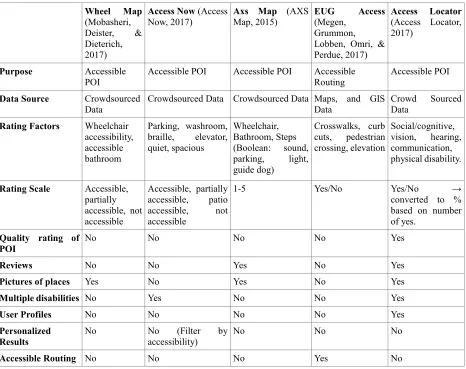
(Access Locator, 2017). Table 3 shows the comparison of five accessible POI
17
Table 3: Existing crowdsourced accessible POI web applications
Wheel Map (Mobasheri, Deister, & Dieterich, 2017)
Access Now (Access
Now, 2017) Axs Map Map, 2015) (AXS EUG (Megen, Access Grummon, Lobben, Omri, & Perdue, 2017)
Access Locator (Access Locator, 2017)
Purpose Accessible
POI
Accessible POI Accessible POI Accessible Routing
Accessible POI
Data Source Crowdsourced
Data
Crowdsourced Data Crowdsourced Data Maps, and GIS Data
Crowd Sourced Data
Rating Factors Wheelchair accessibility, accessible bathroom
Parking, washroom, braille, elevator, quiet, spacious
Wheelchair, Bathroom, Steps (Boolean: sound, parking, light, guide dog)
Crosswalks, curb cuts, pedestrian crossing, elevation
Social/cognitive, vision, hearing, communication, physical disability.
Rating Scale Accessible, partially accessible, not accessible
Accessible, partially accessible, patio accessible, not accessible
1-5 Yes/No Yes/No →
converted to % based on number of yes.
Quality rating of POI
No No No No Yes
Reviews No No Yes No Yes
Pictures of places Yes No Yes No Yes
Multiple disabilities No Yes No No Yes
User Profiles No No No No Yes
Personalized
Results No No accessibility) (Filter by No No No
Accessible Routing No No No Yes No
2.4.3 Related Work: Using POI functionality and accessibility levels for delivering
personalized tourism recommendations
(Santos, Filipe, et al., Using POI functionality and accessibility levels for delivering
personalized tourism recommendations, 2017) proposed a recommendation system that
uses the physical and psychological limitations of users and POI profiles to recommend
places for people with disabilities to visit. The research focuses on modeling of the user
and POI profile including the level of functionality (for users) and the measure of
accessibility facilities available (for POI). The proposed application has two layers:
Knowledge Layer: The knowledge layer is the representation of models used to represent
18
Functionality model: This model represents the intellectual, hearing, vision and locomotion
level of the user. This is used to identify if and to what extent the user needs accessibility
accommodation based on these needs.
Society model: This is the combination of the Social and Community model to
which the user belongs to.
Tags model: Tags model consists of the set of tags used by the user during the
interaction with the system and their weight based on the frequency used by the
user. This represents the interest of the user.
Stereotype model: This model represents the general interest of the user. It stores
the level to which user belongs to the stereotype: Gastronomy, Nature, Business or
City breaks.
Emotions: This model represents the user’s emotion; whether the user is surprised,
happy, angry or sad, while he is at different classes of POIs. POI classes could be
monuments, parks, etc.
Reasoning Layer: The reasoning layer consists of a hybrid recommendation system that
considers accessibility, tags, and the stereotype of users and POI to generate a list of
recommended POIs for the user.
Accessibility recommendation model: This is based on the relation between user’s need for accessibility and the POI’s accessibility profile. For example: if the user’s vision need is 0.6, the hearing need is 0.7 and the building’s accessibility
level for vision is 0.8 and hearing is 0.7, the accessibility level of the building for
the user would be 0.6 X 0.8 + 0.7 X 0.7 = 0.97. Available POIs are sorted based on
the accessibility level to generate a recommendation.
Emotion-based recommendation model: This is based on the emotion reaction
detected by the system when the user was shown different pictures of places
representing different POI classes.
Tags based recommendation: This is based on the weight of tags in user’s profile and the same tags in the POI profile. Higher match results in the place being at top
19
Social Network based recommendation model: This integrates friend’s
preferences on the recommendation of each user. The paper assumes that if the
social circle of a user is interested in a place, it is most likely that this user would
also like it.
The weighted sum was used to compute the final recommendation from the above
techniques. This makes sure that the recommended places interest the user as well as fulfills
the accessibility requirements.
2.5 Rating Aggregation
The internet has a huge amount of goods and services to offer to its users. But, unlike
making choices by observing, feeling or using the goods or services, users have to rely on
the information available online to make choices. Therefore, reputation and trust-based
feedback mechanisms have been used widely in online communities in the form of ratings
and reviews (Josang, Ismail, & Boyd, 2007). While reviews contain qualitative feedback
from the user in terms of textual description, images, videos, or their combination, ratings
are quantitative feedback in which the user rates the item offered within a given scale. The
rating could represent the overall satisfaction of the user or could represent their opinion
on a specific aspect (Josang, Ismail, & Boyd, 2007).
Webster dictionary defines aggregate as “a whole formed by combining several (typically
disparate) elements”. The aggregate of series of ratings given by multiple users at different
point of time is a value typically represented out of 5 stars or as a percentage value, which
represents overall opinion of people for the item across that timeline. Figure 3 demonstrates
five star ratings used in Google Maps and Figure 4 demonstrates the binary ratings on
different criteria of a place. When people are presented with an item on the internet, the
aggregate of ratings presented helps influence their decision (Chintagunta, Gopinath, &
20
Figure 3: Overall satisfaction rating on Google Map
Figure 4: Specific Issue rating on Google Map
Different aggregate techniques such as mean, median, mode, etc. could be used depending
on the nature of data and the purpose of aggregate. We are only considering binary ratings
in which the user chooses between two options (true or false) while discussing the
aggregation techniques. The first sub-section discusses popular statistical techniques used
for rating aggregation while the second sub-section discusses the techniques for calculating
temporal aggregate that represents the state of goods or services at given point of time
21
2.5.1 Rating Aggregation Techniques:
2.5.1.1 Mean as the aggregate value
Mean rating has been used in most of the e-commerce and review collection websites to
represent the aggregate rating. Given a series of positive (true) and negative (false) rating,
if each positive rating is represented as 1 and negative rating is represented by 0, the mean
of binary ratings is calculated as:
Mean Rating=𝑆𝑢𝑚 𝑜𝑓 𝑝𝑜𝑠𝑖𝑡𝑖𝑣𝑒 𝑟𝑒𝑣𝑖𝑒𝑤𝑠
𝑛𝑢𝑚𝑏𝑒𝑟 𝑜𝑓 𝑟𝑒𝑣𝑖𝑒𝑤𝑠
If we consider all the rating to be equally important, and we have the following rating
stream for the place ‘p1’ and criteria ‘c1’:
False, False, False, False, True, True, True
The mean aggregate of these ratings where True is considered 1 and False is considered as
0.
S(p1,c1)=
0+0+0+0+1+1+1
7 =0.43
This represents a 43% confidence that the place actually fulfills the accessibility criteria
‘c1’. While this approach is simple and would be suitable for static items such as ‘movie’, ‘gadget’, etc. it is not very efficient for this application as the places are constantly
changing. The place might have fixed the lighting since the last user rated.
2.5.1.2 Voting as the measure of aggregate
Voting as the measure of aggregate value considers the most repeated rating to be the
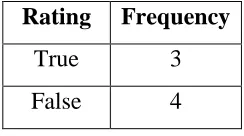
representative (aggregate) rating of the criteria for a place. If we have the following rating
stream for the place ‘p1’ and criteria ‘c1’:
False, False, False, False, True, True, True
22
Table 4: Votes for ratings for example data
Rating Frequency
True 3
False 4
Since False is repeated a maximum number of times, voting would return 0% confidence
that the place fulfills the criteria. But, the place could have bad lighting for a long period
of time followed by improved lighting for the last few months. Voting in such situation
does not properly represent the state of the criteria at a given time.
2.5.2 Temporal Aggregation Techniques
Given a series of ratings received over a period of time, the overall aggregate represents
the status of the item over that period of time. Though it is a useful indicator of the overall
opinion of users, the state of the item could change over the period of time, and the
aggregate may or may not accurately represent the quality of item or opinion of the user at
current situation (Ding & Li, 2005). So, the temporal aggregate of the rating stream is the
value that most likely represents the quality or opinion of users towards the item at a given
point in time.
A good temporal aggregate for the rating stream should have a minimum error (fluctuation
from actual state or opinion it represents) as well as it should adapt to changes in actual
state or opinion. The aggregated rating should:
Represent all the ratings given by the user.
Be sensitive to change in the condition or quality of accessibility accommodation
at the place.
2.5.2.1 Sliding Window Aggregation
Sliding Window is a window of last n ratings we’ve received, where n is a parameter that
represents the number of latest ratings we need to observe in order to determine the
23
Figure 5: Confidence Window of last 10 ratings
For example, if the figure above represents a stream of positive or negative ratings for an
item, and the window size is 10, we would only consider the latest 10 ratings while applying
the aggregate function. If we consider mean to be the aggregate function, the aggregate for
this window would be:
mean(True, True, False, False, False, False, False, False, True, False)
Similarly, other aggregate function such as voting could also be used in a similar way using
a sliding window. Since this technique only considers a limited number of ratings at a time,
it easily adapts to the changes in the quality of place or change of opinion of users. For
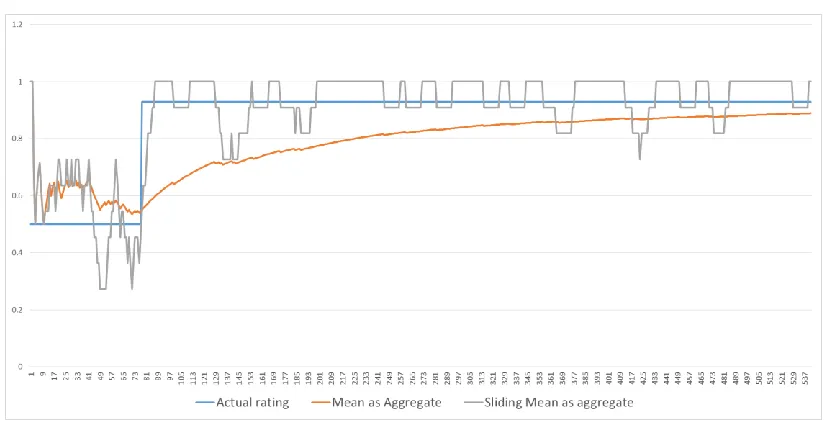
example, figure 6 shows constant deviation in aggregate using sliding window mean.
24
Deciding the window size is a challenging problem while using sliding window aggregate.
Smaller window size help adapt to changes quickly and a larger window size have higher
accuracy as more number of samples are used. So, window size should be chosen to get
acceptable accuracy and adaptiveness. Since the number of ratings (n) considered on each
aggregation is constant, even if we have high number of overall ratings, the aggregation
error remains constant.
2.5.2.2 Time Weighted Aggregate
Damped/time fading window model (Ding & Li, 2005) is used to calculate the average
confidence score of the ratings. In this model, the weight of old data fades while the latest
data has the highest weight. This is to ensure that the confidence score represents the
current status of the place. The damping function/time weight function is defined by:
Where Δt = 𝑡𝑙𝑎𝑡𝑒𝑠𝑡− 𝑡𝑡ℎ𝑖𝑠 for the rating represents the duration between the times this
rating was received and the time latest rating was received. λ is the rate of decay of time
weight of rating. Higher value of λ assigns low weight to historical data while lower value
of λ assigns higher value to historical data. If T0 is the half-life; that is the weight reduces
by half in T0 days, the rate of decay λ is defined by:
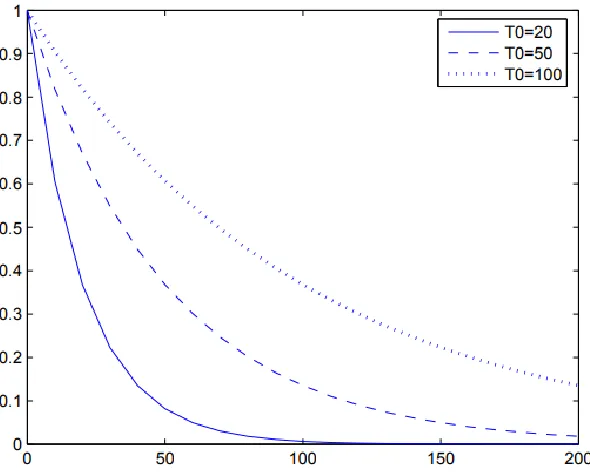
So, the time weight depends on the value of the half-life parameter T0. Graph on Figure 7
represents the curve of time functions for different values of T0.
𝑓(∆𝑡) = e−λ Δt
Equation 6: Time Weight Function
𝜆 = 1 𝑇0
25
Figure 7: Graph representing the curve of functions for different T0 values (Ding & Li, 2005)
This means a low value of T0 reduces the impact of historical data, while a higher value
increases the impact of historical data. In order to calculate the confidence score that
represents the current state of the place, we need to determine the appropriate value for the
parameter T0.
If the values of latest ratings are consistent, we should have a shorter half-life so that the
current consistent ratings have the higher impact of the calculated confidence score. But,
on the other hand, if the latest ratings are inconsistent, this means, we cannot rely on just
the latest data to calculate the score. In this case, we should have a longer half-life to
account for the historical data to calculate the aggregate value.
Figure 8: Example of rating streams for different criteria.
For example, in the data represented in Figure 3, ratings in criteria B are more consistent
26
rating criteria A. For B, we would be more confident to use the latest data to determine
how accessible the place is for that criterion, whereas we should consider more historical
27
CHAPTER 3:
PROPOSED SYSTEM
3.1Overview
This section is divided into three sections. The first section describes the knowledge layer
of the system. The knowledge layer is the data layer that stores the data needed for the
recommendation process. The user profile contains information about the location and
preference of the user. The POI Database contains a list of Point of Interests (POIs), with
their geo-coordinates. User ratings consist of a stream of ratings given by users for different
POIs at different points of time.
The second section describes the rating aggregation system and the intermediate database
created by this system. Rating aggregation layer aggregates the user ratings about different
accessibility criteria to compute an aggregate that best represents the current situation. The
aggregated rating along with user’s information is used for recommending the places. So,
having an accurate aggregate that represents the current state of accessibility criteria of the
place is crucial to generating a useful recommendation.
The third section describes the recommendation layer of the system. This layer computes
the utility of each POI for the user based on three criteria; accessibility, interest, and
distance. When sorted using the utility computed, the system can create an ordered list of
POIs that are most accessible to the current user.
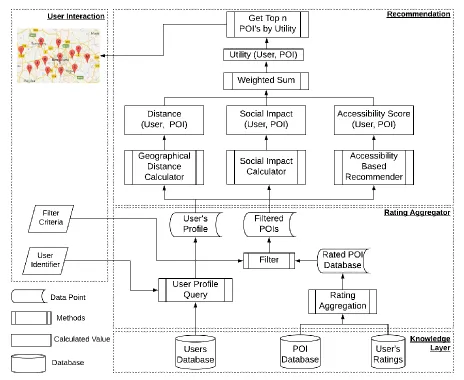
Figure 9 below illustrates the relationship between these layers and shows the flow of
28
Figure 9: Proposed Architecture of recommendation system
3.2 Knowledge Layer
Knowledge layer stores the data needed for the recommendation. This is composed of the
user profile, POI database, and User ratings. The user profile is created when any user signs
up to the system. It consists of basic information and accessibility requirements of the user.
POI Database is the database of places in the system. It consists of basic information like
name and category of the place as well as its geo-location represented by latitude, longitude
pair. User ratings consist of the ratings collected from the user for POIs based on
29
3.2.1 User Profile
We would have a set of users, 𝑼𝟏, 𝑼𝟐 … 𝑼𝒎. Each user’s profile would be represented by
a set of accessibility criteria s/he needs fulfilled in order to go to any point of interest (POI).
Eg. ‘needs parking within 50m of entrance’, ‘needs ramps leading to entrance’, ‘needs
information/signs in braille’, etc. So, 𝑪= { 𝑪𝟏, 𝑪𝟐, 𝑪𝟑,… 𝑪𝒏} represents a list of
accessibility criteria. Table 5 shows examples of different user profiles with their
preference on accessibility criteria.
Table 5: Example of user profile
𝑪𝟏 𝑪𝟐 𝑪𝟑 𝑪𝟒 𝑪𝟓 𝑪𝟔 .. 𝑪𝒏
𝑼𝟏 T T F F F T T
𝑼𝟐 F F T T F F F
𝑼𝟑 F T T T T T F
..
𝑼𝒎 F F T F F F T
For a user 𝑖, and accessibility criteria 𝑗, 𝐶𝑖𝑗 =T means, that user 𝑖 cares about the
accessibility criteria 𝑖, and 𝐶𝑖𝑗=F means that the user does not care about that criteria. A
person can have one or more disabilities and can care about one or more different
accessibility criteria.
User Profile POI Database User Ratings
30
3.2.2 POI Database
Point of interest is any place eg. Restaurant, park, library, etc. that a person might want to
visit. A point of interest has a name, category, and geo coordinates:
Place ID: This is the identifier for the POI. It is automatically generated
(incremented) when new places are added to the system.
Name: The name of the POI being displayed to the user.
Category: Category is the numeric value that represents the class such as
educational institution, restaurants, and coffee shop that the POI is categorized into.
Latitude: Latitude represents the angle, measured in degrees above or below the
equator (Stern, 2004). It along with the longitude represents a position on the earth.
Latitude is in the range of −90° and+90°.
Longitude: Longitude represents the angle, measured in degrees to the east or west
of the prime meridian passing through the Royal Astronomical Observatory,
England (Stern, 2004). Longitude is in the range of −180° and+180°. Longitude
paired with Latitude is used to represent a position on earth.
Table 6: Example of POI Database
Place ID Name Category Latitude Longitude
1 POI1 C1 31.2215 -52.5661
2 POI2 C2 22.6665 28.6665
3 POI3 C3 88.5255 -22.6652
…
n POINT CN
3.2.3 User Ratings
Once a user visits any of the POIs, s/he will give explicit feedback on whether or not the
POI is accessible based on the criteria, 𝑪= {𝑪𝟏,𝑪𝟐,𝑪𝟑,…𝑪𝒏} . These are the same criteria
31
whether the place fulfills that accessibility need. The user may not respond for all criteria
or respond to them as ‘not applicable for the place’ or ‘did not look’. In addition, we would
also have overall satisfaction on ratings from the data for that place. That would be based
on the service/product and overall satisfaction the user had on visiting that place.
Table 7: Example User Rating Data
Accessibility Criteria
user_id POI_id Date C1 C2 C3 .. Cn
001 005 <date> T T N/A F
003 012 <date> F T T N/A
252 258 <date> T T F
…
225 288 <date> T T F T
3.3 Rating Aggregator Layer: Adaptive Time Fading Aggregate
When a user visits a place and rates it for a number of accessibility factors, they will mark
each of them as True or False; i.e. whether the place fulfills that accessibility need. For
instance, user A might rate the criteria ‘Adequate Lighting at Parking Lot” as True but user
B might think that the light is not adequate and rate it as False. We consider these ratings
as a stream of Boolean data.
Using this rating data, we calculate the confidence score ‘S(p,c)’ for the place ‘p’ and criteria ‘c’ to represent the confidence that the place fulfills that accessibility criterion. This
is the score in the range of 0 to 1 where 0 represents the lowest confidence, meaning the
place does not fulfill the accessibility need and 1 represents the highest confidence, which
means the place fulfills the accessibility need. Here, the confidence score S should
represent the current state of accessibility criteria. So, it should be an adaptive aggregate
based on the rating stream and should change when the opinion of people change. For
example, if a place recently built a ramp, its rating series would be:
32
The system should have high confidence regarding a ramp for above rating series because
it recently built the ramp and recent opinion of users is positive.
The proposed adaptive time fading aggregate computes the aggregate on two phases as illustrated on Figure 11. On the first phase, it uses time weighted mean using the half-life value (T0) computed earlier. And, on the second phase, it adjusts the value of T0 using a tunnel algorithm (Gorawski, Gorawska, & Pasterak, 2017) so that the next aggregate adapts to the changes, if any.
Figure 11: Two phases of Adaptive Aggregation
3.3.1 Damped Aggregate Computation
It is the weighted average which considers all the ratings where the weight of a past rating
fades exponentially. The damping function/time weight function is defined by:
Where, Δt = 𝑡𝑙𝑎𝑡𝑒𝑠𝑡− 𝑡𝑡ℎ𝑖𝑠 for the rating represents the duration or the number of ratings
between the times this rating was received and the time latest rating was received. The λ is
the rate of decay of time weight of rating.
Where, T0 (half-life) represents the time taken for the weight of the ratings to fall to half of
its original value. The initial value of 𝑇0 is set to a high number. When a rating is received,
last 𝑇0 is used to calculate the aggregate, and then the 𝑇0 is updated.
𝑓(∆𝑡) = e−λ Δt
Equation 8: Time Weight Function
λ = 1 𝑇0
33
So, for n ratings represented by r(1), r(2)…r(n), damped aggregate is calculated as:
Where, f represents the time weight function as defined in Equation 8. Here, the numerator
represents the weighted sum of all ratings and the denominator represents the sum of
weight.
3.3.2 Updating the half-life (T0)
As the nature of binary ratings allows each rating to be either true or false, for each rating,
there are two mutually exclusive outcomes possible. So, the ratings can be represented
using Binomial distribution.
Given p, the probability of “true(1)” and (1-p), the probability of having a “false(0)”, if no
weight is applied, the mean of the rating stream should ideally be p. For such a binomial
distribution, the standard deviation of mean is given by:
Since this is inversely proportional to ‘n’, the number of ratings considered, with a higher
value of n, the variance of mean would be low, and hence the mean would be closer to the
actual probability. Maximum error of the mean ‘E’ is the maximum absolute difference
between the mean computed ‘𝜇’ and the actual probability ‘p’ such that |𝑝 − 𝜇| < E is
given by:
z: z-score (standard score) for a given confidence level,
𝜇: mean of ratings
p: actual probability/confidence for the given criteria
𝐶 =∑ 𝑟(𝑡)𝑓(𝑛 − 𝑡)
𝑛 𝑡=0
∑𝑛𝑡=0𝑓(𝑛 − 𝑡)
Equation 10: Damped aggregate function
𝜎𝑥̅(𝑝, 𝑛) = √𝑝(1 − 𝑝) 𝑛
Equation 11: Standard deviation of mean of Binomial Distribution
E(z,p,n) = z 𝜎𝑥̅(𝑝, 𝑛) Equation 12: Maximum error in
34
The objective of adjusting the Half-life (T0) value is to have a model that adapts well to
changes as well as minimizes the aggregation error. Lower T0 helps adapt to change but
increases the deviation. Higher T0 decreases the deviation (error) of mean but is not able
to adapt to change of probability quickly. So, the algorithm helps us detect if there has been
a change of opinion (the base probability ‘p’) from the rating stream and increase or
decrease T0 to obtain maximum possible accuracy and adaptability.
If the probability is uniform, increase the T0 (decrease the rate of decay).
If the probability changes, decrease the T0 (increase the rate of decay).
We want the past ratings to decay faster if they are irrelevant/inaccurate, and we want the
past ratings to decay slower, if they are relevant and could contribute to accuracy. So,
detecting the change in the probability (p) helps update the value T0. Following figure
represents the expected change in the value of T0 with the change of base probability:
Figure 12: Expected change in half life
The following algorithm is based on (Gorawski, Gorawska, & Pasterak, 2017) for binary