ABSTRACT
RHODES, NASTASSJA DANIELLE. Disorders of the Dopamine Systems in the Brain – Is It Really All about the Dopamine? (Under the direction of Dr. Leslie A. Sombers.)
Disorders of the Dopamine Systems in the Brain – Is It Really All about the Dopamine?
by
Nastassja Danielle Rhodes
A thesis submitted to the Graduate Faculty of North Carolina State University
in partial fulfillment of the requirements for the Degree of
Master of Science
Chemistry
Raleigh, North Carolina 2017
APPROVED BY:
__________________________ _________________________ John Meitzen Michael Bereman
__________________________ _________________________ Caroline Proulx Gufeng Wang
ii
DEDICATION
iii
BIOGRAPHY
iv
TABLE OF CONTENTS
LIST OF TABLES ... v
LIST OF FIGURES ... vi
I. INTRODUCTION ………... 1
1.1 Neurotransmission ... 2
1.2 Traditional approach to molecular monitoring ... 4
1.3 Electrochemical approach to molecular monitoring ... 5
1.3.1 Amperometry ... 6
1.3.2 Fast-scan cyclic voltammetry ... 7
1.4 Opioid peptides and addiction ... 11
1.5 Rotenone and Parkinson’s disease ... 14
II. MATERIALS AND METHODS ………... 16
2.1 Electrochemical chemicals ... 16
2.2 Peptide synthesis ………... 16
2.3 Glass electrode fabrication …..………... 17
2.4 Chronic electrode fabrication ... 17
2.5 Flow injection apparatus ………... 18
2.6 Electrochemical data collection …... 19
2.7 Animal subjects and care ………... 19
2.8 Surgery and chronic drug administration …... 20
2.9 Electrochemical and behavioural recording ... 20
2.10 Data analysis and statistics ……... 21
III. VOLTAMMETRIC DETECTION OF AMINO ACIDS FOR THE SELECTIVE INDENTIFICATION OF MET-ENKEPHALIN IN VIVO ... 22
3.1 Background ... 22
3.2 Results ... 23
3.3 Discussion ... 29
IV. DETECTION OF DYNAMIC CHANGES IN H2O2 AND DA IN THE STRIATUM FOLLOWING CHRONIC ROTENONE ADMINSTRATION ... 30
4.1 Background ... 30
4.2 Study Parameters ………..…... 31
4.3 Results ... 33
4.4 Discussion ... 40
V. CONCLUDING REMARKS …... 43
v
LIST OF TABLES
Table 1 Polypeptides for characterization ………... 29
vi
LIST OF FIGURES
CHAPTER 1
Figure 1. Schematic representation of segments of the neuron and
chemical synapse between two neurons ………...…... 2 Figure 2. Plot showing the shape and phases of a typical
action potential... 3 Figure 3. Fundamentals of background subtracted FSCV …….………... 7 Figure 4. Generation of a three-dimensional colour plot ... 8 Figure 5. Scanning electron micrograph of a cylinder carbon fiber
microelectrode insulated in glass capillary that has been
heat-pulled to form a tapered seal ………..………... 10 Figure 6. Comparison of the traditional triangle waveform (A) vs
modified sawhorse waveform (B) and representative colour plots depicting the voltammetric data collected
for Met-Enk using each waveform (C,D) ... 12 Figure 7. Optimized modified sawhorse waveform ………... 13 CHAPTER 3
Figure 8. Representative colour plots for 2 µM Tyrosine, 2 µM Met-Enk,
and 40 µM Methionine …...………...……... 23 Figure 9. Colour Plot of A) Met-Enk and B) Leu-Enk. C) Current
plotted versus point number in the applied waveform ……..……... 24 Figure 10. Chart of investigated natural amino acid, functionalized amino
acid and truncated peptide with corresponding colour plots, voltammogram and calibration curves for review
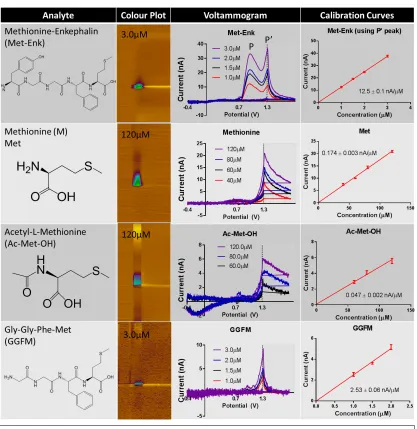
of the contribution of Tyr to the signal of Met-Enk …...……... 25 Figure 11. Chart of investigated natural amino acid, functionalized amino
acid and truncated peptide with corresponding colour plots, voltammogram and calibration curves for review
of the contribution of Met to the signal of Met-Enk ... 26 Figure 12. Chemical structure of Met-Enk, highlighting amino acid
residues as well as the structure of electroactive amino acids
within Met-Enk and functional amino acids.………... 27
Figure 13. Overlays of the signal from analytes for comparison to the Met-Enk’s Tyr peak (A) and Met peak (B) for
easier visual comparison ... 28 CHAPTER 4
vii Figure 16. H2O2 concentration for each subject over the course of treatment,
weeks 1- 4 shown in A-D respectively ... 36 Figure 17. Mean ± SEM for extracellular H2O2 andMean ± SEM for
extracellular DA of subjects for an hour after treatment compared by weeks of treatment ………... 37 Figure 18. Plot of average [H2O2] vs overall rotorod performance for
responders over the course of the study (week 1- 4) .…………... 38 Figure 19. Total variability in [H2O2] B)total variability in [DA] for
subjects across weeks of treatment ………..…….……. 38 Figure 20. Extracellular DA concentrations for each subject over the
course of treatment, weeks 1- 4 shown in A-D respectively …..…... 39 Figure 21. Striatal H2O2 augmented during body distortions induced
1
I. Introduction
For the past 20 years, dopamine (DA) has been one of the most extensively studied catecholamines. In the brain, dopamine serves as a neurotransmitter and is released from nerve cells to send signals to other nerves. Outside of the nervous system, it acts as a local chemical messenger in several parts of the body. This monoamine neurotransmitter has been found to play a key role in the regulation of various motor functions, the perception of pleasure and pain, motivated behaviour, and reward-associated learning by acting in various brain regions such as the nigrostriatal and mesolimbic dopaminergic pathways [1]. DA signaling has also been highly implicated in multiple diseases including schizophrenia, Parkinson’s disease, as well as substance abuse and learning disorders [2-4]. As such, understanding how DA dynamically contributes to various biological and behavioural responses is vital in order to logically advance the treatment for various diseases, pain and addiction. Recently, it has become clear that disorders of the dopamine systems can be attributed to more than just the dysregulation of dopamine. Opioid peptides are critically involved in a variety of physiological functions necessary for adaptation and survival, and as such they show tremendous promise as potential therapeutic targets. Mesolimbic opioid peptides are important mediators of hedonic and motivational aspects of reward processing [1-4], and aberrant opioid activity is heavily implicated in drug addiction and reinforcement [6-11]. However, the precise interaction between opioids such as Met-Enkephalin and the mesolimbic dopamine circuitry remains ambiguous, despite nearly four decades of research, largely due to the paucity of methods for direct detection of rapid opioid peptide fluctuations in situ. In the case of neurodegenerative diseases like Parkinson’s disease, understanding the cause requires studying more than the dopamine itself.
2 with behaviours, on the sub-second time scale of neuronal activation. Moreover, the methods and techniques employed to detect neurochemicals necessitate the utilization of spatially precise analytical tools to reduce physical damage to brain tissue.
1.1 Neurotransmission
The basic processing units in the central nervous system (CNS) are specialized cells called neurons. Structurally, neurons typically have a dendritic region, near the cell body, that serves as the receiving end to transmit signals to the cell body. The cell body takes this information and intracellularly integrates it with other incoming signals to either facilitate, inhibit, or modulate cellular activity and function. Beyond the cell body, neurons have an axon which extends and is able to send information to other neurons at the axon terminal (Figure 1A). Neurons can send and receive information through both electrical and chemical means.
For chemical neurotransmission, signaling molecules in the brain are often referred to as neurotransmitters and when a cell is activated, it will have an increased likelihood of releasing its neurotransmitter contents into the extracellular space. This generally occurs at a synapse, a physical gap (~20 nm, Figure 1B) between the pre-synaptic neuron and the post-synaptic neuron. Once in the extracellular space, neurotransmitters can bind to membrane proteins called receptors (Figure 1) that are specialized to receive information from that molecule. Once receptor activation occurs, this can induce signal transduction which can alter intracellular
Figure 1: A) Schematic representation of segments of the neuron. B) Chemical synapse between two neurons [5]
A
3 activity in the receiving, post-synaptic cell. Electrical signals can pass through a conductive region called an electrical synapse, a gap only a couple nanometers to another neuron. In this electrical synapse, neurons react with one another though the flow of small cytoplasmic molecules, ions, and electrical currents between them. The electrical signals between neurons can bi-directionally influence each other’s activity quickly.
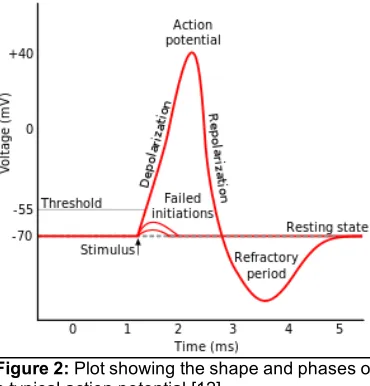
Neurons receive electrical and chemical inputs, which serve to increase or decrease the likelihood of the cell firing, or producing an action potential. The resting potential of the neuron is maintained by ion pumps and changes in potential are mediated by metabolically driven, voltage-gated ion channels. When the membrane potential is near the cell’s resting potential, these channels are closed. Upon depolarization to a potential at or beyond the cell’s threshold potential, an action potential occurs. This all-or-none event (Figure 2) occurs when the resting membrane potential becomes sufficiently depolarized (i.e. more positive) at or beyond that cell’s threshold, for the cell to fire an action potential.
There is a characteristic rising phase where Na+ channels open allowing a large influx of extracellular Na+ ions into the cell (thus transmembrane voltage rapidly increases). After the positive spike in membrane potential, the Na+ channels rapidly close. Thereafter, the repolarization process begins as the K+ channels open and intracellular K+ ions flow out into the extracellular space (transmembrane voltage decreases). The K+ channels close slowly, thus there is a brief period where the cell is hyperpolarized. During this refractory period, neurons
4 cannot fire another action potential and the number of incoming stimuli and output activity are regulated. Action potentials propagate down the axon to synaptic terminals, and this can initiate the release of neurotransmitters into the extracellular space.
Once neurotransmitters or neuromodulators are released, they can (1) undergo breakdown by enzymes in the extracellular space, (2) be recycled via uptake by transporters or (3) interact with the cell surface through receptor activation. Receptor binding initiates signal transduction or an intrinsic biochemical response in that neuron. As it depends entirely on the unique ligand-receptor interaction, there is a spectrum of induced physiological responses. While an agonist stimulates signal transduction through that receptor type, an antagonist would block this biological response, and an inverse agonist would produce a mechanism opposite of the agonist. In general, all receptors have endogenous agonist but various exogenous and synthetic ligands have a range of receptor effects [6].
1.2 Traditional approach to molecular monitoring
high-5 performance liquid chromatography (HPLC), capillary electrophoresis, immunoassay and mass spectrometry [7].
Though microdialysis coupled with these methods has been refined to yield excellent chemical sensitivity and selectivity, significant disadvantages still remain. Spatial resolution is a challenge when incorporating the microdialysis probe. The probes cause significant tissue damage upon insertion and are proportionally larger than the typical nerve terminal and many brain nuclei. Histology has shown that tissue perturbation can span over 1 mm from the implantation site. In addition to the spatial disadvantages, temporal resolution is limited as the flow rate of ~1 µL/min restricts sampling collection to intervals of tens of minutes for the collection. Neuronal activation is believed to occur on a sub-second time scale, thus, the temporal resolution necessary to relate changes in analyte concentrations to neuronal or behavioural activation is not afforded by this method. To evaluate the relationship between specific chemical fluctuations and discrete behaviours, real-time measurements are required, bringing the necessity for sensitive analytical tools with high temporal resolution [8]. The biggest disadvantages from the standpoint of neurochemical analysis is lack of temporal/spatial resolution and that many neuropeptides remain undetectable through microdialysis-coupled techniques.
1.3 Electrochemical approach to molecular monitoring
6 reference electrodes. The use of microelectrodes negates the need for a counter/auxiliary electrode as there is a significantly lower ohmic drop [8]. Two of the most common electrochemical techniques utilized in neurochemical monitoring are amperometry and voltammetry.
1.3.1 Amperometry
In amperometric studies, a constant potential is applied to the working electrode with respect to the reference electrode, typically Ag/AgCl. The potential chosen is sufficient to oxidize or reduce the analyte(s) of interest. With this application, an electron transfer reaction generates measurable current. Amperometry typically uses sampling rates in the kHz range, thus signals can be resolved on a sub-millisecond time scale and there is high temporal resolution. The measured current is then represented in a graph of current vs. time called an amperogram. Faraday’s law mathematically explains that the flow of electrons, current, is directly proportional to the amount of charge generated (Equation 1).
By using this law, quantification is possible through integration of the current with respect to time. However, amperometry is inherently nonselective as all electroactive compounds including interferences that can oxidize or reduce at the given holding potential will contribute to faradaic current in the recorded signal(s), thereby convoluting the conclusions that can be drawn from the current responses measured. As such, independent selective measures are required to confirm that amperometric traces are due to specific molecules, making amperometry poorly suited for measuring neurochemicals given the complex environment of the brain containing various electroactive species [8].
Q=nNF
7 1.3.2 Fast-Scan cyclic voltammetry
Background-subtracted fast-scan cyclic voltammetry (FSCV) allows for greater chemical selectivity with high temporal resolution and sensitivity. Rather than holding the potential at the working electrode, FSCV scans the potential in a cyclic pattern called a waveform. The potential limits are selected so the formal potential (Eo’) of the targeted oxidized/reduced couple lies within the potential range. In the example of dopamine and hydrogen peroxide (H2O2), a triangle waveform is applied with a linear ramp in potential from the holding potential -0.4 V (vs. a Ag/AgCl reference electrode) up to +1.4 V and immediately back down to -0.4 V at a rate of 400 V/s and applied at a frequency of 10 Hz (Figure 3A). During this application, dopamine is oxidized to dopamine-ortho-quinone at ~+0.6 V on the forward scan and H2O2 is oxidized to oxygen and two protons at ~+1.4 V. The H2O2 oxidation peak is evident on the cyclic voltammogram on the reverse scan, due to filtering by the
instrumentation. In the reverse scan, dopamine-ortho-quinone is reduced back to dopamine at ~ -0.2V. The oxidation of H2O2 is chemically irreversible within these potential limits therefore, there is no reduction peak (Figure 3B). Holding the electrode at a negative potential
8 (-0.4 V) between scans allows the positively charged dopamine to pre-concentrate at the electrode surface.
Each cycle of waveform application results in a cyclic voltammogram (CV), with the potential of the electrode on the x-axis and the resultant current on the y-axis. Due to the high scan rates, the majority of the current collected is a non-faradaic charging current from the electrode but this is stable over tens of seconds and can be subtracted out of the voltammogram (Figure 3C, D). The background-subtracted cyclic voltammogram (CV) depicts contributions of faradaic current at various potentials to serve as a fingerprint for analyte identification (Figure 3E). The distinct oxidation/reduction potentials of analytes allows for selectivity and a means to identify analytes based on their distinctively shaped voltammograms and peak positions. Changes in the shape of the CV also aid in the identification of interferences and provide information on redox potentials, reversibility, electron transfer kinetics and coupled chemical reactions.
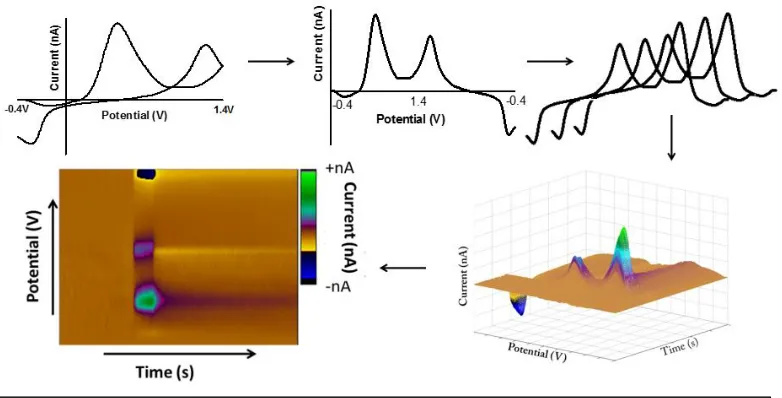
With a short collection time of 20-60 seconds at a collection frequency of 10 Hz, a set of files contains 200-600 CVs. Thus, colour plots are used to provide a more concise way to visualize the data. Colour plots provide a three-dimensional depiction of the data with acquisition time along the x-axis, applied voltage along the y-axis, and current represented
9 in false colour (Figure 4) [9]. The scale bar indicates the intensity of the change in current. Chemic
al information can be extrapolated from the colour plots including analyte identification (vertical line at any time point) and sub-second dynamic information (horizontal line at any potential) describing changes in concentration. Extracting a vertical line at a given time point allows for qualitative evaluation of obtained CVs. Extracted CVs are used to convert current at a specific peak potential to concentration. This is done with calibration factors generated from in vitro training sets utilizing known standards for that analyte and concentrations that span the physiological range.
Principal component regression (PCR) is a statistical approach that can be utilized to reduce the dimensionality of the data when multiple sources are contributing to an electrochemical current [45], enabling individual chemical contributions to be extracted from the complicated signal. PCR can be thought of as a combination of both principal component analysis (PCA) and inverse least-squares regression. PCA accounts for variability in the data and assigns principal components, which describes the data in fewer variables than originally present. The first principal component, PC1, is the direction through the data which describes the most variability, for example the peak current when running a standard of DA. The following PCs are orthogonal to one another and describe the amount of variability remaining in the data. Ultimately, only PCs that describe relevant information (as detected by an F-test) are retained and given scores. Unknown concentration values can be calculated through regression analysis (Equation 2) [46] where A is the voltammogram of the unknown to be predicted, F is the regression coefficient which relates unknown concentration values of each analyte to the relevant PCs, and V is a matrix of the relevant PCs (superscript T means matrix is transposed). PCR works well as an analytical chemometric tool when the voltammograms of target analytes are distinctly different, such as DA, pH-shifts, and H2O2. However, this approach can be complicated when voltammograms of separate analytes have similar oxidation peaks.
𝑪𝒖𝒏𝒌 = 𝑭𝑽𝑪𝑻𝑨 𝒖𝒏𝒌
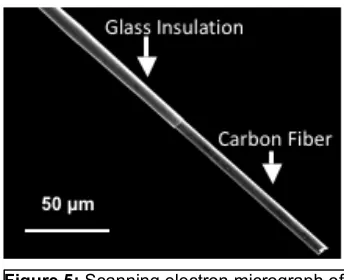
10 For the past 40 years, the standard tool used with FCSV are cylindrically shaped carbon-fiber microelectrodes (CFMEs) with fiber diameters ranging between 5-30 µm (Figure 5). Typically, the sensing region is a fiber extending ~80-300 µm beyond a glass seal. By utilizing these micrometer scale electrodes, the time constant is lower and high speed measurements are enabled. CFMEs are ~40X shorter and 50X smaller in diameter than the typical microdialysis probe, making them particularly well-suited to probe brain regions that have variations in the density of neuronal terminals over these dimensions [10]. Furthermore, carbon materials are an advantageous sensing substrate for in vivo applications because they have wide potential windows, are biocompatible, chemically inert, and inexpensive. For in vivo measurements, carbon material is ideal as the surface is rich in oxygen containing functional groups that play a significant role in electron-transfer kinetics and the surface can be regenerated by electrochemical oxidation [8,11]. The regeneration of the electrode surface in real-time allows for consistency in the electrochemical properties of carbon electrodes and prevents bio-fouling, which can occur if cellular matter adsorbed or blocks the sensing surface.
Long-term measurements of dopamine and H2O2 are difficult to gather using the traditional glass microelectrode due to the fragility of the glass insulation and the necessary removal of the electrode following each acute experimental session. Fused-silica insulation can be used in place of glass, and these are commonly referred to as chronic electrodes. This approach allows for permanent implantation and stable detection of analytes for weeks to months at a time, at one spatially discrete recording site. The carbon fiber is the same as that
11 used in glass microelectrodes and has been shown to perform the same for the detection of dopamine and H2O2. [43, unpublished results from Sombers lab]
1.4 Opioid peptides and addiction
Endogenous opioid peptides are neuropeptides naturally produced in the CNS and peripheral nervous system (PNS) and are comprised of various sequences of amino acids. Classic alkaloid opiates and synthetic opiates like morphine and heroin are thought to mimic the effects of these opioid peptides. Endogenous opioid peptides function as neurotransmitters, hormones and neuromodulators. Endogenous opioid peptides that serve as hormones, such as adrenocorticotropic hormone (ACTH) and melanocyte-stimulating hormone (MSH) are secreted into the circulation by their producing glands where they induce a response in a variety of distant target tissues. In addition, endogenous opioid peptides can serve as neuromodulators, such as endorphins and enkephalins, where they exert modulatory influence on neuronal activity within the brain. Overall, endogenous opioid peptides produce a large influence on physiological functions, ranging from the gastrointestinal motility to stress management, and these peptides are critically involved in pleasure, pain, and motivation [13-15]. Opioid peptides are known to act as endogenous agonists for delta (δ), mu (µ) and kappa (κ) opioid receptors [16]. Broadly, agonists of δ- and µ-receptors increase euphoria and are readily self-administered, while κ-agonists typically produce dysphoric effects and aversion [17].
12 beta-endorphin and Met-Enk. Based upon electrophysiological studies, these are known to exhibit distinct physiological effects but not always. As such, the use of labeling or electrophysiological studies to identify and study its effects on particular neurons is not reliable.
Though much research has been conducted on endogenous opioids, relatively little is known about when and where opioid peptides are released, or the precise physiological conditions necessary for their release. Radioimmunoassay has been employed to study the distribution of the pre-propeptides that are later cleaved into the opioid peptides but has proved difficult for studying the opioid peptides themselves. Techniques coupled with dialysis also suffer from same insufficient temporal resolution and spatial resolution when used for the study of these neurotransmitters. [41,42]
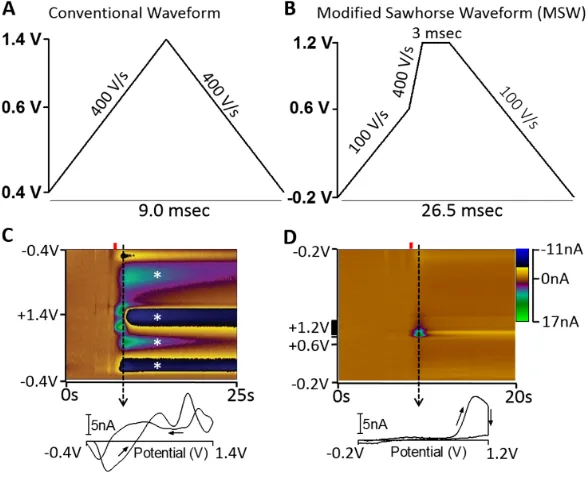
Previous work in Sombers lab has focused on the direct detection of rapid opioid peptide fluctuations in situ utilizing a modified sawhorse waveform (MSW) in place of the traditional triangle waveform (Figure 6A). With the MSW, the potential is ramped from -0.2 V to +0.6 V at 100 V/s, then to +1.2 V at 400 V/s and held for three milliseconds, after which
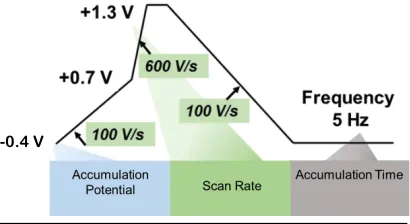
13 the potential is then ramped back to -0.2 V at 100 V/s (Figure 6B). This waveform takes 26.5 milliseconds to apply allowing for measurements at 10 Hz. The faster rate in the MSW is applied only in the potential range of oxidation for our analyte of interest (~1.0 V) since current is known to be directly proportional with scan rate. Using a slower scan rate during the remainder of the sweep reduced the faradaic contributions from other analytes. Holding the potential at +1.2 V for three milliseconds was done to weaken the adsorption of tyrosine onto the electrode surface and reduce the noticeable biofouling apparent while using the triangle waveform (Figure 6C). With the MSW, it is easier to resolve the oxidation of two separate amino acids, the tyrosine residue oxidizes at ~ +1.0 V and a methionine oxidation peak during the holding time at +1.2 V (Figure 6D) [27]. This work enabled the measurement of tyrosine-containing neuropeptides in living adrenal tissue, but further characterization of the approach is needed in order to transition to monitoring Met-Enk in the complex chemical environment of the brain. The modified sawhorse waveform underwent further optimization (Figure 7), which was used for the collection of electrochemical data for specific aim 1. The optimized waveform, begins with a potential of -0.4 V which is ramped to +0.7 V at 100 V/s, then to +1.3 V at 600 V/s, followed by a three millisecond hold at +1.3V, after which the potential is then ramped back down to -0.4 V at 100 V/s. This optimized waveform takes 32 milliseconds to apply allowing for measurements at 5 Hz.
The work within specific aim 1 will focus on improving the selectivity when utilizing CVs for the identification of Met-Enk and opioid peptides by systematically characterizing the voltammetric responses of individual amino acids and chain combinations of amino acids. This work will provide the foundation for the reliable identification of individual neuropeptides employing FSCV, allowing for in vivo detection.
Figure 7: Optimized modified sawhorse waveform
14
1.5 Rotenone and Parkinson’s Disease
Parkinson's disease (PD) is the second most common neurodegenerative disorder after Alzheimer’s disease. It is characterized clinically by motor symptoms such as bradykinesia, resting tremors, rigidity and postural instability. The pathological hallmarks of PD are marked loss of dopamine neurons in the substantia nigra pars compacta (SNpc) and the presence of Lewy bodies in surviving dopamine neurons [28]. Normally, the SNpc dopaminergic neurons project to the dorsal striatum and dopamine released in this region helps to initiate and facilitate motor control. This region communicates with other basal ganglia nuclei to ultimately coordinate movement. The death of nigral neurons causes a breakdown of this system and results in motor dysfunction. Only approximately 10% of PD cases are attributed to a familial cause while ‘sporadic’ or ‘idiopathic’ PD accounts for other 90%. While the exact causes of idiopathic PD remain unknown, epidemiological studies have suggested that exposures to pesticides, metals and solvents are contributing risk factors. Generally, sporadic cases are believed to stem from a combination of environmental exposures and individual genetic susceptibility [29-36].
Exposure to pesticides such as paraquat and rotenone can produce a 2.5-fold increase in the risk of developing PD [37]. Both of these environmental toxins appear to cause the death of dopaminergic neurons via oxidative stress caused by profound increases in the generation of reactive oxygen species (ROS), such as oxygen radicals, hydroxide radicals and nitric oxides. Under normal physiological conditions, ROS are byproducts of cellular metabolism [38, 41]; however, increased concentrations over time induce neuronal cell death which contributes to neurodegeneration seen in multiple disorders. These free radicals are highly reactive and cause major cellular damage by pilfering electrons from other molecules and impairing cell function. Rotenone is also believed to interfere with the normal neuronal clearance of damaged and degraded proteins which accumulate and derail various cellular processes. [38-42]
15 superoxide dismutase converts O2· into H2O2. The relatively high concentrations as well as the electroactivity and increased stability of H2O2 over O2· makes it a good candidate for the quantification of oxidative stress [38].
16
II. Materials and Methods
2.1 Electrochemical Chemicals
All chemicals were purchased from Sigma-Aldrich (St. Louis, MO) and used as received, unless otherwise specified. Methionine-enkephalin was obtained from LKT Laboratories (St. Paul, MN). In vitro electrochemical experiments were carried out in 0.1 M phosphate buffered saline (PBS) at physiological pH 7.4. All aqueous solutions were made from double deionized water >18 MΩ·cm (Millipore, Billerica, MA). Rotenone was dissolved in 98% Miglyol 812 N (Sasol Limited, Witten, Germany) and 2% dimethyl sulfoxide (DMSO) (Fisher Scientific, Waltham, MA).
2.2 Peptide Synthesis
Coupling of amino acid residues with (Fmoc)amino acids (300 mol %) was performed according to general solid-phase peptide synthesis protocols using HBTU (300 mol %), DIEA (600 mol %), and DMF for 1h. [49] (Fmoc)amino acids were purchased from Chem Impex Itl. (Wood Dale, IL). Preloaded L-Met-Wang resin (0.7 mmol/g) and L-Phe-Wang resin (0.342 mmol/g) were purchased from Sigma-Aldrich (St. Louis, MO) and Gyros Protein Technologies (Tucson, AZ), respectively. The manufacturer’s reported loading of the resin were used in the calculation of the yields of the final products. Truncated peptide YGGF was manually synthesized in filtration tubes equipped with caps and stocks. Truncated peptide GGFM was synthesized using a Biotage SyroWave (Charlotte, NC) after troubleshooting using manual synthesis.
17 using water and chloroform and the aqueous layer was freeze-dried, yielding the peptide as a white powder. Resulting peptide samples were dissolved in MeCN:H2O (1:1) then run on LC-MS (Grace Vydac (218TP) 5 µm,150 mm x 4.6 mm C18 Vydac column, 300 Å~, particle size 5 µm) with solvent A, H2O (0.1% TFA), and solvent B, acetonitrile (0.1% TFA) at 60°C at a flow rate of 0.5 mL/min.
Peptide YGGF: HPLC (5−95% MeCN, 22 min) retention time = 7.767 min; LCMS (ESI) calculated for C22H26N4O6 [M + H]+ 442.2, found m/z 443.2 YGGF has a yield of 60% with 85% purity when integrated at 214nm.
Peptide GGFM: HPLC (5−95% MeCN, 22 min) retention time = 7.966 min; LCMS (ESI) calculated for C18H26N4O5S [M + H]+ 410.2, found m/z 411.2 YGGF has a yield of 32% with 89% purity when integrated at 214nm.
Both crude peptides were used without further purification.
2.3 Glass Electrode Fabrication
In vitro electrochemical experiments were carried out with cylinder carbon-fiber microelectrodes which were fabricated by aspirating a single T-650 polyacrylonitrile (PAN) carbon-fiber into a borosilicate glass capillary (1.0 mm x 0.5 mm diameter, A-M Systems, Carlsburg, WA). The glass was pulled using a micropipette puller (Narishige, Tokyo, Japan) forming a tapered seal around the carbon fiber, which was then cut to 100-200 µm under microscope. To establish an electrical connection with the carbon fiber, the glass capillary was backfilled with ionic solution (4 M potassium acetate, 150 mM KCl) and a wire lead was inserted. All potentials were applied against a Ag/AgCl reference electrode (World Precision Instruments, Inc., Sarasota, FL).
2.4 Chronic Electrode Fabrication
18 for 24 hours. A seal was created using fast hardening 5-minute epoxy (McMaster Carr, Atlanta, GA) at straightest end of the silica tubing. An electrical connection with the carbon-fiber was made with a gold pin (Newark Element 14, Palatine, IL) and a highly conductive silver epoxy (MG Chemical, Thief River Falls, MN). After drying for at least 24 hours, the connection was insulated using fast curing epoxy and electrodes were subsequently placed in a 100ºC oven for 20 minutes to allow epoxy to cure. The exposed carbon fibers were cut to 100-150 µm under a stereoscopic microscope.
Dual micro-electrode devices (DMEDs) were fabricated by placing two chronic electrodes less than 200 µm apart under a stereoscopic microscope and cementing them together using dental cement (Dentsply, York, PA). For in vivo applications in awake freely moving animals, smaller diameter fused silica tubing was used (75 µm o.d./18 µm i.d.) and cut to 12 mm in length to minimize. All other aspects of the chronic electrode fabrication protocol remained unchanged.
2.5 Flow Injection Apparatus
19 2.6 Electrochemical Data Collection
For Specific Aim 1, an optimized modified sawhorse waveform (MSW) was applied at 5 Hz for peptide detection experiments [27]. The potential was held at -0.4 V, ramped to +0.7 V at 100 V/s, and then to +1.3 V at 600 V/s. The potential was held at +1.3 V for 3 msec before scanning back to the holding potential of -0.4 V at 100 V/s. For Specific Aim 2, a waveform optimized for the electrochemical detection of H2O2 was applied to the CFM [47]. The potential window ranged from -0.4 V to +1.4 V, applied at 10 Hz at 400 V/s. Once positioned, the electrodes were cycled at 60 Hz for 10 minutes and then at 10Hz for 10 minutes prior to data collection. A custom-built instrument for potential application and current transduction (University of North Carolina at Chapel Hill, Department of Chemistry, Electronics Facility) HDCV software (University of North Carolina at Chapel Hill, Department of Chemistry, Electronics Facility) controlled waveform input and current output. A 6363 PCIe bus card (National Instruments Corp., Austin, TX) was used for waveform output and synchronization of the electrochemical experiment with the flow injection system. Signal processing (background subtraction, signal averaging and digital filtering (2-pole Sallen-Key Filter, 2 KHz)) was software controlled. All electrochemical data collection was performed within a custom-built Faraday cage.
2.7 Animal Subjects and Care
20 2.8 Surgery and Chronic Drug Administration
In animals undergoing survival surgery, rats were anesthetized with 4% isoflurane (Vetequip; Pleasanton, CA), and maintained at 1.5-2.0% during surgery. Subjects were positioned into a stereotaxic frame (Kopf Instrumentation; Tujunga, CA). A heating pad (Harvard Apparatus, Holliston, MA) was used to maintain body temperature at 37°C. Electrodes were positioned according to coordinates from the Paxinos and Watson [48] rat brain atlas, relative to bregma. The Ag/AgCl reference electrode guide cannula was placed in the contralateral forebrain, and two chronic working electrodes were placed in the dorsal medial striatum (AP: +1.2 mm, ML: +2.0 mm, DV: 5.0 mm) and one chronic electrode was placed in the substantia nigra (AP: -5.0 mm, ML: +2.0 mm, DV: -8.0 mm). The components were permanently affixed with dental cement. The animals were allowed to recover for 3 weeks before experiments began. After recovery, rats were injected (i.p) once per week day with 2.75 mg/kg bodyweight of rotenone solution prepared by dissolving in 100% DMSO and diluted in Miglyol 812 N for the final concentration of 2.75 mg/mL rotenone in 98% Miglyol 812 N, 2% DMSO. Fresh solutions were made for each injection. Control animals received vehicle (98 µL Miglyol/20 µL DMSO) only. Injections were administered every week day for 28 days. On the day of each experiment, acute Ag/AgCl reference electrodes were placed into the electrode guide cannula.
2.9 Electrochemical and Behavioural Recording
21 Rotorod testing is used to assess motor coordination and balance alterations in the subjects. Testing was performed on a Roto-Rod Series 8 (IITC Life Science, Inc., Woodland Hills, CA) which was accelerated the from 0 to 20 RPM over 60 seconds and then continued at 20 RPM for another 60 seconds. Each test day (4 days over the course of 28 days) consisted of three trials that concludes either when the rat fell off the rotorod or after the full 120 seconds had transpired.
The Cylinder Test allows evaluation of forelimb deficits. The rat was placed in a 25 cm tall by 20 cm i.d. clear acrylic cylinder and video recorded for 15 minutes. The number of rear behaviours with a rear being the raising of the forelimbs (right, left or both) above shoulder level and making contact with the cylinder wall. A single rear was counted until both forelimbs were once again in contact with the bottom surface of the cylinder.
2.10 Data Analysis and Statistics
In vitro data were used to establish a training set of DA, H2O2 and pH voltammograms for identifying and predicting unknown concentrations of analytes in files collected in vivo. All data presented are shown as the mean ± standard error of the mean (SEM). Unless otherwise noted, all statistical and graphical analysis was carried out using GraphPad Prism 7 (GraphPad Software, Inc., La Jolla, CA).
22
III. Voltammetric Detection of Amino Acids for the Selective Identification of Met-Enkephalin In Vivo
3.1 Background
Opioid peptides are of significant interest to researchers as they are implicated in a wide variety of physiological functions including, but not limited to, motivation, nociception, emotion, response to stress and feeding behaviour. Thus, they show tremendous promise as potential therapeutic targets. Studies have shown mesolimbic opioid peptides as important mediators of hedonic and motivational aspects of reward processing [50-53], as well as heavily implicating aberrant opioid activity in drug addiction and reinforcement [54-58]. However, despite nearly four decades of research, the specific role of opioid peptides, as well as their precise interaction with the circuitry of mesolimbic dopamine, remain ambiguous. Current understanding of the roles of endogenous opioid peptides in physiological function is almost entirely inferred from indirect measures of opioid activity [60]. This is largely due to the scarcity of methods allowing the direct detection of rapid opioid peptide fluctuations in situ. As a result, relatively little is known about when and where opioid peptides are released, or the precise physiological conditions necessary for their release and clearance.
23
3.2 Results
Developing a new bioanalytical method for investigating neurochemical dynamics begins with validation of the approach in vitro. Selectivity has been a long-standing issue with peptide identification, as immunoassay results have been found to be ambiguous due to cross-reactivity of the labeled antibody with similar peptides [61]. Selectivity is also a concern when using electrochemical detection techniques, and it is especially important for electrochemical approaches to molecular monitoring in vivo. When using FSCV for molecular identification, assignment of peptide identity relies on the redox activity of its electroactive amino acids tyrosine, methionine, tryptophan, etc. [62]. However, other peptides in the brain also contain these residues and the effects of the adjacent residues on redox properties have not been fully characterized. This work aims to quantitatively explore if the electrochemical signal for constituent amino acids can be reliably used to identify peptides and if incorporation into a polypeptide affects the sensitivity of electrodes to the amino acid.
To begin, tyrosine (Tyr) and methionine (Met) were selectively investigated to identify individual amino acid contributors to the voltammetric signal when these residues are incorporated into a peptide. These amino acids were chosen as they were expected to be
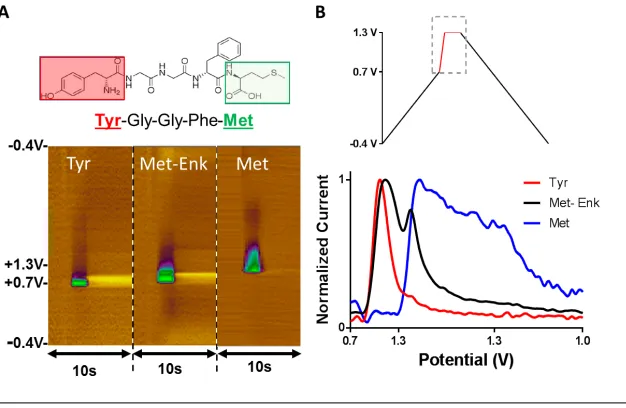
Figure 8: A) Representative colour plots for 2 μM Tyrosine (left), 2 μM Met- Enk (middle), and 40 μM Methionine (right). B) Current collected during the potential hold period, plotted versus waveform point number and labeled with portion of applied potential as indicated by the dashed box.
24 electroactive based on their molecular structure. Although many opioid peptides share the same NH2-terminal amino acid sequence (Tyr-Gly-Gly-Phe-), Met-Enk is a short five amino-acid connected through peptide bond and terminating with a methionine residue (Figure 8A). Each peptide bond is the result of a dehydration synthesis reaction where a chemical bond is formed between two amino acids when the alpha-carboxyl group of one amino acid reacts with the amino group of the other amino acid, releasing a molecule of water (H2O).
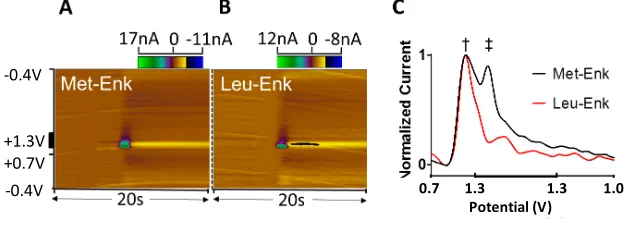
The electroactive residues, tyrosine and methionine, are bound at the ends of the molecule which may allow open access to the electrode surface, and facilitate detection. As seen in Figure 8, colour plots and overlaid voltammograms identify tyrosine as the species underlying the principal peak observed for Met-Enk (Figure 8A left and middle, respectively). A second, smaller peak is observed during the hold at 1.2 V. Though also visible in the colour plot, this second peak is better visualized when the voltammogram is unfolded and plotted with waveform point number (each indicative of a defined potential) on the x-axis (Figure 8B). The voltammogram for methionine (Figure 8A, right) identifies it as the principal contributor to the second peak of Met-Enk. Both tyrosine and methionine have been found to generate currents that increase linearly with respect to concentration when introduced to the electrode surface (Figure 10, calibration curves). Thus, the presence of both signals can be used to identify Met-Enk [16]. As seen in Figure 9, Met-Met-Enk can be clearly distinguished from Leu-Met-Enk by the presence of the methionine peak. However, as several neuropeptides contain tyrosine and methionine residues and the full spectrum of potential interferences that contain these residues still remains to the determined.
Figure 9: Colour Plot of A) Met-Enk and B) Leu-Enk. C) Current plotted versus point number in the applied waveform. Analytes share the same primary peak (†), but can be visually distinguished by the secondary peak (‡) inherent to Met-Enk.
-‐0.4V +1.3V +0.7V
25 Voltammetry has the capability to resolve multiple analytes in a complex mixture through evaluation of voltammetric peak shape and position. Typically, the current generated by samples containing multiple electroactive analytes is additive, with the sum of the voltammograms for each analyte comprising the voltammogram for the mixed sample [63]. For Met-Enk, with a single Tyr and single Met residue, the voltammogram should present a 1:1 ratio of current contributions from Tyr/Met. Interestingly, they are very rarely exactly equal in current and the amplitude of the currents associated with these residues fluctuates. Also, as seen in the calibration curves of Figures 10 and 11, when Tyr and Met are analyzed alone, our
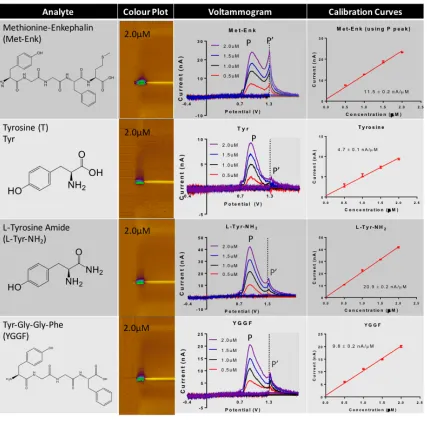
Figure 10: Chart of investigated natural amino acid, functionalized amino acid and truncated peptide with corresponding colour plots, voltammogram and calibration curves for review of the contribution of Tyr to the signal of Met-Enk
26 voltammetric approach is much more sensitive to Tyr than Met. At 5 Hz, Tyr with a concentration of 2.0 µM will result in a current of ~9nA while Met needs to be at a concentration of 40 µM to achieve equivalent current.
To better understand the amino acid contributions to signal, cyclic voltammograms (CVs) for Tyr and Met were compared to the CV for L-tyrosine amide (L-Tyr-NH2) and acetyl-L-methionine (Ac-Met-OH), respectively. These species are more equivalent to the nature of the Tyr and Met residues in Met-Enk (Figure 12). It was found that the electrode sensitivity
Figure 11: Chart of investigated natural amino acid, functionalized amino acid and truncated peptide with corresponding colour plots, voltammogram and calibration curves for review of the contribution of Met to the signal of Met-Enk
27 from L-Tyr-NH2 was actually greater than that from Tyr and it exhibited a second peak (P’). This P’ peak is thought to be due to the current not decaying to baseline before the onset of the +1.3V hold discussed in Chapter 1 (Figure 7). The peak ratio of primary peak (P) to P’ was ~3:1 at all concentrations. A different trend was evident for Ac-Met-OH, as there was less sensitivity for Ac-Met-OH than for Met. There was no change in the oxidization potential compared to Met and the current from Ac-Met-OH also did not return to baseline.
It was then considered that the electrochemical signature for an amino acid within a peptide may be dependent on the chemical nature of the residues in the sequence. For instance, the overall charge associated with a particular molecular conformation could assist in drawing the analytes to the electrode, and contributing to the current strength. To test this hypothesis, the truncated peptides Tyr-Gly-Gly-Phe (YGGF) and Gly-Gly-Phe-Met (GGFM) were synthesized in collaboration with Dr. Caroline Proulx, as explained in the Methods section. Importantly, neither Gly nor Phe produced much current when analyzed alone. The sensitivity of peptide YGGF, as shown in Figure 10, was found to be closer in similarity to the Tyr peak of Met-Enk (i.e. At 1.5 µM, YGGF has a current of 14.6 nA while the Tyr peak of Met-Enk
28 has a current of 18.1 nA). Similar to the amidated form, there was a P’ peak and a P:P’ ratio of ~2:1. It is important to note that the Met signal from GGFM is similar to the Met signal in Met-Enk itself. Though, electrodes showed low sensitivity to Ac-Met-OH and Met, GGFM had an electrode sensitivity comparable to Met-Enk, allowing for analysis at concentrations on scale with Met-Enk. It is also noteworthy that while the signals from Ac-Met-OH and Met do not readily return to baseline in the +1.3V hold period of the waveform, GGFM yields a very clean sharp peak similar to the Met peak in Met-Enk (Figure 13).
Figure 13: Overlays of the signal from analytes for comparison to the Met-Enk’s Tyr peak (A) and Met peak (B) for easier visual comparison.
29
3.3 Discussion
To determine the extent that adjacent amino acid attachment attribute to the signal of Tyr and Met within Met-Enk, further truncated peptides (Table 1) would need to be synthesized and studied as was done with the truncated peptides presented herein. Further truncation of Met-Enk could result in electrochemical signals becoming less characteristic of Met-Met-Enk and more like that from individual amino acids. Considering the enhance sensitivity of GGFM compared to Ac-Met-OH and Met, it seems more plausible that the increase in sensitivity is a result of Met residue attachment to a Phe residue, as its aromatic structure could result in pi stack with the carbon fiber electrode and assist in drawing the peptide to the electrode surface. This should be particularly evident with synthesized peptide GGM vs GFM.
Table 1: Polypeptides for characterization Met- Enk Tyr - Gly - Gly - Phe - Met Polypeptides Tyr - Gly - Gly
Gly - Gly - Met Gly - Phe - Met Phe - Met
30
IV. Detection of dynamic changes in H2O2 and DA in the striatum following chronic rotenone administration
4.1 Background
As reviewed in Chapter 1, PD is a chronic neurodegenerative disorder characterized by the loss of dopaminergic neurons stemming from the substantia nigra pars compacta (SNpc) that innervate the striatum, as well as intracytoplasmic inclusions of α-synuclein protein known as lewy bodies. A substantial decrease in striatal DA results in the gradual development of devastating hypokinetic movements and motor disturbances, but the main cause(s) of the disease remain poorly understood. Nonetheless, various pharmacological and genetic studies, as well as analysis of postmortem PD brain tissue, have implicated mitochondrial defects, the induction of inflammatory mediators, and increased reactive oxygen species (ROS) in the pathogenesis of PD [70,71]. Specifically, DA neurons of the SNpc have been found to be particularly vulnerable to the oxidative stress created by the generation of endogenous ROS [72-74] and the motor symptoms of PD have a clear link to the degeneration and anatomical loss of these neurons. It is currently unknown whether oxidative stress is an initiator of dopaminergic dysfunction or a consequence of that process but it is clear that oxidative stress and inflammation are critically implicated in the disease. These may prove to be key therapeutic targets to delay and potentially treat the development and progression of PD.
31 understand the physiological interaction between H2O2 and DA in the striatum and determine the role that manifests in the onset of motor complications in a rodent model of PD.
This experiment examines the hypothesis that chronic oxidative stress, generated by administration of rotenone, progressively modulates H2O2 and DA dynamics in the dorsal striatum. Rotenone has been used to generate a model of PD that has recently been improved upon for reproducibility and consistency, in which systemic inhibition of mitochondrial complex I produces selective degeneration of the nigrostriatal DA system and reproduces many key pathological features of the disease [75]. Here, we will investigate how striatal H2O2 and DA dynamics underlie behavioural changes that occur during chronic rotenone administration in a rodent model using FSCV, an electrochemical technique that affords precise spatial and temporal resolution. Specifically, we will take advantage of chronically implanted carbon-fiber microelectrodes to quantify H2O2 and DA fluctuations at single locations in the dorsal striatum over the course of ongoing rotenone administration (acute and chronic), and to study how these signals correspond with the development of Parkinsonian symptoms. These studies will aid in our understanding of how oxidative stress modulates nigrostriatal DA signaling, as well as the behavioural consequences of this interaction.
4.2 Study parameters
Drug naïve, adult male rats received daily systemic injections of either rotenone (Drug Group) or vehicle (Control Group) for 28 days. Once a week, electrochemical measurements were collected as the behaviour of the freely-moving rats was recorded. Electrochemical measurements were collected for all animals to quantify the DA and H2O2 dynamics pre- and post- pharmacological manipulation. Electrode calibration and verification of electrode placement was performed as described in the Methods.
32 or after the full 120s had transpired. For each day, the mean of three trials was taken. Prior to the chronic injections, the rats were trained for five days to perform the test and a baseline was
established. [76]
33
4.3 Results
Overall, the behavioural results are in line with previously published results in terms of a decline in motor performance with rotenone administration [55,56]. As rotenone administration progressed, there was a decrease in the length of time that rotenone subjects were able to walk on the rotorod. As shown in Figure 14A for the time spent on the rotorod, there was an effect of treatment (F(1,10) = 21.5, p < 0.001), of week (F(4,10) = 4.27, p < 0.05) and there was a significant interaction (F(4,10) = 4.27, p < 0.05). Post hoc analysis revealed significant differences by week between vehicle and rotenone treatment, indicating that rotenone-treated subjects spent less time on the rotorod at weeks 3 and 4. There was also a decline in the distance that rotenone subject spent walking on the rotorod. For the distance travelled during rotorod testing, there was a significant influence of treatment (F(1,10) = 28.5,
Figure 14: Behavioural assessment of treated rats. A) Time traveled on rotorod out of 120 seconds based on treatment group. B) Distance traveled on rotorod out of 7.02m maximum based on treatment group C) Rearing behaviour (# of rears per 10 minutes) and D) Percent change in mass. * p < 0,05, ** p < 0.01, *** p < 0.001, compared to vehicle.
34 p < 0.001), of week (F(4,10) = 5.02, p < 0.05), and there was a significant interaction (F(4,10) = 5.02, p < 0.05). As anticipated based on the results from the related time parameter for the rotorod (Figure 14A), post hoc comparisons indicated a significant difference between vehicle and rotenone-treated animals at weeks 3 and 4 (Figure 14B). Thus, there was a decrease in both time spent on the rotorod and distance traveled. In the cylinder test (Figure 14C), there was an effect of treatment (F(1,8) = 38.7, p < 0.001) and week (F(3,8) = 23.3, p < 0.001) as well as an interaction (F(3,8) = 10.8, p < 0.01). In comparison to pre-injection number of rears, subjects treated with rotenone reared less overall throughout and after treatment (i.e. last test without rotenone injection). There was also a gradual decrease in the weight of rotenone-treated subjects opposing the natural increase in weight noticed from the control (Figure 14D). These data indicate an influence of the treatment on the motor behaviour, and that this is a persistent change in locomotor control.
35 Analysis of electrochemical data quantifying H2O2 and DA dynamics in four subjects, was performed as described in the methods section and suggested that the subjects receiving rotenone treatment appeared to fall into two groups, which we have labeled as non-responders and responders. The single non-responder (Figure 16, see subject Rotenone 1) had relatively stable extracellular H2O2 concentrations, examined in 5-min bins, across all test sessions. Notably, the responder group (Figure 16, subjects Rotenone 2,3) included a heavy responder
(Rotenone 3) that did not survive past week 3 of the study and is not in the week 4 plot (Figure
16D). Overall, the responders exhibited increases in H2O2 concentrations that did not appear to have a regular trend in time or between subjects. However regardless of week, there were evident large spikes of H2O2 over the hour studied after rotenone administration compared to the vehicle control (Figure 16).
Figure 15: Method of analysis for H2O2 and DA B
36 The data in Figure 16 were averaged across all 5-min time bins post- injection (60 minutes) (Figure 17). At each week, responders demonstrated increases in H2O2 concentrations, compared to the vehicle (see asterisks in Figure 17A). There was an effect of treatment (F(2,119) = 37.3, p < 0.0001). There was no significant influence of week (F(3,119) = 1.95, p = 0.126) though there was an interaction (F(6,119) = 3.57, p < 0.01). The vehicle group maintained consistent concentrations of H2O2 from week to week. Overall, responders exhibited an increase in their average striatal H2O2 concentration following acute administration of rotenone in comparison from week 1 to week 4, indicating an effect of chronic rotenone administration (Figure 17A, see #). Comparison of H2O2 concentration to behavioural data of responders, showed a clear decline in rotorod performance as the concentration of H2O2 increases throughout the study (Figure 18).
Figure 16: H2O2 concentration for each subject over the course of treatment, weeks 1-4
37 Figure 17: A) Mean ± SEM for extracellular H2O2 and B) Mean ± SEM for extracellular
38 The variability in H2O2 concentration between all subjects was also compared by treatment. It was found that there was an overall increase in the variability as measured by the SEM of H2O2 concentrations of the responders. There was an effect of treatment (F(2,6) = 20.5, p < 0.01) but not of week (F(3,6)= 0.306 p = 0.8207), compared to vehicle. Post hoc comparisons indicated a significant difference between the variability of vehicle and rotenone-treated animals at weeks 3 and 4 (Figure 19A).
As there was an overall increase in H2O2 in the majority of subjects treated with rotenone (i.e. the responders, without the n=1 non-responder), the changes in DA concentrations were further analyzed in these subjects. The data in Figure 20 were averaged for all 5-min time bins across the recording time post-injection. There was no noticeable trend
3 0 0 0 4 0 0 0 5 0 0 0 6 0 0 0
- 1 0 1 2 3 4
[H2O2] µM *s
m e te rs t ra v e le d /m in
Figure 19: A) Total variability in [H2O2] B) total variability in [DA] for subjects
across weeks of treatment * p < 0.05, compared to vehicle for weeks 3 and 4.
Figure 18: Plot of average [H2O2] vs overall
39 to the changes in DA concentrations. As seen in Figure 17B, there was an effect of treatment (F(2,119) = 6.53, p < 0.01), of week (F(3,119)= 2.81, p < 0.05) but only a trending significance of interaction (F(6,119) = 2.09, p = 0.0587). Post hoc analysis revealed that responders demonstrated significantly higher DA concentrations than the vehicle during week 1 while non-responders had an increase in DA concentrations during week 2 that held significance, see asterisks in Figure 17B. There was no significance found for concentration of DA when comparing responders to the control group aside from week 1, though the control also maintained consistent DA concentrations throughout the treatment. There was a significant increase in the concentration of the DA in the responders when comparing week 1 to week 4. This again indicates an effect of chronic rotenone administration (Figure 17B, see #).
Interestingly, the variability in DA for responders and non-responder compared to vehicle was not found to be significant at any point in the study. (Figure 19B)
It was hypothesized that rotenone would cause an increase in H2O2 concentration resulting in the death of DA neurons and the subsequent decrease of DA in the striatum. Recent
40 studies have found that striatal DA release can be compromised by H2O2 signaling during partial mitochondrial dysfunction which suggests a mechanism for functional DA denervation that could contribute to motor deficits before structural degeneration of the nigrostriatal pathway [77]. The dynamic profile for DA fluctuations in the extracellular space were found to be no more variable with subjects under chronic rotenone administration but there was a decrease in overall DA concentrations, possibly as a result of progressive dopaminergic dysfunction. Supraphysiological fluctuations of H2O2 were found to be correlated with behavioural abnormalities while the relationship to DA remains unclear. There was a clear decrease in motor behaviour over the course of treatment with both a decrease in time and distance traveled on the rotorod as well as a decrease in rearing behaviour as seen in Figure 1.
This work demonstrated functional changes in striatal extracellular DA concentrations and H2O2 generation that develop as a result of chronic oxidative stress, and establish how these chemical dynamics are temporally correlated with the progression of behavioural and motor deficits. This data is also particularly valuable because as it has provided more neurochemical characterization of an animal model for PD that has been severely hampered by its own variability, both in terms of percentage of animals that develop Parkinsonian symptoms and the extent of the symptoms. This work will also help to provide an improved understanding of the disease pathophysiology, allowing for enhanced preventative and therapeutic strategies in PD treatment.
4.4 Discussion
41 Parkinsonian behavioural manifestations that are associated with the phenotype in rats such as jaw tremors and body distortions. Such phenotypic behaviour was exhibited by one subject during an initial study that was determined to be faulty due to expired rotenone. There was an incident during the study in which a subject receiving systemic rotenone administration for ~2 weeks began to exhibit Parkinsonian behaviours of tremulous jaw movements (a rat model of resting tremor) and periodic unusual body posture resembling the cataleptic, abnormal postural instability seen in Parkinsonian patients. Striatal H2O2 concentrations were found to be significantly increased during this event as seen in Figure 21 but there was a great deal of variation in overall motor function as seen through rotorod performance over the course of treatment after training rather than a steady decline.
For future experiments, the dose of rotenone could be decreased by 10% with daily injections and/or the study should use older male rats (12-14 months), as these modifications have been shown to assist in the reduction of variability in response to rotenone treatment [75]. Alternatively, the rotenone model could be exchanged for the generation of oxidative stress
Figure 21: Striatal H2O2 augmented during
body distortions induced by rotenone. A) Colour plot that identifying the analyte as H2O2.
Gray bar indicates period of abnormal posture. This was interrupted by a period of grooming (dark gray). B) H2O2 concentration trace over
42 through the direct microinjection of the glutathione peroxidase inhibitor, mercaptosuccinate (MCS) into the substantia nigra.
Future study should be done to increase the number of subjects for both control or rotenone groups to confirm results and yield stronger statistical analysis while taking into account the need for methodological changes to decrease variability as discussed above. Also, as FSCV is better suited for rapid, short measurements, it would also be beneficial to analyze individual events as opposed to gross overall dynamics though this is a very time-consuming process.
43
V. Concluding Remarks
The ability to monitor neurotransmitter release in real time will allow neuroscientists a garner a better understanding of the links between behaviours and the chemical mechanisms that control them. As discussed previously, FSCV has shown great use in the study of catecholamine release in the brain and periphery as well as the dysregulation of the neurotransmission of dopamine due to particular disease states.
Chapter 3 described the quantitative review of electrochemical signal for constituent amino acids to determine if they can be used to identify peptides as well as if incorporation into a peptide affects the sensitivity of electrodes to the amino acid. It was found that amino acid incorporation into the peptide was significant to not only electrode sensitivity but also the characteristics of the electrochemical signal peaks, displaying amino acid signals closer in characteristics than that found from the peptide. Understanding the electrochemical moieties and chemical contributions to the signal will aid in the verification of the signal in live tissue against potential interfering analytes. These results will guide future experiments and interpretation of Met-Enk detection as it progresses from in vitro characterization to in vivo monitoring in the brain. This work promises to assist in further clarifying outstanding questions regarding the fundamental nature of endogenous opioid peptide neurotransmission. In particular, in situ Met-Enk detection is important as there is considerable evidence that neuropeptides modulate a broad range of DA implicated behaviours and brain circuits that govern food-motivated behaviours, drug-reward, and motor control. Indeed, the further characterization of this detection scheme will aid in the development of evidence-based pharmacotherapies for the treatment of a wide range of dopamine-associated states, including substance abuse disorders and PD.
45
REFERENCES
[1] Schultz, W., Annu Rev Neurosci 2007, 30, 259-288.
[2] Creese, I.; Burt, D. R.; Snyder, S. H. Science 1976, 192, 481-483.
[3] Kish, S. J.; Shannak, K.; and Hornykiewicz, O. N Engl J Med 1988, 318, 876-880. [4] Schultz, W.; Dayan, P.; and Montague, P. R. Science 1997, 275, 1593-1599.
[5] http://blog.eyewire.org/behind-the-science-the-anatomy-of-a-neuron/ Accessed 30 Janurary 2016.
[6] Bear, M. F., Barry W. Conners, and Michael A. Paradiso, Neuroscience: Exploring the Brain, 3rd ed.; Lippincott Williams & Wilkins: Baltimore, 2007.
[7] Nesbitt, K. M.; Jaquins-Gerstl, A.; Skoda, E. M.; Wipf, P.; Michael, A. C. Anal Chem
2013, 85, 8173.
[8] Robinson, D. L., Hermans, A., Seipel, A. T., and Wightman, R. M., Chem Rev 2008, 108, 2554.
[9] Michael, D. J., Joseph, J. D., Kilpatrick, M. R., Travis, E. R., and Wightman, R. M. Anal Chem 1999, 71, 394.
[10] Arbuthnott, G. W., and Wickens, J., Trends Neurosci 2007, 30, 62.
[11] Takmakov, P., Zachek, M. K., Keithley, R. B., Walsh, P. L., Donley, C., McCarty, G. S., and Wightman, R. M., Anal Chem 2009, 82, 2020.
46 [13] Cabot, P. J.; Carter, L.; Schafer, M.; Stein, C. Pain 2001, 93, 207.
[14] Kelley, A. E.; Stinus, L.; Iversen, S. D. Behavioural Brain Research 1980, 1, 3.
[15] Gianoulakis, C. Current Topics in Medicinal Chemistry 2009, 9, 999.
[16] Van Wimersma Greidanus, T. B.; Maigret, C.; Torn, M.; Ronner, E.; Van der Kracht, S.; Van der Wee, N. J.; Versteeg, D. H. European journal of pharmacology 1989, 173, 227.
[17] Herz, A. Psychopharmacology 1997, 129, 99.
[18] Marinelli, P. W.; Bai, L.; Quirion, R.; Gianoulakis, C. Alcoholism-Clinical and Experimental Research 2005, 29, 1821.
[19] Lam, M.; Marinelli, P.; Bai, L.; Gianoulakis, C. Psychopharmacology 2008, 201, 261.
[20] Hadjiconstantinou, M.; Neff, N. H. Neuropharmacology 2011, 60, 1209.
[21] Alburges, M. E.; Keefe, K. A.; Hanson, G. R. Brain research 2001, 905, 120.
[22] Hashemi, P.; Dankoski, E. C.; Petrovic, J.; Keithley, R. B.; Wightman, R. M. Anal Chem 2009, 81, 9462.
[23] Kalivas, P. W.; Widerlov, E.; Stanley, D.; Breese, G.; Prange, A. J. J. Pharmacol. Exp. Ther. 1983, 227, 229.
[24] Cousins, M. J.; Lynch, M. E. Pain 2011, 152, 2673.
47 [26] Garland, E. L. Expert Rev Clin Pharmacol 2014, 1.
[27] Schmidt, A.C.; Dunaway, L.E.; Roberts, J.G.; McCarty, G.S.; Sombers, L.A. Anal. Chem, 2014, 86, 7806.
[28] Forno, L. S. J Neuropathol Exp Neurol 1996, 55, 259.
[29] Di Monte, D. A. Clinical neuroscience research 2001, 1, 419.
[30] Fall P.A.; Fredrikson M.; Axelson, O,; Granerus, A. K. Sweden Mov Disord 1999, 14, 28.
[31] Gash, D.M.; Rutland, K.; Hudson, N.L.; Sullivan, P.G.; Bing, G.; Cass, W.; Pandya, J.D.; Liu, M.; Choi, D.Y.; Hunter, R.L.; Gerhardt, G.A.; Smith, C.D.; Slevin, J.T.; Prince, T.S. Ann Neurol. 2008, 63, 184.
[32] Gorell, J.M.; Johnson, C.C.; Rybicki, B.A.; Peterson, E.L.; Kortsha, G.X.; Brown, G.G.; Richardson, R.J. Neurology 1997, 48, 650.
[33] Gorell, J.M.; Johnson, C.C.; Rybicki, B.A.; Peterson, E.L.; Richardson, R.J. Neurology
1998, 50, 1346.
[34] Hageman, G.; van der Hoek, J.; van Hout, M.; van der Laan, G., Steur, E.J.; de Bruin, W.; Herholz, K. J Neurol. 1999, 246, 198.
[35] Liou, H.H.; Tsai, M.C.; Chen, C.J.; Jeng, J.S.; Chang, Y.C.; Chen, S.Y.; Chen, R.C. Neurology 1997, 48, 1583.
[36] Semchuk, K.M.; Love, E.J.; Lee, R.G. Neurology 1993, 43, 1173.