Edge Detection of an Image Using an
Improved Canny Algorithm
Lalrinawma1, Ramanjeet2
M.Tech Student, Department of ECE, MIET, Mohri, Haryana, India.1
Assistant Professor, Department of ECE, MIET, Mohri, Haryana, India.2
ABSTRACT: Considering all the defects and short coming of traditional Canny[1] edge detector, this paper put forward the means to improve the process and to achieve better edge detection. First, this paper replaced the Gaussian filter using new Noise adaptive fuzzy switching median filter to remove salt and pepper noise. Secondly, for accurate and noise resilient gradient calculation, the gradient value is calculated using its eight neighbour in opposition to the three neighbour calculation in traditional canny. lastly, the complication and drawback of empirical assignment of threshold value in traditional canny is rectified by calculating the threshold value using 2-D Otsu’s method which then assign and use for double thresholding. The experimental results show great improvement regarding its noise immunity and smoothness along with proper edge detection and good visual effects.
KEYWORDS: Edge detection, Threshold, Gradient, Otsu’s method, fuzzy logic.
I. INTRODUCTION
To understand edge detection of an image, we need to understand what is an edges[2] of an image? There are numbers of definition of edges which are based on image gradients, not on semantics. The definition itself can be differ based on task and can be said application dependent. A few definitions of edges are as follows
- "the gradient in one direction is high, while the gradient in the direction orthogonal to it is low".
- "an edge can be defined as a set of contiguous pixel positions where an abrupt change of intensity (gray or colour) values occur".
- "a pixel as edge if gradient is above a suitable threshold and some others within its selected surrounding area are similar as well".
- "Edges are significant local changes of intensity in an image".
The edges extracted from a two-dimensional image of a three-dimensional scene can be classified as either viewpoint dependent or viewpoint independent. A viewpoint independent edge typically reflects inherent properties of the three-dimensional objects, such as surface markings and surface shape. A viewpoint dependent edge may change as the viewpoint changes, and typically reflects the geometry of the scene, such as objects occluding one another.
Most of the shape information of an image is enclosed in edges. So first we detect these edges in an image and by using these filters and then by enhancing those areas of image which contains edges, sharpness of the image will increase and image will become clearer.Although certain literature has considered the detection of ideal step edges, the edges obtained from natural images are usually not at all ideal step edges. Instead they are normally affected by one or several of the following effects:
Focal blur caused by a finite depth-of-field and finite point spread function. Penumbral blur caused by shadows created by light sources of non-zero radius. Shading at a smooth object.
simple.Indeed, this is one of the reasons why edge detection may be a non-trivial problem unless the objects in the scene are particularly simple and the illumination conditions can be well controlled.
There are many methods for edge detection, but most of them can be grouped into two categories, search-based and zero-crossing search-based. The search-search-based methods detect edges by first computing a measure of edge strength, usually a first-order derivative expression such as the gradient magnitude, and then searching for local directional maxima of the gradient magnitude using a computed estimate of the local orientation of the edge, usually the gradient direction. The zero-crossing based methods search for zero crossings in a second-order derivative expression computed from the image in order to find edges, usually the zero-crossings of the Laplacian or the zero-crossings of a non-linear differential expression. As a pre-processing step to edge detection, a smoothing stage, typically Gaussian smoothing, is almost always applied.
There are different algorithms, logic and method used and develop to detect the edge of an image. These methods are developed in such a way that they perform for specific condition, or under specific noise influence. Most common edge detection algorithms include Sobel, Canny, Prewitt, Roberts, and fuzzy logic methods. In this paper, we will try to study the drawbacks, provide solutions, improved and implement better and noised resilient edge detection algorithm based on canny algorithm [1]. The algorithm developed by john canny to detect an edge of an image is a simple, yet effective algorithm with a huge room for improvement. The traditional canny detector is sensitive to impulse noise as the Gaussian filter is not best suited to filter those impulse noises. So in order to overcome that noise sensitivity, a new technique, better suited to high impulse noised is proposed in this paper.
II. TRADITIONAL CANNY
One of the most popular edge detection algorithm is proposed by John Canny in 1986[1]. He also stated that a good edge detector must have the following three features: good performance, fine positioning performance, and low frequency response for the same edge. Using this features, he proposed an algorithm which can be divided into categories as follows:
1). Smoothing: A Gaussian smoothing filter is used to smooth the image in this step to remove an excessive noise. The Gaussian function is given as:
( , ) = exp(− ) (1)
And the smoothed image is
( , ) = ( , )∗ ( , ) (2)
Where, f(x, y) is the original image, and ‘σ’ is the parameter of Gaussian filter which control the degree of denoising. 2). Gradient value and direction calculation: From the partial derivative calculated from the pixel’s 2x2 neighbour ofsmoothed image, the magnitude and direction of an edge is calculated using hypot function and arctan respectively. The partial derivative of a smoothed image in x and y direction is given as.
= ( ( + 1, )− ( , ) + ( + 1, + 1)− ( , + 1))/2 (3)
= ( ( , + 1)− ( , ) + ( + 1, + 1)− ( + 1, ))/2 (4)
From this, the gradient magnitude and direction is calculated as
= + (5)
= 2( , ) (6)
the two of adjacent interpolation in the direction of ϴ(x,y), thepoint (x, y) will be marked as non-edge point, otherwise marked as edge point.
4). Double Threshold: The edge extracted after step 3 is quite accurate to present the real edge. However, due to noise and colour variation, an unwanted edge is still present. So, in order to filter out the weak edges cause by noises and to protect high gradient value edges, two threshold values (high and low) is set to clarify the two types of edges. If the edge pixel gradient is higher than high threshold value, it is marked as strong edge. If the gradient value is in between high and low threshold value, then mark as weak edges. The gradient value which is lower than the low threshold value is then suppressed. The two threshold values are empirically determined and defined separately for each different image.
5). Hysteresis: after extracting all the edges, it is necessary to suppress the false edge from the true edge. As the true edge are usually connected to other edges with strong gradient value, using this logic an edge is tracked. For this, Blob analysis is applied by looking at a weak edge pixel and its 8-neighbouring pixels. If there is one strong edge pixel involved in the collective pixel, that weak edge is identified as the one that should be preserved.
Canny operator might be better than sobel or prewittoperator[3], it still has some deficiency and some complications. Firstly, Gaussian filter can smooth out the noise but also smooth the edge of an image which can leads to false edge detection, and highly susceptible to noise. ‘σ’, the Gaussian parameter cause complication in removing noise. Large σ value can perform better in removing noise at the same time causing excessive fuzziness to an edge of an image. But smaller σ value for edge protection can affect the de-noising process which in turn can give false edge due to noise. Secondly, while calculating the gradient value in 2X2 neighbouring pixel, it can be easily effected by noise and again can cause detection of false edge. Lastly, the manual threshold assignment cause great complication in the process. The threshold value needs to be set manually and test several times to get perfect threshold value. To rectify these short comings, various improvements have been made. Literature[4] proposed an algorithm by introducing median filter and adaptive threshold which work well for certain value of noise. Again another proposal is made in literature[5] by using adaptive median filter for removing salt and pepper noise in traditional canny algorithm. Both algorithm works well for certain value of noise but not for high density of noise. A new algorithm is proposed in the following which work well for high density of noise and performance of proposed algorithm is compared with mentioned literature.
III. IMPROVED ALGORITHM
As mention earlier, the traditional canny operator has various drawbacks and complications. To rectify the shortcomings, a new algorithm is proposed in this section. In this new approach, the Gaussian filter is replaced using Noise Adaptive Fuzzy Switching Median Filter. Then, the gradient of the filtered image is calculated using its eight (3X3) neighbouring pixel and then the fake edges are removed using the threshold found using 2-D Otsu’s method. The detail of the process is discussed below:
1). Image filter: The Gaussian filter is replaced with Noise Adaptive Fuzzy Switching Median Filter[6]. The proposed filter is a recursive double-staged filter, where initially it will perform noise intensity detection before identifying the possible location of possible noise location. When a noise pixel is detected, it is subjected to filtering stage. Otherwise, it is retained from filtering stage to avoid damaging an original image.
A. Detection Stage:
Detection stage work based on the assumption that the salt and pepper noise contain or produce two peak intensities. The detection stage begins by searching these two peak intensities. However, this assumption does not always hold true, when an image is corrupted using extremely low salt and pepper noise. In such cases, the noise will be wrongly detected as non-noisy pixel and left remain unfiltered.
To overcome this complication, local maximum ( and ) which represent the two salt and pepper
noise intensity is used. Normally, for an image stored as 8-bit integer, the value of these intensities will be 0 and 255. These two noise intensity is used to identify the possible noise pixel in the image. A binary noise mask ( , ) is created to mask the location of the noisy pixel. The binary mask may be given as
( , ) = 0,1, ( , ) =
ℎ
Where, ( , ) is the pixel at location ( , ) with intensity ,
( , )=0: Noise pixel for filtering stage
B. Filtering stage:
In this, the noise pixel marked with ( , )=0 is replaced by estimated correction terms. The filter used a square odd filtering window with dimension. The dimension of an window might be (2s+1) X (2s+1). The square filtering window is given as
( , ) = { ( + , + )} (7)
Where , ϵ (-s,….,0,…..,s)
Then, the number of ‘noise free pixel’, ( , ) is counted using
( , ) =∑ , ϵ( ,…., ,….., ) ( + , + ) (8)
If the current window does not have minimum number of noise free pixel (i.e.( ( , ) < 1), the filtering window is expanded. If the current window has enough noise free pixels, then the median is calculated from those noise free pixels in that window. The median ( , ) is calculated as
( , ) = { ( + , + } ℎ ( + , + ) = 1. (9)
The maximum window for filtering window is set at 7X7 window to avoid selection of inappropriate correction terms and halt the search for noise free pixel and stop the continuous expanding window. If such is the case, the first four pixels in the 3X3 window are used to compute the median pixel ( , ) and is given as
( , ) = { ( −1, −1), ( , −1), ( + 1, −1), ( −1, )} (10)
Then, the local information is defined as maximum absolute luminance difference in 3X3 filtering window
( , ) = max{ ( + , + )} (11)
The extracted local information ( , ) is then used as a fuzzy variable defined by fuzzy membership function ( , ) such that
( , ) =
0, ∶ ( , ) <
( , )
∶ ≤ ( , ) <
1, ∶ ( , )≥
(12)
Finally, the correct value to restore a detected “noise pixel” is linear combination between processing pixel ( , ) and median pixel ( , ). The restored image ( , ) is given as
= ( , ) (14)
Where the fuzzy value ( , )weight on which value between ( , ) or ( , ) is to be used.
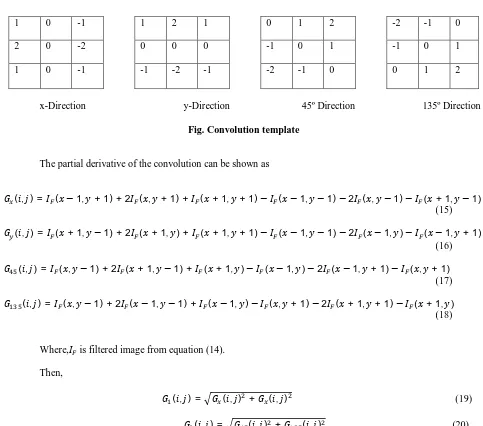
2). Gradient calculation: In a traditional canny detector, the magnitude and direction of gradient is calculated in the 2X2 neighbourhood and noise can highly effect the calculation. In order to overcome this, Gradient magnitude and gradient direction will be calculated in the 8-neighbour (3X3 window)[7]of the current pixel. The gradient information is obtained by integrating the filtered imaged with the following operator.
1 0 -1 1 2 1 0 1 2 -2 -1 0
2 0 -2 0 0 0 -1 0 1 -1 0 1
1 0 -1 -1 -2 -1 -2 -1 0 0 1 2
x-Direction y-Direction 45º Direction 135º Direction
Fig. Convolution template
The partial derivative of the convolution can be shown as
( , ) = ( −1, + 1) + 2 ( , + 1) + ( + 1, + 1)− ( −1, −1)−2 ( , −1)− ( + 1, −1)
(15)
( , ) = ( + 1, −1) + 2 ( + 1, ) + ( + 1, + 1)− ( −1, −1)−2 ( −1, )− ( −1, + 1) (16)
( , ) = ( , −1) + 2 ( + 1, −1) + ( + 1, )− ( −1, )−2 ( −1, + 1)− ( , + 1) (17)
( , ) = ( , −1) + 2 ( −1, −1) + ( −1, )− ( , + 1)−2 ( + 1, + 1)− ( + 1, ) (18)
Where, is filtered image from equation (14).
Then,
( , ) = ( , ) + ( , ) (19)
( , ) = ( , ) + ( , ) (20)
The final gradient magnitude is then calculated as the maximum value between ( , ) and ( , ) as follows.
The gradient direction is then calculated as
( , ) = 2( ( , ), ( , )) (22)
The direction calculated from above equation will contain both positive and negative value, the negative value will be converted into positive value by adding 360º and reorganised to the general direction of 0º, 45º, 90º or 135º degree as follows:
( , ) = 360 + ( , ) (23)
Then, if the ( , ) value is between 0º and 22.5º, between 157.5º and 202.5º or between 337.5º and 360º, it is readjusted as 0º. If it is between 22.5º and 67.5º or between 202.5º and 247.5º, it is readjusted as 45º. The value between 67.5º and 112.5º or 247.5º and 292.5º are adjusted to 90º and value between 112.5º and 157.5º or between 292.5º and 337.5º to 135º.
3). Hysteresis thresholding: To overcome the complication of empirical determination of threshold value, a 2D otsumethod[8][9] is introduced. In this method, the gray level and average gray level is divided in to L values forming LXL 2-dimensional bin composed of gray level and average neighbourhood level
The joint probability mass function in 2-D histogram is given as
= , ∑ ∑ = 1, (24)
Where is the total number of occurrence (frequency) is the total no of pixel in an image
The probability of two classes is denoted as
=∑ ∑ (25)
=∑ ∑ (26)
The average gray value of two classes is then calculated using
µ = [µ ,µ ] = ∑ ∑ ,∑ ∑ (27)
µ = [µ ,µ ] = ∑ ∑ ,∑ ∑ (28)
Whereas the total mean vector is express as
µ = [µ ,µ ] = ∑ ∑ ,∑ ∑ (29)
=∑ [ µ −µ µ −µ ] (30)
( ) = µ −µ + µ −µ + µ −µ + µ −µ (31)
The value of an optimal threshold is found by maximizing the ( ).
IV.RESULTS AND DISCUSSION
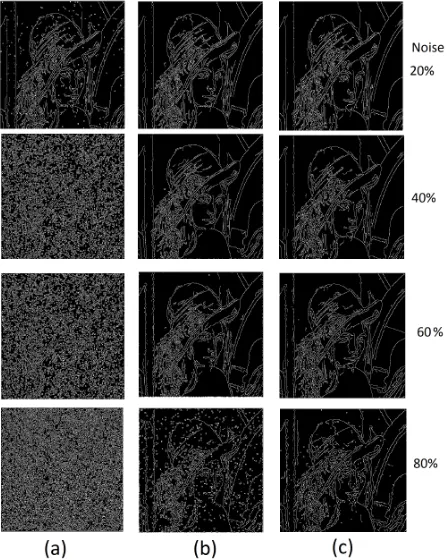
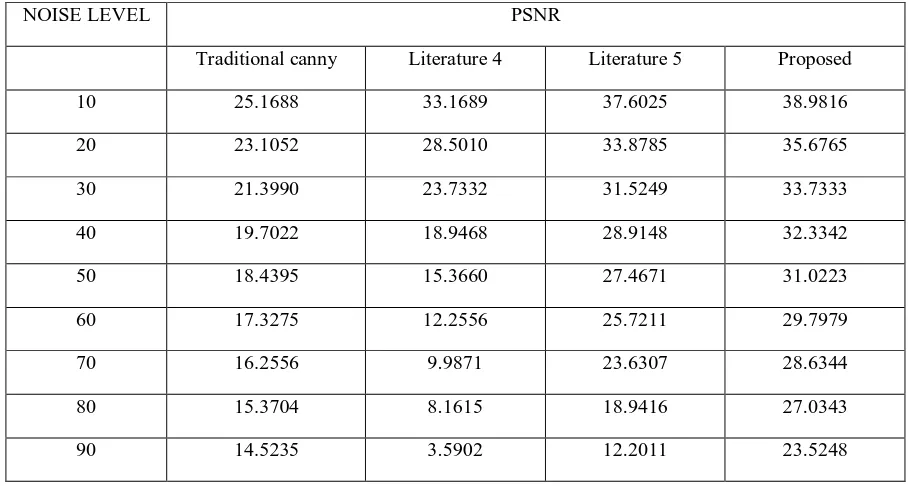
In order to check the efficiency of this algorithm, the performance of the algorithm is compared with the traditional canny detector and the improved algorithm proposed in literature [4] and [5]. The performance is compared for different density value of “salt and pepper” noise and compared both in the image filtered stage and the final edge detected. To check the removal of noise from the noisy image, the PSNR of the filtered image of different algorithm above is compared in the following tables and figures. The image used for the process is lena.jpg(512X512).
Table 1.The PSNR value of the original image and Filtered image is
NOISE LEVEL PSNR
Traditional canny Literature 4 Literature 5 Proposed
10 25.1688 33.1689 37.6025 38.9816
20 23.1052 28.5010 33.8785 35.6765
30 21.3990 23.7332 31.5249 33.7333
40 19.7022 18.9468 28.9148 32.3342
50 18.4395 15.3660 27.4671 31.0223
60 17.3275 12.2556 25.7211 29.7979
70 16.2556 9.9871 23.6307 28.6344
80 15.3704 8.1615 18.9416 27.0343
90 14.5235 3.5902 12.2011 23.5248
Fig. 1. Original gray Scale image, noisy Image, Gaussian filter image, filtered image of literature[4], filtered image of literature [5], proposed algorithm filtered image
V. CONCLUSION
From the above results, we can conclude that the proposed algorithm works better than the previous method in terms of removing high density of salt and pepper noise and detection of true edge with single response. The proposed algorithm then can be converted or applied to different field of image processing for object identification in robot vision system, medical image processing, satellite image etc. even though the proposed image works well, it will always be able to improve as an image processing is an ever growing field. Better definition of edge, better removal of noise with edge protection, can always improve the whole algorithm to a great new level.
REFERENCES
[1]. Canny J. “A computational approach to edge detection”. Pattern analysis and machine intelligence. IEEE transaction on, PAMI-8(6): 679-698, Nov. 1986.
[2]. R.C. Gonzalez and R.E. woods, Digital Image Processing, Pearson Education 2009.Page 712.
[3]. Srinivas B.L, Hemalatha, Jeeran K.A. “Edge detection technique for Image segmentation”. International Journal of Innovative Research in Computer andCommunication Engineering. Vol-3, Special Issue 7, Oct 2015
[4]. Yidongbao, Dongmei Wu- “ An Improved canny algorithm based on median filtering and adaptive threshold in robot training system”. International Conference on Manufacturing Science and Engineering (ICMSE-2015).
[5]. PraneetCh, SrinivasRao V, Srinivas K. – “Image edge detection using adaptive filter”. International Journal of Computer Science and Information Technology.Vol-2(4), 2011.
[6]. Kenny KalVinToh. “Noise Adaptive Fuzzy Switching Median Filter for Salt-And-Pepper Noise Reduction”, IEEE Signal Processing Letters, Vol-17, Issue-3, March, 2010, page- 281-284
[7]. Yu Chen, Caixia Deng, Xiaxiachen – “ An Improved canny edge detection algorithm” International Journal of Hybrid Information Technology (IJHIT). Vol-8, No. 10, (2015). PP: 359-370.
[8]. N. Otsu, “A Threshold Selection Method from Gray-level Histogram”, IEEE Transactions on system Man Cybernetics(S1083-4419), vol-9, no. 1, (1979), pp. 62-66.
![Fig. 1. Original gray Scale image, noisy Image, Gaussian filter image, filtered image of literature[4], filtered image of literature [5], proposed algorithm filtered image](https://thumb-us.123doks.com/thumbv2/123dok_us/1437175.1176112/8.595.140.476.188.514/original-gaussian-literature-filtered-literature-proposed-algorithm-filtered.webp)