Breast Cancer Data Classification Using SVM
and Naïve Bayes Techniques
Kathija1, Shajun Nisha2
M.Phil. (PG Scholar), Dept of Computer Science, Sadakathullah Appa College, India1
Prof& Head, P.G Dept of Computer Science, Sadakathullah Appa College, India 2
ABSTRACT: Breast cancer is one of the major problems for women that have increased over years. A well known statement in cancer society is “Early detection means better chances of survival”. So early detection is necessary as to prevent breast cancer with success and reduce morality. One of the most active areas of research in supervised machine learning is to study methods for constructing good ensembles of learners. The objective of this paper is to find smallest subset of features from Wisconsin Diagnosis Breast Cancer (WDBC) dataset by applying confusion matrix accuracy and 10-fold cross validation method that can ensure highly accurate ensemble classification of breast cancer as either benign or malignant. For classification, the breast cancer data were first classified by Support Vector Machine (SVM) and Naïve Bayes classifiers, and then finalize the classification process.
KEYWORDS: Support Vector Machine, Naïve Bayes, Wisconsin Diagnosis Breast Cancer.
I.INTRODUCTION
In today’s 21st century, world runs on fast food, the possibilities of dreadful diseases have increased exponentially. Thus, the early detection of these diseases can be difference between life and death.
Breast cancer is the main leading cause of death for women. It’s estimated that up to 30% of all breast cancer tumors, even those caught early, will metastasize to other organs in the body, such as lungs, brains, bones or livers. For the detection of breast cancer, various techniques are used in mammography is the most promising technique and used by radiologist frequently. Mammogram images are usually of low contrast and noisy. In breast mammography, bright regions represent cancer. There are several features in mammography that help physicians to detect abnormalities in early stage, and these features can be directly extracted by image processing methods.
For the diagnosis and treatment of cancer, precise prediction of tumors is critically important. Among the existing techniques, supervised machine learning methods are the most popular in cancer diagnosis. In this paper WDBC dataset is used for breast cancer classification; this data set which is available publicly on the web [16].The data set involves recordings from a Fine Needle Aspirate (FNA) test. By using these dataset a comparison of two different classifiers that can be used in machine learning, namely the Naïve Bayes algorithm and SVM classification of ensemble classifier. Ensemble classification refers to a collection of methods that learn a target function by training a number of individual learners and combining their predictions. Naïve Bayes Methods – Probabilistic methods of classification based on Bayes Theorem. Support Vector Machines – Use of hyper-planes to separate different instances into their respective classes.
In order to measure the performance, 10-fold cross validation technique is used on datasets. That is, the data are partitioned by the ratio 90:10% for training and testing. This is done ten times by a different 10% being tested each time.
II.RELATED WORK
breast mass using a small needle and then it is visually inspected under the microscope. In the paper [2] by Asuncion and Newman has proposed these features are related to the shape of the cell nuclei present in the image. A commonly source for these features is the Wisconsin Diagnostic Breast Cancer (WDBC) data set which is publicly available from the UCI repository. In the paper [6] by Lavanya and Usha Rani have proposed hybrid methods that enhance the classification accuracy of WDBC dataset with 10 fold cross validation.
In the paper [5] by Aruna et al. has proposed the performance criterion of supervised learning classifiers such as Naïve Bayes, SVM-RBF kernel, RBF neural networks, Decision trees (J48) and simple CART are compared, to find the best classifier in breast cancer datasets (WBC and Breast tissue). In the paper [9] by Sadhana and Sankareswari have proposed the comparison of accuracies for the two classifiers (SVM, Decision Tree) for WPBC based on 10-fold cross validation as a test method. The accuracy of SVM is the best classifier and the accuracy obtained by decision tree is better than that produced by SVM. In the paper [11] by Sivakami had proposed breast cancer prediction that was done using DT-SVM Hybrid Model. Other classification algorithms had also been applied like IBL, SMO and Naïve Bayes. So this comparative study revealed that DT-SVM performed well in classifying the breast cancer data compared to all other algorithms.
In the paper [7] by Gouda I. Salama et al, have presented a comparison among the different classifiers decision tree (J48), Naïve Bayes (NB), Multi-Layer Perception (MLP), Sequential Minimal Optimization (SMO) and Instance Based for K-Nearest neighbour (IBK) on three very popular different databases of breast cancer (Wisconsin Breast Cancer (WBC),Wisconsin Prognosis Breast Cancer (WPBC) and Wisconsin Diagnosis Breast Cancer (WDBC)) by using confusion matrix and classification accuracy based on 10-fold cross validation method. The experimental results showed that in the classification using fusion of J48 and MLP with the PCA was superior to the other classifiers using WBC data set. In the paper [4] by Mehmet Fatih Akay had proposed medical decision making system based on SVM combined with feature selection has been applied on the task of diagnosing breast cancer. Considering the results, the SVM-based models have developed very promising results in classifying the breast cancer. In the paper [10] by Leena Vig had presented an analysis using Random Forest classifiers, Artificial Neural Networks, Naïve Bayes and Support Vector Machines. Results show that ANN’s, Random Forests and SVMs are able to yield models with high accuracy, sensitivity and specificity whereas Naïve Bayes performs poorly.
In the paper [12] by Animesh Hazra et.al, have proposed the Naïve Bayes classifier gives the maximum accuracy with only five dominant features and time complexity is least compared to other two classifiers. In the paper [13] by Ebrahim Edriss Ebrahim Ali and Wu Zhi Feng , have proposed the results of both NN and SVM were compared on the basis of accuracy and precision. It was observed that classification implemented by Neural Network technique in this paper is more efficient compare to SVM as seen in the accuracy and precision. Bayesian classification provides practical learning algorithms and prior knowledge on observed data.
III.MOTIVATION AND JUSTIFICATION
Motivated by all these facts, it’s recommended to classify the WDBC dataset by using classification algorithm. Hence it justify that the classification of breast cancer dataset with Support Vector Machine (SVM) and Naïve Bayes algorithm is suitable for this application.
IV.ORGANIZATIONOFTHEPAPER
The remaining paper is organized as follows: - Section V includes proposed algorithm which includes outline of the framework, Section VI includes performance Evaluation, Section VII includes Experimental results and Section VIII includes conclusion of the paper.
V.PROPOSED ALGORITHM
A. OUTLINE OF THE PROPOSED WORK
The processing steps applied to WDBC data are given in Figure I.
Fig. I Processing Steps B. SUPPORT VECTOR MACHINES
Support Vector Machine (SVM) is a supervised machine learning algorithm which can be used for both classification and regression challenges. However, it is mostly used in classification problems. In this algorithm, plot each data item as a point in n-dimensional space (where n is number of features you have) with the value of each feature being the value of a particular coordinate. Support Vectors are simply the co-ordinates of individual observation. Support Vector Machine is a frontier which best segregates the two classes (hyper-plane/ line).
Fig. II Optimal hyper plane separating the two classes and support vectors. WDBC
Dataset
Select Classifier
Naïve Bayes SVM
Performance Evaluation
Optimal Hyperplane X2
Maximum margin
SVM Algorithm
Algorithm: Generate SVM Input: Training Data, Testing Data Output: Decision Value
Method:
Step 1: Load Dataset
Step 2: Classify Features (Attributes) based on class labels Step 3: Estimate Candidate Support Value
While (instances! =null) Do
Step 4: Support Value=Similarity between each instance in the attribute Find Total Error Value
Step 5: If any instance < 0 Estimate
Decision value = Support Value\Total Error Repeat for all points until it will empty End If
C. NAÏVE BAYES CLASSIFIER
Naïve Bayes (NB) classifier is a probabilistic classifier based on the Bayes theorem. Rather than predictions, the Naïve Bayes classifier produces probability estimates. For each class value they estimate the probability that a given instance belongs to that class. It assumes that the effect of an attribute value on a given class is independent of the values of the other attributes. This assumption is called class conditional independence
Naïve Bayesian Model assumes that all the variables are mutually independent. Let D be the training set of tuples & their associated class labels. Each tuple is represented by N attributes such that a tuple will contain N values. Suppose there are m class labels from 1,C2,… for any new tuple X, then the classifier will predict that ∈ the class having highest probability condition on X. It shows that X belongs to the ith class then i is having highest probability i.e. If P ( )> ℎ 1≤ ≤ . The class for which ( ) is maximized is called maximum posterior hypothesis. As ( ) is constant for all the classes it is not considered & the formulas becomes,
( )= ∗ ( )
In order to predict the class label of X, calculate ∗ is evaluated for each class Ci and the predictor class label is class ci for which ∗ is maximum.
VI.PERFORMANCEEVALUATION A. MEASURES FOR PERFORMANCE EVALUATION
In this study, the accuracy of two data mining techniques is compared. Although such metrics are used more often in the field of information retrieval, its considered as they are related to other existing metrics such as specificity and sensitivity. These metrics can be derived from the confusion matrix and can be easily converted to true-positive (TP) and false-positive (FP) metrics.
1. Accuracy Measures:
Accuracy measure represents how far the set of tuples are being classified correctly.TP refers to positive tuples and TN refers to negative tuples classified by the basic classifiers. Similarly FP refers to positive tuples and FN refers to negative tuples which is being incorrectly classified by the classifiers. The accuracy measures used here are sensitivity and specificity.
2. Confusion matrix:
The confusion matrix contains four classification performance indices: true positive, false positive, false negative, and true negative as shown in Table1. These four indices are also usually used to evaluate the performance the two-class classification problem.
The four classification performance indices included in the confusion matrix is shown in Table I. Table I. Confusion Matrix
Actual Class Predicted Class Positive Negative
Positive True
Positive(TP) False
Negative(FN)
Negative False
Positive(FP) True
Negative(TN)
3. Cross Validation:
Cross-validation is a standard tool in analytics and is an important feature for helping you develop and fine-tune data mining models. You use cross-validation after you have created a mining structure and related mining models to ascertain the validity of the model. Cross-validation has the following applications:
Validating the robustness of a particular mining model. Evaluating multiple models from a single statement.
Building multiple models and then identifying the best model based on statistics.
4. Sensitivity Analysis:
A sensitivity analysis is a technique used to determine how different values of an independent variable impact
a particular dependent variable under a given set of assumptions. Sensitivity (also called the true positive rate,
the recall, or probability of detection[1] in some fields) measures the proportion of positives that are correctly identified as such (e.g., the percentage of sick people who are correctly identified as having the condition).
Sensitivity = 5. Specificity Analysis:
Specificity (also called the true negative rate) measures the proportion of negatives that are correctly identified as such (e.g., the percentage of healthy people who are correctly identified as not having the condition).
Specificity =
VII.EXPERIMENTALRESULTS A. CLASSIFICATION OF CANCER DATASET
Table II. Descriptions of Database No Attributes No of Attributes 1. Number of instances 699
2 Number of attributes 10 3 Attributes 2 through 10 Instances
4 Classes 1. benign
2. malignant
5 Class distribution 1. Benign:458(65.5%) 2. Malignant: 241 (34.5%)
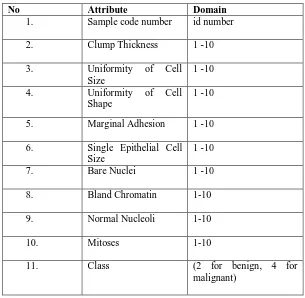
Attribute Information of WBCD Dataset are briefly summarized in Table III. Table III. Attribute Information
No Attribute Domain
1. Sample code number id number
2. Clump Thickness 1 -10
3. Uniformity of Cell
Size
1 -10
4. Uniformity of Cell
Shape
1 -10
5. Marginal Adhesion 1 -10
6. Single Epithelial Cell Size
1 -10
7. Bare Nuclei 1 -10
8. Bland Chromatin 1-10
9. Normal Nucleoli 1-10
10. Mitoses 1-10
11. Class (2 for benign, 4 for
B. PERFORMANCE EVALUATION 1. Accuracy
The accuracy of Naïve Bayes and SVM are shown in Figure III.
Fig. III Accuracy of SVM and Naïve Bayes
2. Specificity and Sensitivity
The Performance Evaluation of Sensitivity and Specificity are shown in Figure IV
Fig. IV Sensitivity and Specificity
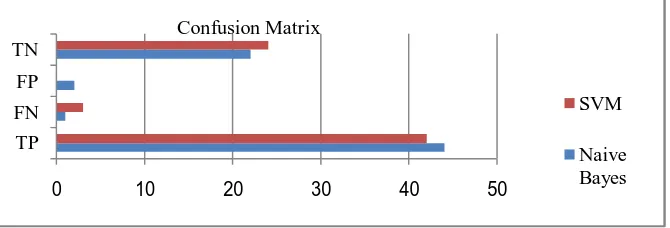
3. Confusion Matrix
The Confusion Matrix of SVM and Naïve Bayes are shown in Figure V
Fig. V Confusion Matrix
94.5 95 95.5 96
Naïve Bayes SVM
Accuracy
Accuracy %
0.85 0.9 0.95 1 1.05
Sensitivity Specificity
Naïve Bayes SVM Sensitivity and Specificity
0 10 20 30 40 50
TP FN FP TN
SVM
5. Naïve Bayes 10 fold cross validation
The 10-Fold Cross Validation of Naïve Bayes is presented in Table IV.
Table IV 10-fold Cross Validation for Naïve Bayes classifier Naïve Bayes 10-Fold Cross Validation
NO K-FOLD TP FN FP TN SENSITIVITY SPECIFICITY
1. K=1 45 0 1 23 1.00 0.96
2. K=2 43 2 0 24 0.96 1.00
3. K=3 45 0 2 22 1.00 0.92
4. K=4 43 2 1 23 0.96 0.96
5. K=5 43 2 2 22 0.96 0.92
6. K=6 44 1 1 23 0.98 0.96
7. K=7 43 2 3 21 0.96 0.88
8. K=8 44 1 2 22 0.98 0.92
9. K=9 43 2 1 23 0.96 0.96
10. K=10 44 1 4 20 0.98 0.83
11. Overall 44 1 2 22 0.97 0.93
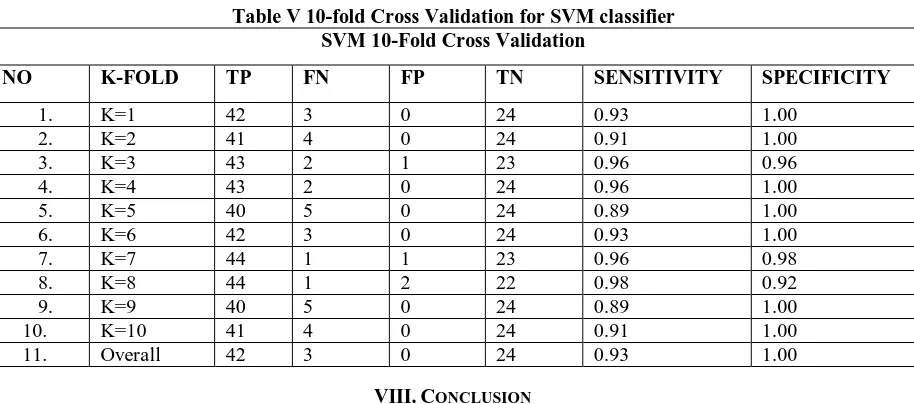
6. SVM 10-fold Cross Validation
The 10-Fold Cross Validation of SVM is presented in Table V.
Table V 10-fold Cross Validation for SVM classifier SVM 10-Fold Cross Validation
NO K-FOLD TP FN FP TN SENSITIVITY SPECIFICITY
1. K=1 42 3 0 24 0.93 1.00
2. K=2 41 4 0 24 0.91 1.00
3. K=3 43 2 1 23 0.96 0.96
4. K=4 43 2 0 24 0.96 1.00
5. K=5 40 5 0 24 0.89 1.00
6. K=6 42 3 0 24 0.93 1.00
7. K=7 44 1 1 23 0.96 0.98
8. K=8 44 1 2 22 0.98 0.92
9. K=9 40 5 0 24 0.89 1.00
10. K=10 41 4 0 24 0.91 1.00
11. Overall 42 3 0 24 0.93 1.00
VIII.CONCLUSION
REFERENCES
1. Han and Kamber, - “Data Mining; Concepts and Techniques”, Morgan Kaufmann Publishers, 2000. 2. Asuncion and Newman,"UCI machine learning repository", 2007.
3. Maglogiannis, Zafiropoulos, and Anagnostopoulos,"An Intelligent System for Automated Breast Cancer Diagnosis and Prognosis Using SVM Based Classifiers", Applied intelligence, vol. 30, no.1, pp. 24-36, 2009.
4. Mehmet Fatih Akay, “Support Vector Machines Combined With Feature Selection For Breast Cancer Diagnosis”, Expert Systems with Applications 36, 3240–3247, 2009.
5. Aruna, Rajagopalan and Nandakishore, “Knowledge Based Analysis Of Various Statistical Tools In Detecting Breast Cancer”, D.C. Wyld, et al. (Eds): CCSEA 2011, CS & IT 02, pp. 37–45, 2011.
6. Lavanya and Usha Rani ,“Ensemble Decision Tree Classifier for Breast Cancer Data” International Journal of Information Technology Convergence and Services, vol. 2, no. 1, pp. 17-24,2012.
7. Gouda I. Salama, Abdelhalim and Magdy Abd-elghany Zeid, "Breast Cancer Diagnosis On Three Different Datasets Using Multi-Classifiers”, International Journal of Computer and Information Technology (2277 – 0764) Volume 01– Issue 01, September 2012.
8. Pitchumani Angayarkanni, Nadira Banu Kamal, “Automatic Classification Of Mammogram MRI Using Dendograms”, Asian Journal Of Computer Science And Information Technology 2: 4, 78. 81, 2012.
9. Sadhana and Sankareswari, “A Proportional Learning Of Classifiers Using Breast Cancer Datasets”, International Journal of Computer Science and Mobile Computing, IJCSMC, Vol. 3, Issue. 11, pg.223 – 232, November 2014.
10. LeenaVig , “Comparative Analysis of Different Classifiers for the Wisconsin Breast Cancer Dataset”, Open Access Library Journal,Volume 1 | e660,2014.
11. Sivakami, "Mining Big Data: Breast Cancer Prediction using DT-SVM Hybrid Model." International Journal of Scientific Engineering and Applied Science (IJSEAS) -Volume-1, Issue-5, ISSN: 2395-3470,August 2015.
12. Animesh Hazra et.al, “Study and Analysis of Breast Cancer Cell Detection using Naïve Bayes, SVM and Ensemble Algorithms”, International Journal of Computer Applications (0975 – 8887) Volume 145 – No.2, July 2016..
13. Ebrahim Edriss Ebrahim Ali and Wu Zhi Feng, “, Breast Cancer Classification using Support Vector Machine and Neural Network”, International Journal of Science and Research (IJSR) ISSN (Online): 2319-7064, Volume 5 Issue 3, March 2016.
14. V. N. Vapnik, “The Nature of Statistical Learning Theory”, Springer, New York, NY, USA, 1995.
15. V.N. Vapnik and A. Chervonenkis, “A note on one class of perceptrons”, Automation and Remote Control, 25, 1964.
16. Wisconsin Diagnostic Breast Cancer (WDBC) Dataset and Wisconsin Prognostic Breast Cancer (WPBC) Dataset.http://ftp.ics.uci.edu/pub/machine-learning-databases/breast-cancer-wisconsin/
BIOGRAPHY
Kathija.A is currently pursuing M.Phil degree in computer science in Sadakathullah Appa College, Tirunelveli. She has done her M.Sc degree in Computer Science from V.O.Chidambaram College,Thoothukudi and the B.Sc in Computer Science from St.Mary’s College(Autonomous),Thoothukudi.under Manonmaniam Sundaranar University,Tirunelveli.


