University of Windsor University of Windsor
Scholarship at UWindsor
Scholarship at UWindsor
Electronic Theses and Dissertations Theses, Dissertations, and Major Papers
1-1-1966
Learning as a function of intelligence, training condition and sex,
Learning as a function of intelligence, training condition and sex,
in a non-verbal paired-associates procedure.
in a non-verbal paired-associates procedure.
Morton E. Mates
University of Windsor
Follow this and additional works at: https://scholar.uwindsor.ca/etd
Recommended Citation Recommended Citation
Mates, Morton E., "Learning as a function of intelligence, training condition and sex, in a non-verbal paired-associates procedure." (1966). Electronic Theses and Dissertations. 6440.
https://scholar.uwindsor.ca/etd/6440
I i m i l G E N C E , TRAINING CONDITION
AND SEX, IN A NON-VEBBAD
PAIEED-ASSOCIATES PROCIDUHE
by
Morton E. Mates
B.A., University of Windsor, 1961
A Thesis
Submitted to the Faculty of Graduate Studies through the Department of Psychology in Partial Fulfillment
of the Requirements for the Degree of Master of Arts at University of
Windsor
UMI Number: EC52621
INFORMATION TO USERS
The quality of this reproduction is dependent upon the quality of the copy
submitted. Broken or indistinct print, colored or poor quality illustrations and
photographs, print bleed-through, substandard margins, and improper
alignment can adversely affect reproduction.
In the unlikely event that the author did not send a complete manuscript
and there are missing pages, these will be noted. Also, if unauthorized
copyright material had to be removed, a note will indicate the deletion.
UMI
UMI Microform EC52621
Copyright 2008 by ProQuest LLC.
All rights reserved. This microform edition is protected against
unauthorized copying under Title 17, United States Code.
ProQuest LLC 789 E. Eisenhower Parkway
ABSTRACT
This study investigated the relationship between
intelligence, training condition and sex on the level of
learning and on response latency.
The experimental group consisted of 56 male and 36
female 12 year old school children ranging in measured IQ
from 40 to 140. The subjects were divided into six IQ groups,
each consisting of 6 boys and 6 girls. Two boys and two girls
from each group were randomly assigned to one of three training
conditions.
The conditions consisted of different temporal
sequences of the training trial events, namely stimulus item,
response item and response and a standard temporal order in the
test trial, namely stimulus and response. The experimental
task for all groups was the learning of one stimulus - response
pair, namely the association of a white light and the response
on the appropriate plunger. T^e level of learning was measu
red over test trials.
Analysis of variance showed significant overall
changes in response latency and number of correct responses
for all subjects. There were significant differences in both
response measures as a fxmction of IQ but not of training
condition or sex. The differences in “reminiscence” or
performance after a rest period following 100 massed trials
were statistically significant for the extreme IQ groups.
PREFACE
This study was prompted by the author’s interest
in educational research and mental retardation. Specifi
cally what is the effect of different temporal sequences
of the training trial events on the learning of subjects
differing in intelligence levels, and what is the effect
of massed practice on the performance of these same sub
jects?
I would like to express my gratitude to Dr. B.P.
Rourke, my director, for his continual guidance, to Dr.
V.B. Cervin and Mr. A. Blackbourn, my readers, for their
many helpful suggestions, and to Mr. W. Grewe, who built
and programmed the apparatus.
I wish also to thank the members of the Windsor
Board of Education for their kind permission to include
public school children in this study, Mr. G. Gall, who
supplied the information on the sample, the principals
of the Windsor public schools and my young subjects.
Finally, I would like to thank Miss Margaret
Field, my friend and faithful typist, and my wife
Catherine, who served as assistant experimenter
and assistant everything else, throughout the whole
study.
PREFACE
LIST OF TABLES
LIST OF FIGURES
Chapter
I
II
III
IV
INTRODUCTION
Review of the Literature
Purpose of the Present Research
APPARATUS AND PROCEDURE .
Subjects
Apparatus • . •
Procedure . • .
RESULTS .
Latency of Response • •
Number of Gorreot Responses .
Reminiscence Scores . .
DISCUSSION
Latency of Response ,
Number of Correct Responses •
Reminiscence Scores •
iv
vii
ix
1
5
15
16
16
17
18
26
26
32
43
50
50
51
Page
SUMMARY . . . . . 57
APPENDIX A Correct Responses , * . . 5 9
APPENDIX B Mean Response Latencies . . . 6 3
REFERENCES . . . . . . . 6 7
1 IQ Group eiassifications. Intermala, Mean : IQand Standard Deviations for each Experi
mental Group . . . . 16
2 Mean Eeeponse Latencies in Seconds for all
IQ Groups over Test Blocks# IQ and Test
Block Totals • . . . 28
3 Analysis of Variance of Response Latency
Totals, by IQ, by Sex, over Test Blocks 29
4 Newman-Keuls Test of the Significance of Differences between the Latency Totals
of the IQ Groups . . . . 30
5 Hewman-Eeuls Test of the Significance of Differences between the Latency Totals
of the Test Blocks . . . 31
6 Number of Correct Responses for Males and Females in each IQ Group, for each
Training Condition,over Test Blocks . 34
Analysis of Variance of the Ifeimber of Correct Responses by IQ, by Condition,
by Sex, over Test Blocks . 36
8 Trend Analysis of the Number of Correct
Responses over Test Blocks . . 37
9 Ne’waan-Keuls Test of % e Significance of Differences between the Test Block
Totals • • . • . 38
10 Analysis of Variance of the Simple
Effects for Each IQ Group . . 42
Table Page
11 Réminiscence Scores for Males and Females
in each IQ Group and for Each Condition 46
12 Analysis of Variance of %miniscence Scores,
by m Q , m y sex . . . . . 47
13 Newman-Keuls Test of the Significance of Difference between the Reminiscence Scores
of eacb IQ Group .. . 48
14 Trend Analysis of the Reminiscence Scores
of each IQ Group . . . . 49
Figure Page
1 Individual Subject Panel of the
Grason-Stadler Learning Apparatus . 17
B
Temporal Relations of all Eventsin the Training and Test Tfials
of Conditions 1, 2 and 3. . 23
3 The Response Latency Curves for
the Six IQ Groups over Test Blocks , 27
4 IQ Group Latency Totals (sum of five
test block totals for each IQ group) 33
I Response Latency Totals for all IQ groups ever Test Blocks (sum of six
IQ group totals in each test block) 33
6 Number of correct responses for each
IQ Group over Test Blocks (all
eondlt-ions) . . . . 40
7 The Nukber of Correct Responses for
all IQ Groups over Test Blocks . 41
8 Réminiscence Scores for each IQ Group (correct responses in post-rest block of 10 trials minus correct responses
in pre-rest block of 10 trials) , 45
CHAPTER I
INTRODUCTION
The present study was designed to evaluate
the following ; (1) the relationship between intelligence
and learning to perform a simple motor task; (2) the
effect of three different orders of presentation of
stimulus and response eirents during training; and,
(3) the effect of sex differences on this performance.
The subjects were 12 year old girls and boys whose
IQ scores were between 40 and 140.
The three events in the training trial, the
order of which was permuted in the three experimental
conditions, were the following : the presentation of
a stimulus light (a white light) ; the presentation of
an informational stimulus light (an orange light) indicat
ing the correct response ; and the pull of a plunger by
the subject.
Thus there were three independent variables
in this study : (1) the intelligence level of the subjects,
determined by measured IQ, was varied from 40 to 140 ;
(2) the three different training conditions, each
characterized by a different order of training trial
events ; (3) sex. The subjects were equally divided into
girls and boys.
sentation of the orange light beside a plunger; and, (3)
the subject’s response of pulling once on the plunger
indicated by the orange light.
In Condition 2, the training trial order of
events was : (1) presentation of the orange light beside
a plunger; (2) the subject’s response on that plunger;
and, (3) presentation of the white light.
In Condition 3» the training trial sequence
was: (1) the subject’s response on a plunger; (2) the
presentation of the orange light beside a plunger; and,
(3) the presentation of the white light subsequent to
the response. The test trial sequence, which remained
constant for all conditions, was as follows: the white
light followed by the subject’s response (the orange
light being omitted).
The dependent variable in this study was the
learning under the three different training conditions.
Learning was measured by the number of correct responses
on the appropriate plunger. Latency of response (that is,
time taken to pull one or the other of the plungers),
independently of correct response, was also employed.
Latency of response was measured from the onset of a
stimulus to the onset of the response.
described in various ways: as analogous to paired-
associates learning, to the classical conditioning, or
the perceptual-motor paradigms. Each of these paradigms
gives a standard order of events in the training trial,
viz., a stimulus, a cue, and a response. This order of
events was used in the training trials of Condition 1.
Since it is possible to permute this order of events,
the question can be asked — will learning occur in
other orders of events? For example, when the subject
is required to respond immediately after the présentât ion
of the orange l i ^ t and only thereafter presented
with the white lig^t, will he find it more difficult
to learn the correct stimulus-response association, and
to respond correctly in the test trial? The effect Of
permutations in the training trial order on subsequent
performance was the subject of a previous study (Cervin,
1965).
In Condition 1, the training trial events were
presented in the standard order, i.e. white light-
orange light-response. In Condition 2, one permutation
of the standard order was made. The training trial
sequence was orange light-response-white light. In
Condition 3» two permutations of the standard order were
made. The training trial sequence was response-orange
light-white light. The test trial sequence of events
light-response. Thus the subjects trained under the Conditions
2 and 3 sequences were required to symbolically restore
the training trial sequence to the standard one in order
to give the correct response during test trials. Since
each permutation of the training trial events can be
interpreted as requiring an additional symbolic operation
of the subject, it was expected that learning should
be successively slower in Condition 2 than in Condition
1, and in Condition 3, relative to Condition 2.
The experimental task, common to the three
conditions, was the learning of one stimulus-response
association, viz.pth# c o n n w t i b m between one white
stimulus light on a panel and the response of pulling
a plunger. This study could be considered a non-verbal
paired associates learning task, with similarities
to the classical conditioning and perceptual^motor
paradigms. Since no single paradigm adequately includes
all aspects of the present study, the latter is described
in terms of the experimental events which actually
took place.
In summary, this study investigated the relation
ship between intelligence level, training condition,
and sex on the learning of a single stimulus-response
association. The results of studies relevant to these
experimental variables will be considered in the follow
Review of the Literature
During the last 15 years there has been a mark
ed increase in research on individual difference variables
in learning. In the main, this research has focused upon
comparing the performance of retarded and normal sub
jects on different learning tasks, with the aim of
identifying the learning deficits which characterize
the retarded. One of the commonly used methods of identify
ing these deficits is comparing the performance of
retardates and normals of equal chronological age.
The present study employed this method with "moderately”
and "mildly" retarded, and normal 12 year olds of both
sexes. Retardation is operationally defined by an IQ
score below 80, derived from a standard!zed,individually
administered IQ test. The terms "moderately" and "mildly"
retarded refer to the IQ ranges between 25 and 49 and
between 50 and 79» respectively*
The task presented to the subjects in this
study may be described specifically as a non-verbal paired-
associates task. The experimental conditions were
analogous to certain classical conditioning procedures.
The responses of the subjects were a kind of perceptual-
motor behaviour. The conditions under which this behaviour
was practiced were in two blocks of massed trials. In
order to give an adequate overview of the research which
studies of classical conditioning; (3) a review of
perceptual-^otor studies; (4) a review of research on the
effect of massed vs. distributed practice; (5) conclusions
and hypotheses based on the results from these four
areas of experimental investigation.
(l) Paired-Associates Studies
In this type of study, the usual procedure
is to employ a list of pairs o f ,syllables, words,
numbers, pictured objects or borne combination of the
above as stimulus and response members. During the train
ing trial the subject is presented with both members.
During the test trial, the stimulus member of the pair
is presented alone. Learning is measured by the number
of correct responses given during the test trials.
Lott (1958) administered a list of seven pairs
of common pictured objects to 69 subjects from a public
junior high school. Three IQ groups, 46-77, 91-108, and
120-134 were matched for age and sex. Comparing the
learning of the high and low IQ groups, Lott found that
the high IQ group took gignificantly fewer trials to learn.
to a criterion of four successive correct anticipations
of the response items. Though the normals learned faster
than the retardates, the absence of a significant
retarded subjects are not at a great disadvantage relative
to normals when the material to be associated is highly
familiar pictures,
Akutagwa and Benoit (1959) also matched their
subjects for age and employed common pictured nouns as
stimulus and response members, A lower IQ group# 70-89,
was matched with a normal group, 90-110, at two age ranges,
8-10, and 11-13» Three eight-pair lists were administered
to all subjects in the following order; a high associ
ation value list (e.g. "horse-cow”), a low association
value list (e.g. "wagon-owl"), and a high interference
list using the same stimulus members as List 1 with new
response members (e.g. "horse-baby"). The older subjects
showed superior learning than the younger subjects but
there were no significant differences in learning as a
function of IQ. This was probably due to minimum IQ dif
ferences between the groups.
In another study, Berkson and Cantor (1950)
compared groups of equal chronological age and mean
IQ scores of 70 and 99. Three six-item lists, consisting
of various combinations of numbers, colours, and pictures
of common objects were employed as stimulus and response
items. The high IQ group performed increasingly better
than the other group over the three lists. Significant
differences were found on list II where the retardates
criterion.
In a study employing the same training condit
ions as the present one, Cervin (1965) found significant
differences in the number of training trials required to
reach criterion in each condition. This result indicates
that each permutation of the training trial events signi
ficantly increased task difficulty.
The results of these studies on paired-assoc
iates learning indicate that intelligence level signi
ficantly affects learning. In the current study, there
fore, it was expected that IQ and learning would be
positively related (Hypothesis 1). Since permuting
the training trial order of events was found to signifi
cantly increase task difficulty, it was predicted that
the learning of subjects in the present investigation
would be significantly affected by the addition of one
or more permutations to the training trial sequence
of events (Hypothesis ll).
(2) Classical Conditioning Studies
The three events in the standard classical
conditioning training trial are as follows ; (1) the "to
be conditioned" or neutral stimulus; (2) the "uncondition
ed" stimulus; and, (3) the "conditioned" response.
Training consists of repeatedly pairing the two stimuli
comes to elicit the conditioned response.
Two studies comparing the conditioning of
a finger-withdrawal response in normals and retardates,
report conflicting results. Osipova (1926) as reported
by Razran (1933) employed 58 retarded males, 67 normal
boys, and 75 normal girls. He found that retarded males
formed stable conditioned responses faster than normals
of equal chronological age. Shock was used as the un
conditioned stimulus. In another study, Marinesco and
Kreindler (1 9 3 3) used four subjects in the severely
to moderately retarded range. With strong shock as an
unconditioned stimulus and hand withdrawal as the condit
ioned response, they found conditioning difficult to
obtain, and the conditioned responses unstable. Al
though conclusive evidence is lacking, these studies
suggest that this type of response (which is similar to
the motor response in the present study) can be condition
ed to some extent in retardates.
(3) Perceptual-Motor Studies and Motor Skills
Though the tasks used in perceptual-motor studies
differ widely from the task used in this study, some of
the results have relevant implications. In a comparison
of equal chronological age retardates and normals on a
shielded maze test, Ellis, Pryer, Distefano, and Pryer
(i960) found a significant increase in the number of
(60-70) over normals (80-99). Denny (1965), commenting
on this result, pointed out that this task required the
use of additional verbal mediators not required in an
open maze test. He suggested that the very significant
difference between the IQ groups was due to the retardates'
inefficiency in the use of verbal mediating responses.
In a rotary pursuit study, Ellis, Pryer,
and Barnett (i960) employed 80 mildly retarded and 80
normal subjects under a 20 second work, 20 second rest
schedule for 20 trials, 5 minute rest, and an additional
20 trials with the same work and rest intervals. The
normal subjects performed significantly better over the
20 prerest and 20 postrest trials. They also showed
greater improvement after the rest period or greater
"remini sc enc e".
One of the major components of motor ability
is speed of response. Since latency of response was
considered in the present study, experiments comparing
the reaction time of normals and retardates are relevant.
These studies report in general that the
lower the IQ, the poorer the performance of the retardate,
as compared with the normal subject. Berkson (I960)
found that, when the stimulus is held constant and the
complexity of the required response is varied, a result
ing significant interaction between IQ and motor tasks
11
The results of the perceptual-motor ability
studies cited in this review indicate that retardates per
form significantly worse than normals when verbal media
tion is required; that the retardate's reminiscence is
more adversely affected by massed practice; and that his
latency of response is negatively related to task diffi
culty. It could be assumed, in the present study, that
one permutation of the standard order of events in the
training trials would require of the subject an additional
symbolic response, over and above what is required by the
standard sequence. The retardates would thus be expected
to learn significantly slower in Conditions 2 and 5, than
the normals. Therefore, it was predicted by Hypothesis
III that there would be a significant interaction between
IQ and condition.
(4) Massed vs. Distributed Practice
An important variable in a learning experiment
is the condition within which the learning is acquired.
This is commonly referred to as the "conditions of prac
tice" . The condition of practice that has been explored
more extensively than any other is that of the distri
bution of practice through time. Practice is considered
to be 'massed' if it is relatively continuous. 'Distri
buted' practice refers to practice interspersed with rest
For most of the experimental tasks that have
been studied, distributed practice is reported to produce
better learning. The nature of the task, duration of rest
periods, age, intelligence and sex of the subjects are
some of the variables which complicate the determination
of optimum practice conditions.
In a study of the effects of massed vs. distri
buted practice in a non-verbal paired-associates task.
Dent and Johnson (1964) found that both 'organic' and
'familial' mental retardates made fewer errors in learning
under distributed practice. Using a similar task, Madsen
(1 9 6 3) compared the learning of high, average and low IQ
subjects, matched for age and sex, under both practice con
ditions. He found significant differences between the high
and low IQ groups under massed practice, and significant
differences between the two practice conditions for the low
IQ but not for the average or h i ^ IQ subjects. On the
basis of the differential effects of massed practice on
retardates vs. normals, and the greater reminiscence scores
of normals relative to retarded subjects, reported by
Ellis, Pryer and Barnett's study (1960a), it was expected
that reminiscence scores (i.e. number of correct responses
in the ten post-rest trials minus the number in the ten
pre-rest trials) would be positively related to IQ (Hypo
thesis IV).
13
is one rather popular theoretical explanation of the dif
ferences in performance as a function of the practice ef
fects. Hull assumed that when an organism makes a response,
some inhibition to that response is also generated. Such
inhibition may be thought of as analogous to fatigue in
that it makes the next response more difficult. Like fa
tigue, this reactive inhibition disappears after a period
of rest; if there is not enough rest between responses,
however, the inhibition accumulates from response to res
ponse. This accounts for the advantage of distributed over
massed practice.
Hull made no allowance for individual differ
ences in ability level. The more difficult the given task
for the subject, the greater should be the accumulation of
reactive inhibition during massed practice. Since any ex
perimental task can be assumed to be more difficult for
the retarded than the normal subject, a significant differ
ence in reminiscence scores could be explained theoretic
ally as a greater build up of reactive inhibition during
the first block of massed trials, and a rest period too
brief to allow for the dissipation of such inhibition.
(5) Conclusions and Hypotheses
The following is a brief summary of the results
cited in the foregoing review of the literature, and the
It was reported that high IQ subjects learned significant
ly faster than did low IQ subjects on paired-associates
tasks. Thus Hypothesis I predicted that IQ and level of
learning would be positively related in this study.
The permuting of the standard training trial
order of events was found to increase the task difficulty
level in a non-verbal paired-associates study. Hypothesis
II therefore predicted that the permutation of the stan
dard training trial sequence of events would significantly
increase task difficulty thereby producing a significantly
lower level of learning.
Studies on reaction time report that retardates
take significantly longer to learn a task requiring the
use of symbolic mediating responses. It could be assumed,
in the present study, that one permutation of the standard
training trial sequence requires of the subject an addi
tional symbolic response over and above what is required
by the standard sequence. Hypothesis 111, on the basis of
this assumption, predicted a significant interaction be
tween IQ and training condition.
Retardates generally record significantly longer
response latencies than normals in tests of reaction time.
It was therefore predicted by Hypothesis IV that IQ and
latency of response would be inversely related in the pres
ent study.
15
to be more detrimental to the learning of retardates, rel
ative to normal and high IQ subjects. Normals showed
greater (non-significant) reminiscence in a post rest
block of massed trials. Since this study presented a lon
ger series of massed trials, and varied IQ more widely, it
was predicted by Hypothesis V that reminiscence would be
positively related to IQ.
Purpose of the Present Research
The present investigation is directed as a precise
determination of the relationship between intelligence level,
training trial order of events, and sex to the level of
learning in a given number of trials, and to the latency
of response.
This research is considered in order for two
reasons; (1) no research, with the exception of Cervin
(1965) has reported employing the three conditions used in
this study. (2) most of the studies which Vary intelligence,
do so for two or at the most three levels. It is believed
that by varying IQ over six mean values, more sensitive
measures of the leVel of learning at different IQ levels
Subjects
The subjects were selected in the following man*
ner. The Windsor Board of Education supplied the names
and IQ scores of approximately 170 girls and boys of vary
ing IQ levels. The six IQ groupings used by the Board in
classifying all public school students were selected as
the intervals of the six experimental groups* The six
girls and six boys whose IQ scores most closely approxi
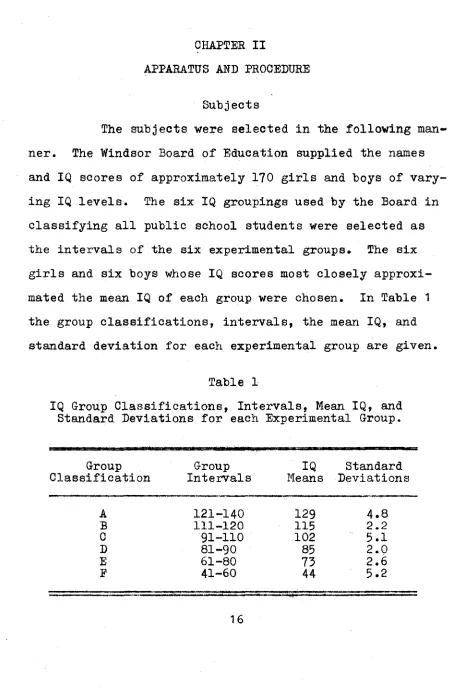
mated the mean IQ of each group were chosen. In Table 1
the group classifications, intervals, the mean IQ, and
standard deviation for each experimental group are given.
Table 1
IQ Group Classifications, Intervals, Mean IQ, and Standard Deviations for each Experimental Group.
Group Classification
Group Intervals
IQ Means
Standard Deviations
A 121-140 129 4.8
B 111-120 115 2.2
0 91-110 102 5,1
D 81-90 85 2.0
E 61-80 73 2.6
P 41-60 44 5.2
17
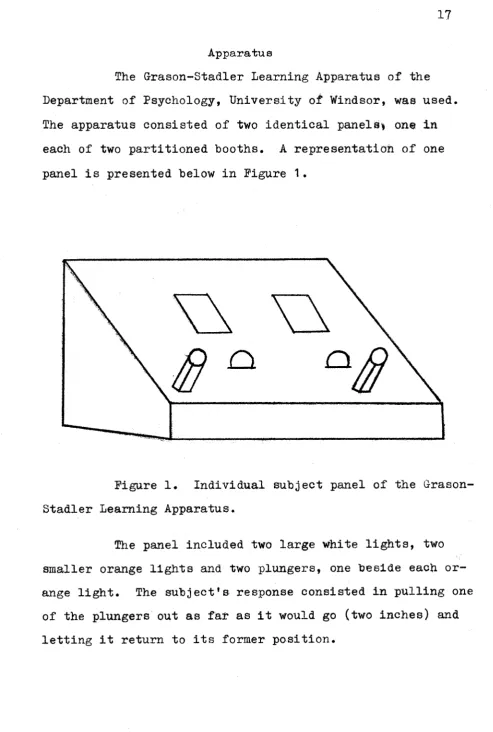
Apparatus
The G-rason-Stadler Learning Apparatus of the
Department of Psychology, University of Windsor, was used.
The apparatus consisted of two identical panels% one in
each of two partitioned booths, A representation of one
panel is presented below in Figure 1.
Figure 1. Individual subject panel of the Grason-
Stadler Learning Apparatus.
The panel included two large white lights, two
smaller orange lights and two plungers, one beside each or
ange light. The subject's response consisted in pulling one
of the plungers out as far as it would go (two inches) and
The following conditions remained constant for
all the experimental conditions. One ring of the warning
hell began every trial. The stimulus member of the pair
was the left hand white light. The response member was
the right hand orange light. A pull on the right hand
plunger constituted a correct response. The warning bell,
onset, duration and offset of the white and orange light,
and the inter-trial interval were pre-programmed and oper
ated from a master console in an adjacent control room.
An interval transistor type Model AW (style 90
MT) Esterline-Angus Event Recorder charted the following:
(1) the onset and offset of each trial; (2) the onset and
offset of the white and orange lights; and (3) the correct
and incorrect responses of each subject. A manually oper
ated modified Esterline-Angus Chart Inspector was used to
measure the number of correct responses, and the latency
of each response to the nearest hundredth of a second.
Procedure
The three experimental conditions each consisted
of a pre-training phase, and 100 test and 100 alternating
training trials.
Condition 1. In Condition 1, (no permutation of the train
ing trial events) the subject was required to learn one
white light-plunger association. Each time the white light
19
If he pulled the right hand plunger, a correct response was
recorded.
The subjects were tested two at a time. After
being seated, and shown the lights and plungers on the
panel, they were instructed in the pre-training phase as
follows:
PRE-TRAINING PHASE INSTRUCTIONS
First you will hear a bell. Then an orange li#it beside one of the plungers will come on. When this happens, pull the plunger beside that orange light.
The experimenter then rang the warning bell and
presented either the right or left orange light. An assis
tant observed both subjects and instructed them to pull the
plunger beside whichever orange light had been presented.
The warning bell, followed by orange lights in random order
were presented until both subjects bad responded correctly
at least six consecutive times. Then they received the fol
lowing instructions.
INSTRUCTIONS FOR TRAINING AND TEST TRIALS
So every time the orange light comes on, I want you to pull the plunger beside it.
you have to learn which plunger to pull when the white light comes on, and the orange light does not come on. Try to pull that plunger every time. If you do well, I will give you some money at the end.
Any questions? (The subjects' ques tions were answered from the instruc tions).
Please don't talk after we start.
The booth doors were closed and the experimental
session began. Beginning with a test trial, the subjects
were given 50 test and 50 alternating training trials.
Then they were given a 5 minute rest, during which the in
structions were reread. The subjects were discouraged from
talking to one another during the recess. Another set of
50 test and training trials followed without pause.
Condition 2 . In this training condition, the subjects were
again required to learn one white light-plunger associa
tion. The training trial order was permuted once (i.e.
orange light - white light - response). The pre-training
phase proceeded in the same manner as Condition 1. Then
the subjects were instructed as follows;
INSTRUCTIONS FOR TRAINING AND TEST TRIADS
Every time the orange light comes on, I want you to pull the plunger beside it. Sometimes, after the orange light comes on, and you pull the plunger beside it, a white light will come on. Sometimes the white light will come on alone. Now one of the white lights goes with one of the plungers. You have "to l e a m which plunger to pull when the white light comes on alone.
21
you which plunger to pull. Now you have to l e a m which plunger to pull when the white light comes on, and the orange light has not come on. Try to pull that plunger every time. If you do well, I will give you some money at the end. Any questions? Please don't talk after we start.
The experimental session followed. The proce
dure was identical to Condition 1, with the exception of
the one permutation of the training trial order of events.
Condition 3 » In Condition 3, the subjects were again re
quired to learn the one white light-plunger association.
The training trial order of events was permuted twice (i.e.
response - orange light - white light). The subjects were
instructed in the pre-training phase as follows:
INSTRUCTIONS FOR PRE-TRAINING PHASE
First you will hear a bell. When the bell rings, pull one of the plungers. After you pull the plunger, one of the orange lights will come on. The orange light will tell you which plunger you should have pulled. If you pulled the plunger beside it, you were right. If you pulled the other plunger, you were wrong.
The experimenter then presented the bell, and
after the subjects' responses, the right or left hand or
ange light. Again an assistant observed and corrected the
subjects. Pretraining continued until both subjects res
ponded after the bell and before the onset of the orange
TRAINING AND TEST TRIAD INSTRUCTIONS
Every time the bell rings, and no light comes on, I want you to pull one of the plungers.
Sometimes, after the bell has rung, and you have pulled a plunger, the orange light beside one of the
plungers will come on. Then one of the white lights will come on. The orange light tells you which plunger you should have pulled.
Sometimes the bell will ring and the white light will come on alone. Now one of the white lights goes with one of the plungers. You have to learn to pull the correct plunger when the white light comes on alone. Try to pull that plunger every time.
If you do well, I will give you some money at the end. Any questions? Please don’t talk after we start.
The experimental session commenced and continued
as in Conditions 1 and 2, with the exception of the train
ing trial permutations.
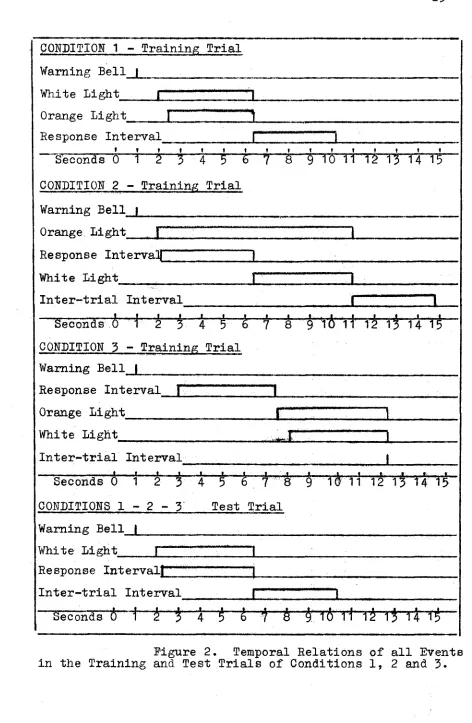
The experimental events, as they occurred in the
training and test trials, under the three conditions are
given below in Figure 2. All the temporal relations of
warning bell, white and orange lights, response intervals
and inter-trial interval are given.
The following events remained constant throughout
the experimental procedure, (l) The warning bell began
every trial. (2) The white and orange lights always over
lapped in time, and went off together. (3) The duration
of the inter-trial interval was four seconds. (4) The
23
CONDITION 1
Warning Bell^
White Light
Training Trial
Orange Light_ f
Response Interval_ • I t »
T
Seconds ^ 1 5 5 5 9 10 11 12 i3 "IT 13
CONDITION 2 - Training Trial
Warning Bell | ____________________
Orange Light :F"" " ___ I_________
Response Intervai[
White Light
I
Inter-trial Interval
Fecbnls' .’Ô' “ '"'1" ' 2 3^ 4 5
CONDITION 3 - Training Trial
1
I
Warning Bell I
Response Interval £
Orange Light________
White Light_________
Inter-trial Interval 1
4---! I «
Seconds 0 T 2 3 4 5 6 7 ' é 9 1& 11 li iS ï| 15
CONDITIONS 1 - 2 - 3 Test Trial
Warning Bell_J___
White Light T
Response IntervalÇ
Inter-trial Interval
I
The following events were varied, (l) The on
set of the orange light preceded the white light by four
seconds in Condition 2. (2) A four and one half second
response interval preceded the onset of the orange and
white lights (in that order) in Condition 3. The differ
ence in inter-stimulus interval resulting from the per
mutation of the training trial sequence, was not expected
to affect learning. (Ladd, 1965).
The subject was instructed initially to pull the
plunger beside the orange light, or the plunger beside the
orange light which he anticipated would go on. He was also
instructed to pull one of the levers when the white light
came on alone. Pretraining was sufficient for the normal
subject to l e a m what to do. For a few of the mildly re
tarded subjects, and for most of the mental retardates, it
was necessary to, repeat the instructions from time to time
during the session. When the experimenter noted that the
subject was not responding correctly during the training or
not pulling one of the plungers when the white light was
presented in the test trial, he instructed the subject to do
so by saying: "Pull the plunger beside the orange light
while the light is on;" or "Pull one of the plungers while
the white light is on". These instructions were given from
the control room during the inter-trial interval, and were
clearly audible to the subject. The only interruption in
25
trials, at which time the subjects were given a five minute
rest.
Testing time for each pair of subjects varied
from 45 minutes to one hour. The subjects were brought,
two at a time, to the learning laboratory, at the Univer
sity, and returned to school after the experimental session,
Each subject was given 25 cents at the end of the testing
session, and requested at the same time not to talk about
the test to other students at his school.
The experimental results are presented in three
sections. These sections include latency of response, level
of learning, and reminiscence. Latency was measured in
seconds; level of learning by the number of correct responses
in each test block; and reminiscence by the pumber of cor
rect responses in a post-rest block of trials, relative to a
pre-rest block.
Latency of Response
Response latency was the time, to the nearest hund-
reth of a second, between the onset of the white light and the
onset of the response in the test trials. Mean latency totals
for each IQ group in each block of 20 test trials were cal
culated. This was done by measuring the latency of each sub
ject's first five test responses (whether correct or incor
rect) in each block of 20 test trials. The mean response
latency totals for each IQ group, over each test block are
given in Table 2, together with the total latency of each
group and for each test block.
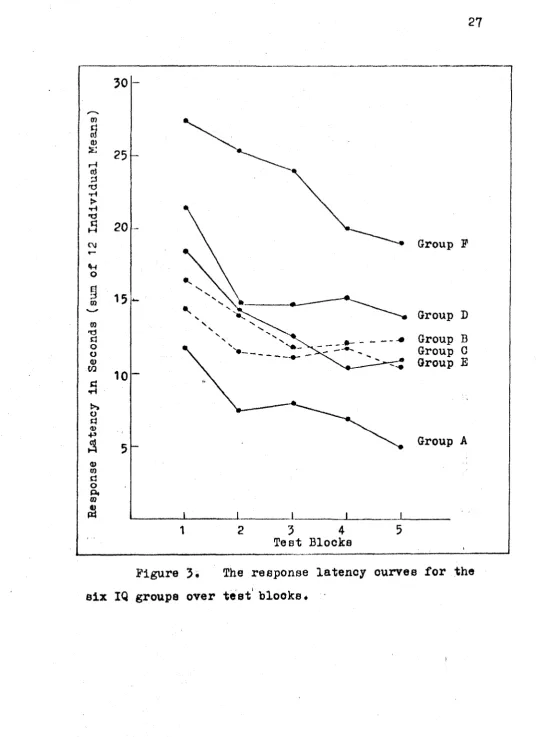
The response latency curves for each IQ group over
test blocks are presented in Figure 3. These group curves
indicated that latency totals for each of the six IQ groups
decreased from test block 1 t h r o u ^ test block 4. The
pattern in general was one of successive decreases over each
27
m
03 d o o N o d 0> ■p a<u
m
d o A 09 30 23m
S m &: d T) •H > '2 a 20C \J
I
1'10
Group F
Group D
-# Group B Group G Group E .#—
Group A
1 3 4
Test Blocks
Figure 3« The response latency curves for the
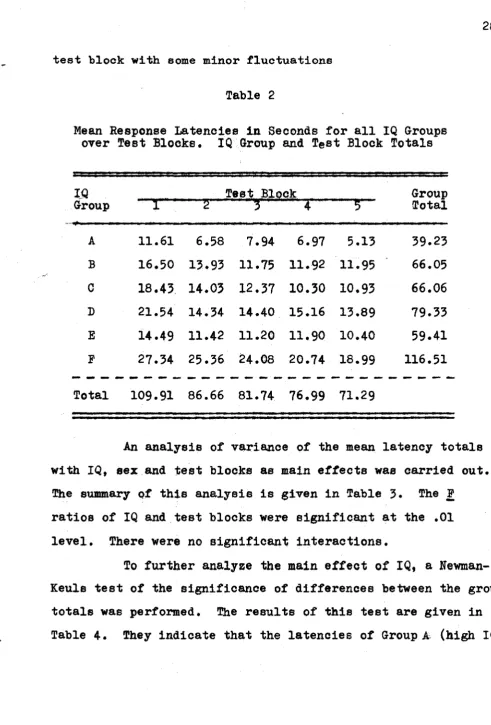
test block with some minor fluctuations
Table 2
Mean Response Latencies in Seconds for all IQ Groups over Test Blocks. IQ Group and Test Block Totals
Group
Test Block
— f
Group Total
A 11.61 6.58 7.94 6.97 5.13 39.23
B 16.50 13.93 11.75 11.92 11.95 66.05
0 18.43 14.03 12.37 10.30 10.93 66.06
D 21.54 14.34 14.40 15.16 13.89 79.33
E 14.49 11.42 11.20 11.90 10.40 59.41
P 27.34 25.36 24.08 20.74 18.99 116.51
Total 109.91 86.66 81.74 76.99 71.29
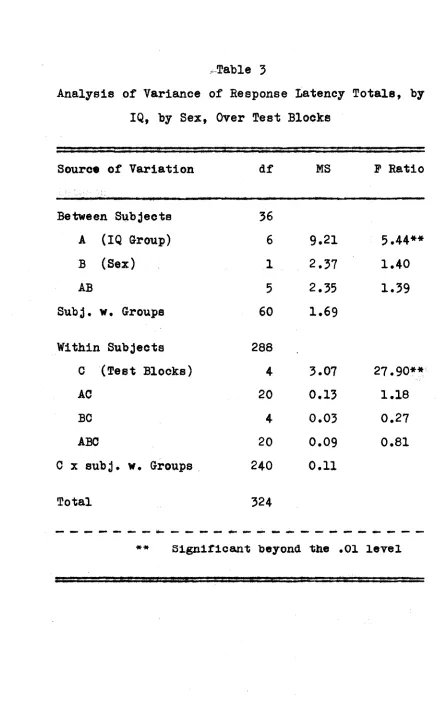
An analysis of variance of the mean latency totals
with IQ, sex and test blocks as main effects was carried out.
The summary of this analysis is given in Table 5. The P
ratios of IQ and test blocks were significant at the .01
level. There were no significant interactions.
To further analyze the main effect of IQ, a Newman-
Keuls test of the significance of differences between the group
totals was performed. The results of this test are given in
29
Table 3
Analysis of Variance of Response Latency Totals, by
IQ, by Sex, Over Test Blocks
Source of Variation df MS f Ratio
Between Subjects 36
A (IQ Group) 6 9.21 5.44**
B (Sex) 1 2.37 1.40
AB 5 2.35 1.39
Subj, w. Groups 60 1.69
Within Subjects 288
0 (Test Blocks) 4 3.07 27.90**
AC 20 0.13 1.18
BO 4 0.03 0.27
ABC 20 0.09 0.81
C X subj. w. Groups 240 0.11
Total 324
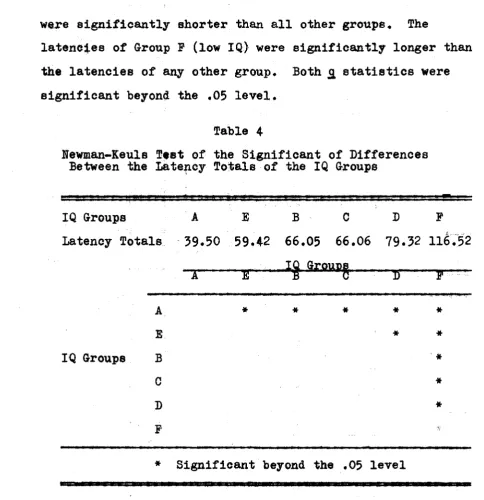
were significantly shorter than all other groups. The
latencies of Group P (low IQ) were significantly longer than
the latencies of any other group. Both £ statistics were
significant beyond the .05 level.
Table 4
Hewman-Keuls Test of the Significant of Differences Between the latency Totals of the IQ Groups
IQ Groups
Latency Totals
A
39.50 E
59,42
B C
66.05 66.06
IQ Groups
D
79.32 F
116.52
A " D " " ..
A ♦
*
« * *E *
*
IQ Groups B
'
#0
*
D
F
♦ Significant beyond the .05 level
These results suggested that latency of response, on
this particular experimental task, was positively related to
IQ at the extremes of the IQ ctmtlnuum.
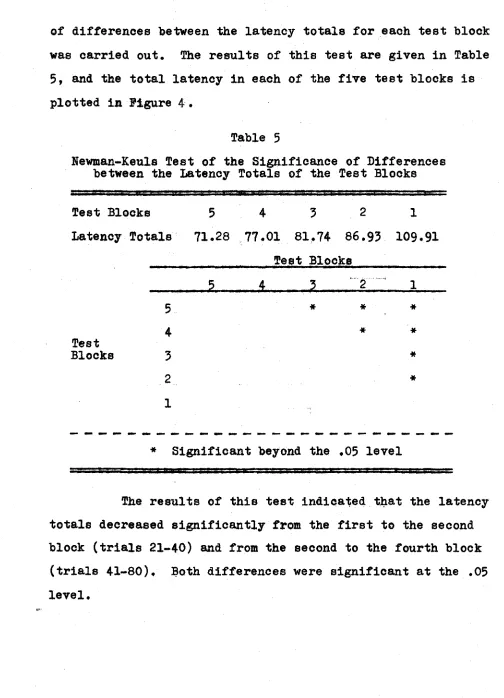
In order to analyze the significant change in latency
31
of differences between the latency totals for each test block
was carried out. The results of this test are given in Table
5, and the total latency in each of the five test blocks is
plotted in figure 4.
Table 5
Newman-Keuls Test of the Significance of Differences between the Latency Totals of the Test Blocks
Test Blocks
Latency Totals
Test Blocks
5
4
3
2
1
5 4 3 2 1
71.28 77.01 81,74 86.93 109.91
Test Blocks
A
# *
* *
*
*
* Significant beyond the ,05 level
The results of this test indicated that the latency
totals decreased significantly from the first to the second
block (trials 21-40) and from the second to the fourth block
(trials 41-80). Both differences were significant at the .05
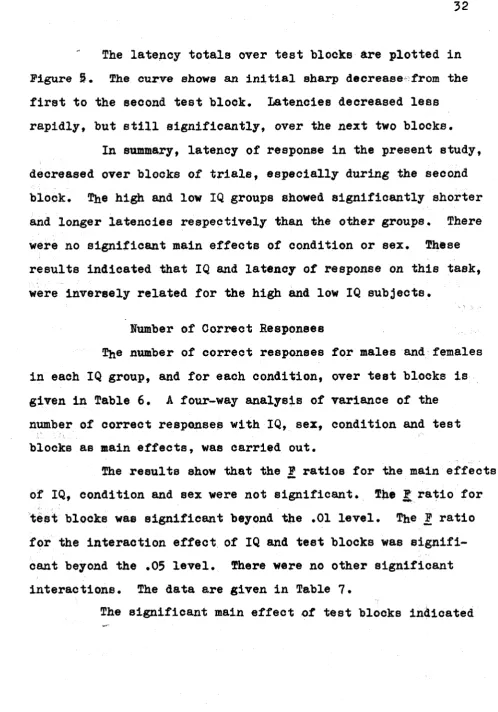
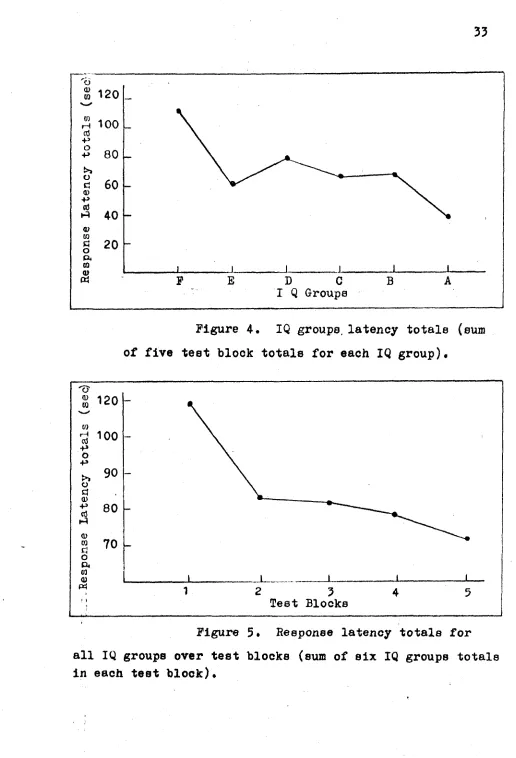
The latency totals over test blocks are plotted in
Figure §• The curve shows an initial sharp decrease from the
first to the second test block. Latencies decreased less
rapidly, but still significantly, over the next two blocks.
In summary, latency of response in the present study,
decreased over blocks of trials, especially during the second
block. The high and low IQ groups showed significantly shorter
and longer latencies respectively than the other groups. There
were no significant main effects of condition or sex. These
results indicated that IQ and latency of response on this task,
were inversely related for the high and low IQ subjects.
Number of Correct Responses
The number of correct responses for males and females
in each IQ group, and for each condition, over test blocks is
given in Table 6. A four-way analysis of variance of the
number of correct responses with IQ, sex, condition and test
blocks as main effects, was carried out.
The results show that the F ratios for the main effects
of IQ, condition and sex were not significant. The ^ ratio for
test blocks was significant beyond the .01 level. The F ratio
for the interaction effect of IQ and test blocks was signifi
cant beyond the .05 level. There were no other significant
interactions. The data are given in Table 7.
35
D C
I Q Groupe
Figure 4. IQ groups, latency totale (sum
of five test block totals for each IQ group).
-H 100
80
Test Blocks
Figure 5, Response latency totals for
all IQ groups over test blocks (sum of six IQ groups totals
Table 6
Number of Correct fiespoases for Males and Females in each IQ Group, for each Training Condition over
Test Blocks
IQ
Group Condition Sex “T ‘
Test Blocks ,2" .5 " 4 "3
1 1 1 18 20 20
2 Male 18 8 3 1 2
3 19 22 21 8 20
A
1 19 20 28 40 39
2 Female 38 40 40 40 40
3 40 37 36 54 _56
1 20 19 20 20 20
2 Male 19 19 15 20 19
3 27 17 21 13 16
B
1 26 25 25 20 20
2 Female 18 10 12 12 15
3 12 2 4 1 0
1 9 0 10 10 0
2 Male 2 0 0 0 0
3 21 29 32 40 40
G
1 16 18 15 17 17
2 Female 16 5 4 2 2
3 18 21 20 14 17
1 12 20 20 20 20
2 Male 28 29 26 26 21
3 30 21 16 22 26
D
1 21 19 20 20 20
2 Female 20 20 20 20 20
35
Table 6 continued
IQ
Group Condition Sex "1
- .r
Test3Block
'
"5"
1 20
20
20 20 202 Male 1 0 4 16 17
3 21 17 13 21 18
E
1 4 0 1 0 0
2 Female 18 20 20 20 20
3 26 24 19 25 26
1 0 0 3 0 2
2 Male 1 1 1 0 3
3 17 11
23
11 0F
1 30 26 16 13 7
2 Female 21
23
12
19 123 18 15 11 27 19
that scwe significant change in the number of correct res
ponses had occurred over test blocks. % e significant in
teraction effect of IQ and test blocks suggested that IQ had
been a factor in this change.
To investigate the significant main effects of test
blocks, a trend analysis was performed on the number of cor
rect responses in each block. The results of this analysis
are given in Table 8, They indicate that the F ratios for the
linear, quadratic, cubic and quartic trends are significant
Table 7
Analysis of Variance of the Number of Correct Responses by IQ, by Condition, by Sex Over Test Blocks,
Source of Variation df MS F Ratio
Between Subjects 71
A (IQ Groups) 5 384.42 1,26
B (Condition) 2 362,80 1,19
C (Sex) 1 618,85 2.03
AB 10 142,31 0,46
AG 5 424.68 1,39
BC 2 123,02 0,40
ABC 10 148,15 0,48
Subj, w. Groups 36 304.48
Within Subjects 288
D (test blocks) 4 11.30 2,69*
AD 20 11,23 2,67**
BD 8 7.51 1,79
CD 4 5.22 1.24
ABD 40 15.75 0.89^>
ACD 20 J2.95 0.70^ »
BCD 8 8,10 1,92
ABCD 40 36,26 8,63**
D X Subj, w. Groups 144 4.20
Total 359
* *
37
Table 8
Trend Analysis of the Number of Correct Responses Over Test Blocks
Source Of Variation df MS F Ratio
D (Linear) 1 1812.00 431.42**
D (Quadratic) 1 1407.85 335.20**
D
(Cubic) 1 752.07 179.06**(Quartic) 1 377.17 89.80**
♦* Significant beyond the .01 level
number of correct responses had occurred over the five test
blocks. Thf overall performance of all subjects was best
described by a quartic function.
To determine the significance of differences be
tween the test block totals, à Newman-Keuls test was performed.
The results of this test appear below in Table 9» and the cor
rect response totals for each of the five test blocks are
plotted in Figure 6.
The test results show that there are significant
differences between the number of correct respones in the first
block and every other block, an significant differences between
the second block, and every other block. All the differences
are significant beyond the .05 level. Figure 6 indicates that
totals. The total for the second block, on the other hand,
is smaller than that of ai^ other block. Therefore per
formance in this experimental task was significantly higher
during the first 20 trials, and significantly lower during the
second 20 trials than in any subsequent trial blocks.
Table 9
Newman-Keuls Test of the Significance of Differences between the Test Block Totals.
Test Blocks
Total
Correct Responses 575 601 613 628 651
Test Blocks
2 3 5 4 1
2 * * * *
3 *
5 *
4
1
* Significant beyond the .05 level
Therefore the significant changes in the number of
correct responses over test blocks, indicated by the analysis
of variance, were as follows: (1) a significant increase in
39
(2) a significant decrease in the number of correct responses
during the second block of 20 trials; (3) a significant increase
in the number of correct responses over the third and fourth
blocks (taken together); (4) a non significant decrease in
the number of correct responses in the fifth block of trials.
The overall performance curve of all the subjects (Figure 6) is
best described by a quartic function.
To investigate the significant interaction of IQ and
test blocks, indicated by the analysis of variance, an analysis
of simple effects was carried out. The main effect of test
blocks for the IQ groups was broken down into the simple main
effects for each IQ group. The results of this analysis are
given in Table 10.
The analysis of simple effects shows that the F ratios
for Groups B and E were significant beyond the .01 level. The
F ratios for Groups A and E were significant beyond the .05
level. The IQ group curves for correct responses over test
blocks are plotted in Figure 7*
The results of this analysis can be interpreted from
the curves in Figure 7. The performance curves of Groups A
and E were characterized by a significant increase in the
number of correct responses over blocks. The performance
curves of Groups B and F, on the other hand, showed a signifi
cant decrease in the number of correct responses over test
Group A
Group D 160
^ 140
Group B 120
•p #
-_ -• Group B
glOO Group C
Group P
Test Blocks
Figure 6. Number of correct responses for each
41
600
550
500
450
400
2.550
+> 300
250 ü
200
150
100
50
1 2 3
Test Blocks
4 5
Figure 7* The number of correct respon
The significant interaction of IQ and test blocks
was expressed as an overall improvement in the performance of
the high IQ subjects, and an overall decrement in the perform
ance of the low IQ subjects. Performance on this task was thus
found to be positively related to IQ, at the extreme ends of
the IQ continuum.
Table 10
Analysis of Variance of the Simple Effects for Each IQ Group.
IQ Group Between Subjects'
MS
df E Ratio
Test Blocks for
Group A 10.14 4 2.41*
Group B 11.06 4 4.06**
Group C 1.54 4 0.37
Group D 5.98 4 1.42
Group E 11.23 4 2.67*
Group P 22.02 4 5.24**
D X Subj. w. Groups 4.20
* Significant beyond the .05 level ** Significant beyond the .01 level
To summsirize the foregoing analysis of correct
43
as was the main effect of test blocks. The two-way inter
action of IQ and test blocks was also found to be significant.
This indicated that the IQ of the subjects was a significant
factor in their performance; that there were significant
changes in performance during the testing session; and that
IQ affected performance significantly at certain stages of
the session. The changes in the number of correct responses
over test blocks was best described by a quartic function,
since there were four significant changes in the shape of
the curve over the five test blocks. Performance increased
rapidly over the first test block, decreased sharply over
the second block, increased gradually over the third and
fourth blocks, and decreased again over the final block.
The total number of correct responses was significantly
higher in the first block, and significantly lower in
the second block, than in subsequent blokks. The significant
interaction effect of IQ ahd test blocks was expressed as
sigâifiCânt increases in the performance of Groups A and
£, and a significant decrement in the performances of Groups
B and P. Thus IQ was found to be positively related to
performance at the extreme ends of the IQ continuum, but
not at the intermediate levels.
Reminiscence Scores
3 Reminiscence is usually considered as an improve
Improvement is determined by comparing the performance scores
before a rest period with the scores after the rest period,
Reminscence, in this study, was operationally
defined as the change in performance in the 10 post-rest trials
(51-60) relative to performance in the 10 pre-rest trials (41-
50). The reminiscence,score of each subject was the differ
ence in the number of his correct responses in a pre-rest
block vs. a post-rest block of 10 trials. The reminiscence
scores for male and female subjects in each IQ group for each
condition are given below in Table 11.
An analysis of variance of reminiscence scores with
IQ, condition and sex as the main effects, was carried out.
The summary of this analysis is given in Table 12.
The P ratio for the main effect of IQ was signifi
cant beyond the .05 level. The P ratios for the main effects
of condition and sex were not significant. There were no
significant interactions. These results indicated a signifi
cant relationship between IQ and reminiscence.
To determine the significance of differences between
the reminiscence scores of the IQ groups, a Newman-Keuls test
was performed on the group totals. The results of this test
show that the reminiscence scores of Group A and Group F dif
fered significantly beyond the .05 level. The reminiscence
scores for each IQ group are plotted in Figure #. This curve
45
IQ Groupa
Figure 8. Reminiecence scores for each IQ group
(correct responses in post-rest block of 10 trials minus