Article
Experimental Testing of Reinforced Concrete Deep
Beams Designed by Strut-and-Tie Method
Anka Starčev-Ćurčin 1, Andrija Rašeta 1,*, Mirjana Malešev 1, Danijel Kukaras 2, Vlastimir Radonjanin 1, Miloš Šešlija 1 and Drago Žarković 1
1 University of Novi Sad, Faculty of Technical Sciences 1, Trg Dositejа Obradovicа 6, 21000 Novi Sad; astarcev@uns.ac.rs; araseta@uns.ac.rs; miram@uns.ac.rs; radonv@uns.ac.rs; sele@uns.ac.rs;
dragozarkovic@uns.ac.rs
2 University of Novi Sad, Faculty of Civil Engineering, Kozaracka 2a, 24000 Subotica; dkukaras@gf.uns.ac.rs
* Correspondence: araseta@uns.ac.rs
Abstract: This paper presents the results of the experimental research and numerical analysis of three reinforced concrete deep beams with openings, designed by the Strut-and-Tie method according to the EN 1992-1-1 recommendations. All tested specimens were made in full size, with the same geometric characteristics and quality of the materials. The specimens, constructed as simply supported beams, were loaded with two concentrated forces and were tested for bending until failure. Each specimen was reinforced with different reinforcement layout determined by parameter variation within the Strut-and-Tie method. Based on the results of experimental research, it was concluded that the behavior of loaded members was in agreement with the proposed forms of the Strut-and-Tie models that were used for their design.
Keywords: reinforced concrete; deep beams; Strut-and-Tie models; experimental research
1. Introduction
Strut-and-Tie is one of the methods that can be used for the design of reinforced concrete members in which geometric and static discontinuities (D-regions) occur, and where the conventional design method does not apply, as it is the case with the whole or parts of the member, the so-called, B-region [1], Figure 1.
Figure 1. B and D regions.
The advantage of this method is reflected in the simplicity of its design application, while one of the main disadvantages is that there is no single solution for the Strut-and-Tie model form. This disadvantage is a consequence of the possibility to form valid Strut-and-Tie models in many variations. The Strut-and-Tie model can be adapted to follow main stress trajectories, it can be conditioned by the reinforcement layout and it can be determined intuitively, i.e., based on engineering assessment. Typical examples of the members where Strut-and-Tie models can be
successfully applied are: pile cap, stiffening cross sections diaphragm, wall members with and without openings, places with sudden static or geometrical changes (e.g., sudden reduction in cross section at the end of the member, places where large concentrated loads are applied), short elements, etc.
So far, a significant number of experimental studies have been carried out regarding the application of the Strut-And-Tie method for the design of a part or the whole of reinforced concrete members. In general, the objectives of this research relate to the verification of the method from the aspect of the Strut-and-Tie model and member strength, [2–6].
The testing of deep concrete beams, designed by various methods, including the Strut-and-Tie method, is shown in the paper [7]. Analytical predictions of the member strength were made and then compared with the results obtained by the experiment. Twenty members were tested, in two series of ten. The specimens had the same geometry (height H = 42 cm, length L = 82 cm and thickness w = 20 cm), mechanical properties and low shear span-to-depth ratio a/H = 0.27. The load was represented by two forces that were positioned at the thirds of the span length. The member supports were positioned symmetrically, at the distance of 14.15 cm from the edge of the member. Variations within specimens were made with respect to the position of the circular hole, the layout and the quantity of reinforcement. Following the experimental investigations, Giuseppe and Giovanni [7] came to the conclusion that the members’ failure shapes and the load values at the moment of the first crack appearance were dependent on the existence and position of the opening. When the hole was set in the region of the shear span, the load reduction was in the range of 18-30%, while the hole in the center of the member did not affect the behavior of the deep beam. The existence of vertical stirrups increased the load limit value by approximately 15% in the case of a solid member and in the member with an opening in the central part, while there was no significant impact when the opening was set in the region of the shear span. Horizontal reinforcement increased the member strength by approximately 20% in the region of the shear span, whereas there was no impact if the opening was in the center of the member. By comparing analytical and experimental results, similar strength values were obtained.
Morad and Reza Esfahani, [8], experimentally examined two different types of wall members, with one wall member having ordinary reinforcement, while the other wall member, besides reinforcement, had steel fibers added to the concrete mixture [8]. The amount and arrangement of reinforcement for all wall members was determined using the Strut-and-Tie method. The wall members were loaded with one concentrated force. Two members had dapped heights (of 35 and 60 cm), and two members had constant heights (H = 86 cm). Each of the specimens had rectangular opening positioned on the load transfer path from the application location to the support. The amount of reinforcement of the wall members with the addition of steel fibers was smaller when compared to the amount of reinforcement for the ordinary reinforced concrete wall members. The amount of added steel fibers in concrete was 1.5% of the total amount of concrete mixture. In the paper [8], the appearance of the cracks and the behavior of wall members under applied load were examined. After the experimental research was completed, it was concluded that the wall members which were made with the addition of steel fibers and a smaller amount of reinforcement, had much fewer cracks. The fibres cannot delay cracking, they can only control cracking, i.e. they can result in more cracks with smaller widths. Experimental testing showed that the directions of the compressed and tensioned Strut-and-Tie elements corresponded to the crack pattern. This supported the conclusion that the method proposed in the paper can be applied in practice.
cost-effectiveness for better assess of the economic feasibility of the reinforcement design guided by different optimal Sturt-and-Tie models. All specimens had an ultimate load-carrying capacity that exceeded the corresponding design load, verifying the conservativeness of the Strut-and-Tie design method.
Zhang, Li, Xie and Guo, [10], tested the shear capacity performance for eight deep beams designed by Strut-and-Tie method according to the provisions of different standards. All of the beams have the same dimensions and different layouts and amount of reinforcement, and are made of high strength concrete. The beams were loaded with two concentrated forces on the beam top. The analysis are conducted to enable a better understanding of the effects of shear span–depth ratio, longitudinal reinforcement ratio, vertical stirrup ratio and in order to improve design procedures. It was concluded that shear span-depth is the most important parametar that controls behavior and shear capacity of the beams, longitudinal reinforcement ratio has no effect on serviceability load, but has grater impact on ultimate load, vertical stirrup ratio, due to its absence in some of the equations of regulations, has no effect on serviceability and ultimate load, and some of the applied provisions are mostly over-conservative and some has a reasonable degree of accuracy.
Brena and Morrison, [11], have experimentally tested four wall members with openings, using the Strut-and-Tie method to determine the required amount of reinforcement. All wall members had a rectangular shape. The two wall members had only one opening, while the other two had two rectangular openings. The layout of the reinforcement was different for all wall members in accordance with the directions of the struts and ties. The authors concluded that the strength of the elements designed by using the Strut-and-Tie method in relation to the experimentally obtained results is approximately 3 times higher, which supports the claim related to the conservative nature of the method.
The scaled reinforced concrete wall members designed by the Strut-and-Tie method were experimentally tested by Maxwell and Breen [12]. They have examined four wall members with openings and the same geometry, but with the different reinforcement layouts. The authors concluded that the behavior of experimentally tested members was in accordance with the position of the compressed and tensioned elements of the chosen Strut-and-Tie models. Similarly to the conclusion in the paper [11], it has been also shown that the strength determined by the and-Tie method is lower than the experimentally determined load capacity, which confirms that the Strut-and-Tie method is reliable.
Saho and others [13] were examining the behavior of reinforced concrete wall members designed by means of the Strut-and-Tie method. Out of the total of four members, two were made with normal reinforced concrete and the other two were made from reinforced concrete with the addition of steel fibers in the amount of 1.5% of the total member volume. The members with steel fibers were reinforced so that the reinforcing bars, unlike ordinary reinforced members, were positioned only at certain critical locations in the member. The conclusions of the study in the paper [13] indicated that the Strut-and-Tie method underestimates the ultimate limit strength of tested specimens. The specimens with normal reinforced concrete reached the designed strength value, but without the failure. Similar to the previous research papers, this study also showed that the designed strength is three to four times lower than the experimentally determined load capacity. The behavior of specimens in experimental testing has shown that steel fibers can replace a certain amount of reinforcement bars.
the optimum shape can be achieved by establishing certain criteria, i.e. conditions, such as the simplicity of the reinforcement scheme or the amount of reinforcement.
The main goal of the research presented in this paper is the experimental confirmation of the numerically defined forms of the Strut-and-Tie models obtained from the software "ST method". These models were used for the design of the tested reinforced concrete deep beams and optimal model, in a sense of simplicity of member reinforcement and its serviceability, is selected. Three reinforced concrete wall members with the length of 200 cm, the height of 130 cm and two openings measuring 30x30 cm were experimentally tested. The members were differentially reinforced and loaded with two concentrated forces of 2x100 kN.
For the analysis purposes in this paper, the Finite element model (FEM) model was developed in the commercial software Abaqus [32] to simulate the behavior of the tested specimens, which was validated on the basis of the experimental results. This FEM model will provide oportunity for extrapolation of data on other, untested geometries of the members and reinforcement layouts in future research.
2. Determination of Strut and Tie models using software "ST method"
This chapter summarizes the procedure for determining the Strut-and-Tie models and is explained in detail in [14,15].
Strut-and-Tie models are suitable for the design of discontinuity regions in structural concrete elements, where the conventional analysis methods is incorrect as the main modelling assumption (i.e. plane sections remain plane) deviate significantly from the actual behaviour.
Discrete topology optimization [16,17], is implemented in the software "ST method", which has the ability to analyze a reinforced concrete member in the plane. By discrete topology optimization, a member can be modeled with the truss system, such as the Strut-and-Tie model. One of the most common optimization conditions is the smallest amount of reinforcement.
In the software "ST method", according to discrete topology optimization, the geometry of a member is represented with initial network of nodes, which are interconnected by line elements (rods). The optimal density of this initial network is analyzed in detail in [15]. The analysis for the determination of the Strut-and-Tie models is iterative, where the stiffness recalculation of individual elements is performed during each step, based on the analysis results from the previous step. The correction of cross-sectional stiffness depends on the sign and the intensity of the truss element force. The stiffness element is changed indirectly through changes in the cross-sectional area. The stiffness of the individual elements of the truss model is determined by the expression [18,19]:
Ki,j = βi∙(Ed∙Ni,j-1)/(Li∙fd) (1)
and the cross-sectional area of individual truss elements is determined with:
Ai,j = βi∙Ni,j-1/fd (2)
where: βi is the reduction factor which depends on the "desired" reinforcement layout in the member;
Ni,j−1 is the force in the ith simple element from j−1 iteration; Ed is the modulus of elasticity for concrete
(compression) or steel (tension); fd is the design strength of the concrete or reinforcement depending
on the nature of the axial force in the truss element (compression-concrete or tension-steel); Li is the
determined on the established model. Based on the sign of the axial forces, the area of the cross sections is determined for all the elements according to Equation 2. Simultaneously, the modulus of elasticity for each truss element is corrected. In this way, the truss model is formed for the next iteration. Iterations are repeated until the change of the cross-sectional areas of the truss model elements in two consecutive iterations is small enough. Recommendations for completing the iterative procedure and determining the Strut-and Tie model, as a truss model from the last iteration, are given in [14,15].
In the software "ST method", the struts and ties are designed according to [20] and the nodal zones are analyzed as non-hydrostatic, with procedure defined by authors and presented in detail in [15,21]. The nodal zone is defined as polygon, with geometry determined by the width of the rods that are crossing at the node, Figure 2 a. Stress state in such defined nodal zone is controlled by the biaxial criterion of concrete, taken from the software "ST method", Figure 2 b, according to [22], and considering the use of efficiency factors depending on the type of the node according to [20].
Figure 2. a) Nodal zone polygon, b) Biaxial strength of concrete from the software "ST method".
Nodal zone polygon is modeled with multiple LST triangular finite elements that have a common point, node A, where all main axis of corresponding Strut-and-Tie model rods are crossing. The axial forces of struts and ties are applied in the middle of the polygon edges (P1, P2, ... Pn). In order to solve the stress state of the node, one support is set in the point A, and the second support is set in the middle of the one polygon edge, Figure 2 a. In this way displacements of the polygon, as a rigid body, are eliminated, and this behavior approximately corresponds to the behavior of the isolated node from concrete volume of the member.
3. Experimental program
3.1. Material properties
For the preparation of the tested specimens, the following materials were used:
- Cement type CEM II/A-S with the strength class 42.5R (Nexe, Našice, Republic of Croatia). The basic physical and mechanical properties of used cement, given in Table 1, were tested according to standards EN 196-1 [23] and EN 196-3 [24].
Table 1. Cement Properties.
Physical-mechanical properties PC 20S 42.5R Initial Setting time [min] 160
Soundness [mm] 0.5
- Fine and coarse aggregate, natural aggregate, had fractions 0/4 mm, 4/8 mm and 8/16 mm (river Drina, Serbia). The grain size distribution is shown in Figure 3.
Figure 3. Grain size distribution of aggregate fractions.
It can be noticed that there are no undersize and oversize grains for all aggregate fractions. The obtained results of the tested physical-mechanical properties are given in Table 2.
The concrete of class C25/30 is chosen for the preparation of reinforced concrete wall specimens. The composition of the concrete mixture is given in Table 3.
Table 2. Physical-mechanical tests of the fractionated natural aggregate.
Type of testing Procedure Fraction [mm] Recommendations
0/4 4/8 8/16
Finest content (%) EN 933-1 [25] 0.76 0.07 0.02 to be declared Shape Index EN 933-4 [26] - 8.3 SI15 15.6 SI20 ≤ SI55
Resistance to fragmentation “Los
Angeles”
EN 1097-2 [27] 25.4 LA30 27.3 LA30 ≤ LA50
Oven-dry particle
density (kg/m3) EN 1097-6 [28] 2620 2620 2510 ≥ 2100 kg/m 3
Table 3. Composition of concrete mixture. Water
[kg/m3]
Cement [kg/m3]
Aggregate [kg/m3]
0/4 4/8 8/16
208 346 831 381 519
Three standard cube specimens were tested, with the edge of 150 mm, prepared and cured in accordance with EN 12390-2 [29]. The testing of the concrete compressive strength after 28 days was done according to the EN 12390-3 [30], Figure 4 a. The obtained test results are shown in Table 4 and Table 5.
According to the test results, the mean value of the density of hardened concrete was 2406 kg/m3
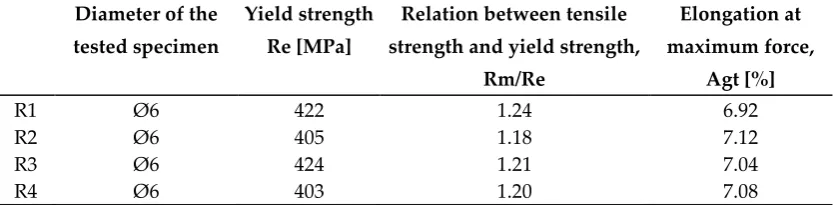
and the average concrete compressive strength was 31.9 MPa, while the tensile strength was 2.37 MPa. The yield strength and tensile strength of the reinforcing steel were tested according to EN ISO 15630-1 [31] on four specimens, Figure 4 b. Test results are given in Table 6.
Specimen Compressive strength Cube edge [cm] Mass [kg] Compressive force [kN] Compressive stress [MPa]
1 15.40 8.10 752 31.71
2 15.30 8.15 746 31.61
3 15.40 8.10 768 32.38
mean 15.37 8.12 755.33 31.90
Table 5. The results of tensile splitting strength.
Specimen Tensile splitting strength
Cube edge [cm] Mass [kg] Compressive force [kN] Tensile stress [MPa]
1 15.30 8.10 82 2.23
2 15.20 8.10 80 2.20
3 15.10 8.00 96 2.68
mean 15.20 8.06 86 2.37
Figure 4. a) Testing of the concrete compressive strength, b) Tensile strength testing of the steel for reinforcement.
Table 6. The results of tensile splitting strength. Diameter of the
tested specimen
Yield strength
Re [MPa]
Relation between tensile
strength and yield strength, Rm/Re
Elongation at
maximum force, Agt [%]
R1 Ø 6 422 1.24 6.92
R2 Ø 6 405 1.18 7.12
R3 Ø 6 424 1.21 7.04
R4 Ø 6 403 1.20 7.08
3.2. Specimen details
The geometric characteristics of all three tested reinforced concrete members are the same and shown in Figure 5 b. The members were simply supported with a span of 180 cm and with symmetrically arranged openings. The thickness of all three experimental specimens is 10 cm. The elements are symmetrically loaded with two concentrated forces in the thirds of the span length.
individually shown in Figure 5 a, Figure 6 a and Figure 7 a, where the solid red lines show the tensioned Strut-and-Tie model elements, and the dashed blue lines represent the compressed elements. Also, the axial forces values of truss elements are shown, as well as initial node network and connectivity of nodes by rods.
The Strut-and-Tie model for the W1 specimen was determined without limitation in relation to the direction of the reinforcement layout, Figure 5 a. The holes in the static system used in the program "ST method" for design of the beams are increased by one half of the thickness of the compressed and tensioned rods that extend along the very edge of the opening. This implies an iterative calculation in which the static model is corrected after each design and determination of the Strut-and-Tie model, until the change in geometry between the two models is small. In this way, it is ensured that the rods of the Strut-and-Tie model pass through the concrete mass of the real member along their entire height. The same principle is applied to the rods of the Strut-and-Tie model which are located along the outer edges of the member. The span and the load position of the real member and the numerical member are the same.
Strut-and-Tie models were used for the design of the tested reinforced concrete members according to [20], with the design load of 2x100 kN. The adopted layout and quantity of reinforcement are shown in Figure 5 b, Figure 6 b and Figure 7 b, for each specimen individually. Also, when reinforcing the specimens, only reinforcement was adopted at the places of the ties of the Strut-and-Tie model.
Figure 5. a) Strut-and-Tie model for W1, b) Reinforcement layout.
For the W2 specimen, the Strut-and-Tie model was determined provided that the horizontal direction of the reinforcement was favorable, Figure 6 a.
Figure 6. a) Strut-and-Tie model for W2, b) Reinforcement layout.
specimen W3 is not common in practice, so the equivalent amount of reinforcement in the horizontal direction within that zone is adopted, Figure 7 b.
Figure 7. a) Strut-and-Tie model for W3, b) Reinforcement layout.
3.2.1. Preparation of specimens
The formwork, the reinforcement of walls W1 - W3 and reinforcement spacers are shown in Figure 8 a-c. Three reinforced concrete members after concreting are shown in Figure 8 d.
Figure 8. a) Formwork with reinforcement: a) W1, b) W2, c) W3 and d) Concreted reinforced concrete members.
3.3. Equipment and realization of the experimental testing
member W1, 10 for both members W2 and W3, and 10 strain gauges for the reinforcement for each of the members W1, W2 and W3.
The steel frame used in experimental testing is shown in Figure 13. On the vertical elements of the steel frame, Figure 14 a, in the middle of the height and at the top of the examined specimens, spacers for lateral holding were placed, Figure 14 b. The reinforced concrete members were symmetrically loaded with two concentrated forces in the thirds of the span length. During the experimental testing the load was applied in the steps of 2x5 kN with three minute breaks between steps.
Figure 9. a) Hydraulic press with force sensor, b) Hand pump for load application.
Figure 10. The arrangements of comparators for measuring deflection and strain gauges for specimen W1.
Figure 12. The arrangements of comparators for measuring deflection and strain gauges for specimen W3.
Figure 13. Steel frame for testing reinforced concrete members: a) frame appearance and b) geometric characteristics.
Figure 14. Out-of-plane stability of the specimen: a) position of the spacers and b) spacer.
4. Finite element modeling
As part of this research, a FEM models were developed in Abaqus 2016 [32] for the simulation of the reinforced concrete deep beams behavior, which were validated on the basis of the experimental test results. In future researches, one of the FEM models will be useable for analyzing the behavior of this type of members, but with different geometric characteristics and reinforcement layouts. In the models, the analyses were performed assuming a plane stress state. An analysis involving geometric and material nonlinearity was applied.
Figure 15. Model FEM A of the reinforced concrete walls: a) W1, b) W2 and c) W3.
Comparing the results determined on the model FEM A shown in Figure 15 and experimental results, it is shown that the differences were large. The main reason is the existence of an interaction between the steel frame and the tested specimens, Figure 13, which is explained in detail in Chapter 5. Regarding this, a more complex FEM model (FEM B) was formed, which is shown in Figure 17.
To simulate the nonlinear behavior of reinforced concrete, in the model FEM A and model FEM B, the so-called Continuum mechanics-based models were applied. In such models, concrete can be discretized with three-dimensional or two-dimensional solid finite elements, and the reinforcement is modeled with truss finite elements. The constitutive model for concrete is the Concrete Damaged Plasticity (CDP) model, formed by a combination of plasticity theory and damage mechanics according to recommendations [33-36]. In all nonlinear analyzes, the relationship between stress and deformation in concrete at uniaxial pressure prescribed in EN1992-1-1 [20] was applied. Figure 16 shows the relationships between stresses and strains at uniaxial pressure and tension for concrete and reinforcement.
Figure 16. Stress-strain relationships: a) for concrete at pressure, b) for concrete at tension and c) for reinforcement.
The values of the constituent parameters of the CDP model were adopted based on the recommendations given [37] and summarized as Kc = 0.7, ψ = 13°, σbo/σco = 1.16 and ϵ = 0.1. Kc defines
the relationship between the second invariant of the stress in the meridional plane at tensile and pressure, ψ is dilatancy angle, σbo/σco is the ratio of the biaxial to uniaxial compressive strength of
concrete and ϵ is the eccentricity of the plastic potential surface. B21 finite elements were used for the steel frame modeling („Timoshenko beam; B – beam; 2 – beam in plane; 1 –linear interpolation”) [32]. The reinforcement was modeled by T2D2 finite elements („Two-dimensional truss element; T – Truss, 2D – Two-dimensional; 2 – Number of nodes“) [32]. CPS4 finite elements were used to model the concrete („C – Continuum Stress/Displacement; PS – Plane Stress; 4 – 4-node) [32]. The bond between concrete and reinforcement was modeled without slip. The values of compressive strength and tensile strength of concrete and the yielding strength of reinforcement were determined experimentally and given in Section 3.1. In all analyzes, the loading protocol was such that the weight effect of the reinforced concrete wall and the steel frame was analyzed first, and this condition was adopted as initial for the analysis of the press action.
option of rigorous penetration prevention was adopted. If the contact is not made, there is no transfer of pressure in the normal direction. The behavior in the tangential direction features the possibility of friction forces occurrence between the surfaces in contact. The coefficient of friction in all analyzes had a value of 0.2. Since the appearance of the first member cracks was influenced by the arrangement of the wooden spacers for fixing the reinforcement in this model FEM B, on location of the spacers, the discontinuity of concrete volume was modeled so it can correspond to experimental setup. Wooden spacers were modeled as CPS4 finite elements with linearly elastic behavior (E = 10 GPa).
Figure 17. Model FEM B of the reinforced concrete W1 specimen with wooden spacers and the steel frame.
5. Results and discussion
During the testing of the reinforced concrete member W1, the first cracks appeared at the load level of 2x90 kN, with the layout and widths as shown in Figure 18, (cracks in Phase I). At the load of 2x10⁵ kN, new cracks appeared and of the existing cracks widths increased (cracks in Phase II). By further load intensity increasing, no new cracks appeared, but the existing cracks continued to propagate in both length and width (cracks in Phase III, at the load intensity of 2x115 kN). At the maximum load level of 2x150 kN, only the increase in the width of the existing cracks was registered (cracks in Phase IV).
According to the failure pattern (rounded cracks in red colour, Figure 18), the weak regions of the specimen were the inclined cracks between the supports and the holes.
In the specimen W2, the first crack was formed at the load level of 2x90 kN. The position and width of this crack are shown in Figure 19, (crack in Phase I). By increasing the load level during Phase II (at load intensity of 2x100 kN), the new cracks appeared and the propagation of the width of the existing crack was seen.
of the specimen were the vertical mid-span crack and the inclined crack between the right support and the hole.
Figure 18. Crack and failure pattern: a) tested member W1 at maximum load, b) schematic view.
Figure 19. Crack and failure pattern: a) tested member W2 at maximum load, b) schematic view.
Figure 20. Crack and failure pattern: a) tested member W3 at maximum load, b) schematic view.
In the W1 and W2 members, the first cracks occurred at a load level of 2x90 kN, while in the member W3 they occurred at a load level of 2x70 kN, which is summarized in Table 7. Regardless of the amount of embedded reinforcement, which is placed only in the directions of tensioned Strut-and-Tie elements of models obtained from the software "ST method", the size of the formed cracks did not cause the disintegration of the members. In reality, they could carry more than the maximum applied load.
In the model FEM A crack arrangements, Figure 21 b, e and h, corresponded to the adopted forms of the Strut-and-Tie models for design. For walls W1 and W2, the crack distributions obtained by experimental tests, Figure 21 a and d, did not correspond to the crack arrangement determined in the model FEM A, and at wall W3 the crack arrangement approximately corresponded, Figure 21 g. The reason for this behavior of the member is the interaction between the steel frame and the walls during the test. The consequence is the achievement of lower values of stresses and strains at the same load level compared to Strut-and-Tie models applied for design.
Table 7. Crack widths depending on load level. Memb. Load level
(first crack) [kN]
Crack direction
First crack width
[mm]
Max load level [kN]
Crack width at max load level
[mm]
Total number of cracks
W1 2x90 inclined 0.75 2x150 4.0 5
W2 2x90 vertical 1.2 2x150 7.0 3
W3 2x70 inclined 0.4 2x150 1.5 7
According to the above-mentioned, the model FEM A was expanded and the model FEM B was formed, which, in addition to the tested specimens, contains a steel frame and its contact with the ground and wooden spacers, Figure 21 c, f and i, and which was used for further analyzes.
The distributions of tensioned damage obtained by model FEM B analyzes are shown in Figure 21 c, f and i, at the maximum load level. Distribution of cracks in tested elements is in accordance with the distribution of damage determined by model FEM B analysis, although it was observed that the arrangement of the cracks, especially the appearance of the first cracks, was influenced by the arrangement of the spacers for fixing the reinforcement. The dimensions of the spacers are such that they extend over the entire thickness of the specimen, so that the holes in concrete volume were formed in their places to initiate the cracks at the beginning.
Based on the measured mid-span deflection at measuring points D1, D3 and D5 (Figure 10, Figure 11 and Figure 12), a relative mid-span deflection was calculated at the measuring point D3. The diagrams of the relative mid-span deflections of the W1, W2 and W3 members are shown in Figure 22. It can be concluded that the mid-span deflection of the W3 specimen at each load intensity is smaller than the mid-span deflections of the other specimens. At the load level of 2x100 kN the mid-span deflections of specimens W1 and W2 are approximately the same and larger by about 37% when compared to the mid-span deflection of the W3 specimen. At the load level of 2x150 kN, which is close to the maximum load intensity for all three specimens, the mid-span deflection of the specimen W1 is approximately 20%, and of the specimen W2 is approximately 60% higher than the mid-span deflection of the W3 specimen. It can be concluded that the bending rigidity of the W3 specimen is higher than those of the specimens W1 and W2. It can also be concluded that specimens W1 and W2 have approximately the same mid-span deflections up to the load level of 2x100 kN, and at the load level of 2x150 kN, the mid-span deflection of the specimen W1 is by approximately 36% smaller than the one of the specimen W2.
Figure 22. Mid-span deflection at the measuring point D3 of members W1, W2 and W3.
A comparison of the measured mid-span deflections with the results of the model FEM B analysis is shown in Figure 23. It is observed that the deflection change trend determined experimentally and by model FEM B analysis is the same for all three walls individually.
The displacement values at designed loads of 2x100 kN obtained by numerical analysis are greater than those obtained by experimental testing for walls W1 and W2 and these differences are approximately 24% and 21% respectively, Figure 23 a and b. For wall W3, the displacement value determined by numerical analysis at design load is less than 8% of the displacement obtained by experimental testing, Figure 23 c.
The measured and numerically (model FEM B) determined strains at measuring points C4, C5 and C6 (see arranged gauges in Figure 10, Figure 11 and Figure 12) are shown in Figure 24 till Figure 26.
Figure 24. Experimental and numerical (model FEM B) strains of member W1 in gauges: a) C4, b) C5 and c) C6.
Figure 25. Experimental and numerical (model FEM B) strains of member W2 in gauges: a) C4, b) C5 and c) C6.
Figure 26. Experimental and numerical (model FEM B) strains of member W3 in gauges: a) C4, b) C5 and c) C6.
The maximum values of the tensile strains in the reinforcement at the mid-span of the lower edge of the member are: 0.27‰ (at the measuring point S8 of the specimen W1, Figure 10), 1.35‰ (at the measuring point S4 of the member W2, Figure 11) and 1.1‰ (at the measuring point S6 of the member W3, Figure 12). At other measuring points, in the member W1, the measured maximum value of the tensile strain did not exceed 1.8‰, the maximum value of the tensile strain measured in the member W2 was not greater than 1.25‰, while for the specimen W3, the measured maximum tensile strain value did not exceed 0.16‰. The maximum values of the tensile strains in the reinforcement at the measuring points S8, S4 and S6 of specimens W1, W2 and W3 respectively, did not reach the ultimate limit strain values. The reason is in the fact that the steel frame with its rigidity reduced stresses and deformations in the member. The member is designed in the software "ST method" under the assumption of a static simple beam system. However, during the test, because of the interaction between the frame and the specimen, the spreading between the points at the contact of the frame and the specimen (Figure 13, zones rounded in red) was partially prevented due to the stiffness of the frame. This phenomenon will be explained for specimen W2, and the other samples behaved analogously. Based on experimentally measured strains at half the height of the "U" profile (Figure 13, zones rounded in red colour, and Figure 27), the values of normal force, bending moment and transverse force were determined. At designed loads of 2x100 kN, the normal force, bending moment and transverse force were - 129.91 kN, 7.36 kNm and 17.24 kN, respectively. By experimental measurement of strains in the reinforcement along the lower edge of the member (measuring point S3/S4, Figure 11), the axial force in the reinforcement was calculated, which at a load value of 2x100 kN is 11.77 kN. The axial force in the tie, along the lower edge of the support, of the Strut-and-Tie model for design, determined in the program "ST method", is 33 kN. The difference between this axial force and the axial force calculated on the basis of experimental results is 33 - 11.77 = 21.23 kN. One part of this difference in the amount of 17.24 kN is the consequence of the stiffness of the steel frame (transverse force in the "U" profile), and the rest of 21.23 - 17.24 = 3.99 kN is the force due to the effective area of concrete in tension.
Figure 27. "U" profile at the point of support of the tested speciments on the steel frame.
Based on the maximum measured values of strains in concrete and reinforcement, it can be concluded that the ultimate limit strain values have not been reached at the maximum intensity of the applied load during the test.
5.1. Optimal Strut-and-Tie model of reinforced concrete members
is placed only in orthogonal directions, parallel to the edges of the element, have the advantage), the size and arrangement of the cracks (preferred models are those with smaller crack widths) and maximum mid-span deflection. In this research, all considered criteria are covered with the same importance. The criteria for all three specimens are given in Table 8. The plus sign (+) indicates that the specimen is optimal, according to one of the above criteria.
Table 8. The selecting of optimal solution.
Members
Criteria by
Reinforcement
amount
Simplicity of
reinforcement layout Crack width
Max mid-span
deflection
W1 - - - -
W2 + + - -
W3 - - + +
Member specimen W3 has the smallest crack widths and mid-span deflection at the maximum load intensity, but also the largest amount of reinforcement. However, it must be admitted that in the same specimen, the reinforcement layout is the most complex one. On the other hand, member W2 has the smallest amount of reinforcement and the simplest reinforcement layout, but has the greatest crack widths and mid-span deflection at the maximum load intensity. Although specimens W2 and W3 have the same number of plus (+) marks, the authors of this paper nevertheless suggest, regardless of the criteria taken with the equal importance, that the optimal solution is the one applied in specimen W3 since in its case the smallest crack widths occur.
6. Conclusions
In this paper, the results of experimental testing of three reinforced concrete deep beams with openings designed by the Strut-and-Tie method are presented. Specimens have the same geometrical and mechanical characteristics of the material and monotonic increasing load is applied until failure on them. Each of the specimens is reinforced by a different reinforcement layout which is determined by the analysis in the software "ST method". As suspected, the first cracks were influenced by the arrangement of the spacers for fixing the reinforcement, which is confirmed by FEM analysis in program Abaqus. Since the appearance of the first member cracks was suspected to be influenced by the arrangement of the spacers for fixing the reinforcement, numerical model FEM B was developed to further examine this possibility. In the model FEM B on location of the spacers, the discontinuity of concrete volume was modeled so it can resemble experimental setup. The model FEM B will provide oportunity for extrapolation of data on other, untested geometries of the members in future research.
The following conclusions are derived from the test results:
• strain values in concrete and reinforcement, for the maximum load intensity in the test, did not reach the ultimate limit values of the strains for concrete in compression and for reinforcement in tension. This indicates that the maximum load intensity in the test is greater than the ultimate limit load for design. One of the reasons for this is the conservativeness of design of the members according to the Strut-and-Tie method, which is implemented in the program "ST method", and which uses in the analysis the constant cross-sections of the rods in the replaced truss member. In contrast, the generated Strut-and-Tie models in the tested members have bottle-shaped struts with rigid connections and cross sections that are realistically larger than the calculated ones. Also, the conservativeness of design is affected by the neglecting of adhesion between concrete and reinforcement in the zone between cracks. In addition, the stiffness of the steel frame also affected the reduction of stresses and strains in the tested specimens;
• although the member is designed in a static simple beam system, numerical simulations (models FEM A and FEM B) of experimental testing have shown that the interaction between wall, frame and floor base, as well as the existence of spacers significantly affected the numerical results. The model FEM B can be used to simulate the nonlinear behavior of the tested specimens for displacement estimating. Such complex simulations can significantly contribute to the reduction of material costs of experiments and savings of research time in the initial stages of scientific research designing.
• as the Strut-and-Tie method does not provide an unambiguous solution, the choice of an optimal model represents an engineering assessment, following specific criteria. According to experimental tests, member W3 has shown the best behavior under load based on a comparison of crack widths and deflection values with the remaining test specimens.
Future researches will include the analysis of the optimal Strut-and-Tie models for various reinforced concrete member geometries. Since the experimental research is limited in the number of the members, presented model FEM B analysis could provide oportunity for extrapolation of data on other, untested geometries of the reinforced concrete members and reinforcement layouts.
Author Contributions: Conceptualization, A.SĆ. and A.R.; methodology, A.SĆ., M.M. and V.R.; software, A.SĆ, A.R and D.Ž.; validation, A.SĆ., A.R. and M.Š.; formal analysis, A.SĆ. and A.R.; investigation, M.M., D.K. and V.R.; resources, A.SĆ., A.R., D.K. and M.Š.; data curation, A.SĆ. and A.R.; writing—original draft preparation, A.SĆ. and A.R.; writing—review and editing, M.M, D.K., V.R., M.Š. and D.Ž.; visualization, A.SĆ.; supervision, M.M.; funding acquisition, A.SĆ. and D.K. All authors have read and agreed to the published version of the manuscript.
Acknowledgments: For the support in the realization of the experimental research, the authors are thankful to the colleagues from the Laboratory for Material and Structure Testing at the Faculty of Civil Engineering Subotica, University of Novi Sad, Republic of Serbia.
This research paper has been supported by the Ministry of Education, Science and Technological Development through the project No. 451-03-68/2020-14/200156: "Innovative scientific and artistic research from the FTS activity domain".
Conflicts of Interest: The authors declare no conflict of interest.
References
1. Schlaich, J., Schafer, K., Jennewein, M. Toward a Consistent Design of Structural Concrete. PCI JOURNAL
1987, May-June, 74-150.
2. Hwee, T.K. Design of Non-Prismatic RC Beams Using Strut-and-Tie Models. Journal of Afvanced Concrete Technology2004, 2/2, 249-256.
3. Tyler, L.M., Riding, K.A., Bae, S., Breen, J.E. Experimental Verification of Strut-and-Tie Model Design Method. ACI Structural Journal2007, 104/6, 749-755.
4. Kuchma, D., Yindeesuk, S., Nagle, T., Hart, J., Hwang, L.H. Experimental Validation of Strut-and-Tie Method for Complex Regions. ACI Structural Journal2008, 105/5, 578-589.
5. Zhang, N., Tan, K.H., Leong, C.L. Single-Span Deep Beams Subjected to Unsymmetrical Loads. Journal of Structural Engineering2009, 239-252.
6. Vollum, R.L., Fang, L. Shear enhancement in RC beams with multiple point loads. Engineering Structures
2014, 80, 389-405.
7. Giuseppe, C., Giovanni, M. Behaviour of concrete deep beams with openings and low shear span-to-depth ratio. Engineering Structures2012, 41, 294-306.
8. Moradi, M., Reza, E.M. Application of the Strut-and-Tie method for steel fiber reinforced concrete deep beams. Construction and Building Materials2017, 13, 423-437.
9. Chen, H., Wang, L., Yhong, J. Study on an optimal Strut-and-Tie model for concrete deep beams. Applied Sciences2019, 9, 3637, doi: 10.3390/app9173637.
10. Zhang, J.H., Li, S.S., Xie, W., Guo, Y.D. Experimental study on shear capacity of high strength reinforcement concrete deep beams with small shear span-depth ratio. Materials2020, 13, 1218, doi: 10.3390/ma13051218. 11. Brena, S., Morrison, M. Factors Affecting Strength of Elements Designed Using Strut-and-Tie Models. ACI
12. Maxwell, B., Breen, J. Experimental Evaluation of Strut-and-Tie Model Applied to Deep Beam with Opening. ACI Structural Journal2000, January-February, 142-148.
13. Sahoo, D.R., Flores, C.A., Chao, S.H. Behavior of Steel Fiber-Reinforced Concrete Deep Beams with Large Opening. ACI Structural Journal2012, March-April, 193-203.
14. Starčev-Ćurčin, A., Rašeta, A., Brujić, Z. The program ST method for determining the Strut-and-Tie models of RC plane members. Technical Gazette2016, 23/1, 291-300.
15. Starčev-Ćurčin, A. Optimizacija i analiza armiranobetonskih ravanskih nosača primenom metode pritisnutih štapova i zatega. PhD thesis. University of Novi Sad, Faculty of Technical Sciences 1, Trg Dositejа Obradovicа 6, 21000 Novi Sad, September 24, 2017.
16. Burns, S.A. Recent Advances in Optimal Structural Design; By the Technical Committee on Optimal Structural Design of the Technical Administrative Committee on Analysis and Computation of the Technical Activities Division of the Structural Engineering Institute of the American Society of Civil Engineers, May 3, 2002.
17. Bendsoe, M.P., Sigmund, O. Topology Optimization, Theory, Methods, and Applications; Springer EUA,
New York, 2003.
18. Kostić, N. Computer-based development of stress fields, 6th International PhD Symposium in Civil Engineering, Zurich, August 23-26, 2006.
19. Kostić, N. Topologie des champs de contraintes pour le dimensionnement des structures en beton arme. PhD thesis, No 4414. Ecole Polytechnique federale de Lausanne, Suisse, 11 Juin, 2009.
20. EN1992-1-1:2004 - Eurocode 2: Design of Concrete Structures – Part 1-1: General Rules and Rules for Buildings, The European Standard, European Committee for Standardization - CEN, Brussels, 2004. 21. Starčev-Ćurčin, A., Malešev, M., Kukaras, D., Rašeta, A., Žarković, D. Analysis and Design of RC Deep
Beam Using the "ST Method" Program, 5th International Conference Contemporary Achievements in Civil Engineering, Faculty of Civil Engineering, Subotica, Serbia, 209-218, April 21, 2017.
22. Häussler-Combe, U. Computational Methods for Reinforced Concrete Structures, Ernst & Sohn, Technische Universität Dresden, Institut für Massivbau, Dresden, Germany, ISBN: 978-3-433-03054-7, 2015.
23. SRPS EN 196-1, Methods of testing cement - Part 1: Determination of strength, Institute for Standardization of Serbia, Belgrade, 2008.
24. SRPS EN 196-3, Methods of testing cement - Part 3: Determination of setting times and soundness, Institute for Standardization of Serbia, Belgrade, 2010.
25. SRPS 933-1, Tests for geometrical properties of aggregates - Part 1: Determination of particle size distribution - Sieving method, Institute for Standardization of Serbia, 2013.
26. SRPS 933-4, Tests for geometrical properties of aggregates - Part 4: Determination of particle shape - Shape index, Institute for Standardization of Serbia, 2010.
27. SRPS 1097-2, Tests Tests for mechanical and physical properties of aggregates - Part 2: Methods for the determination of resistance to fragmentation, Institute for standardization of Serbia, 2013.
28. SRPS 1097-6, Tests for mechanical and physical properties of aggregates - Part 6: Determination of the influence of recycled aggregate extract on the initial setting time of cement, Institute for Standardization of Serbia, 2008.
29. SRPS EN 12390-2, Testing hardened concrete - Part 2: Making and curing specimens for strength tests, Institute for Standardization of Serbia, 2010.
30. SRPS EN 12390-3, Testing hardened concrete - Part 3: Compressive strength of test specimens, Institute for Standardization of Serbia, 2010.
31. SRPS EN ISO 15630-1, Steel for the reinforcement and prestressing of concrete – Test methods – Part 1: Reinforcing bars, wire rod and wire, Institute for Standardization of Serbia, Belgrade, 2010.
32. ABAQUS 2016 Analysis Users Guide, © Dassault Systèmes, 2015.
33. Lee, J., Fenves, G. L. Plastic-damage model for cyclic loading of concrete structures. J. Eng. Mechanics1998, 124(8), 892-900.
34. Lubliner, J., Oliver, J., Oller, S., Onate ,E. A plastic-damage model for concrete. Int. J. Solids Structures1989, 25(3), 299-326.
35. Arabzadeh, A., Aghayari, R., Rahai, A.R. Investigation of experimental and analytical shear strength of reinforced concrete deep beams. International Journal of Civil Engineering2011, Vol. 9, No.3, 207-214. 36. Arabzadeh, A., Aghayari, R., Rahai, A.R. A new model for predicting the effective strength in reinforced