The Development of a Computer Based Modelling Environment for Upper Secondary School Geography Classes
Terence Melvin Goble PhD
Abstract
This thesis describes the development of a specification for a computer based modelling system in geography. The modelling system will be for use in upper secondary school geography classes. The classroom approach to geography reflects the developments within the broader academic discipline. By adopting a systems analysis approach, it is possible to represent models on the computer, from the full range of geographical approaches. The essence of geographical modelling is to be able to use a computer based environment to manipulate, and create, the inter-relationships of the components of a geographical system.
The development of the specification for the modelling system, follows an eleven step methodology. This has been adapted and modified from the Research and Development Methodology. It includes a formative evaluation of the prototypes in classroom trials.
The possible forms of representation of geographical ideas on the computer are considered. Procedural and declarative models are developed, as prototypes, on a range of software tools. The software tools used, for the initial developments, are the Dynamic Modelling System, spreadsheets and the language, Prolog. The final prototype is developed in a Smalltalk environment. Consideration is also given to the use of both quantitative and qualitative methods of modelling.
CONTENTS Page
Acknowledgments 16
CHAPTER ONE - INTRODUCTION
Introduction to the Thesis 17
The Definition of Modelling 19
The Study of Modelling 20
The Educational Context of the Research 22
The Facilitation of Learning in the Classroom 22
Relationship to the Development of Computer Assisted Learning 24
The Objectives of the Research 25
CHAPTER TWO - REVIEW OF LITERATURE
PART ONE - MODELS IN THE DEVELOPMENT OF GEOGRAPHY
Introduction 27
The Sub-Divisions of Geography 27
The Synthesising Approach to Geography 33
The Ecosystems Approach to Geography 34
The Values Approach to Geography 36
The Methods and Tools of Geographical Analysis 37
Systems Analysis in Geography 43
The Nature of Models 53
The Purpose of Models 55
Modelling Paradigms 55
The External Perception of Models 56
PART TWO - THE REPRESENTATION OF LEARNING MATERIAL
Introduction 58
The Foundations of the Representation and Inference Methods 58
The Development of the Foundations 61
Applications of Representation and Inference Methods to Computer 63 Based Education
PART THREE - THE CURRENT ASPECTS OF EDUCATIONAL MODELLING
Introduction 67
Model Identification and Structure 67
The Interaction Between the User and the Computer Based Model 76
Teaching Using Models 86
Conclusion 96
CHAPTER THREE - THE RESEARCH METHODOLOGY
PART ONE - THE RESEARCH AND DEVELOPMENT METHODOLOGY
Introduction 98
Evaluation in the Research and Development Methodology 103 The Structure of Questions for Formative Evaluation 106
Planning Evaluation Activities 108
The Stages in the Research and Development Methodology 110
Prototypes 118
PART TWO - THE ADAPTATION OF THE RESEARCH AND DEVELOPMENT METHODOLOGY
Introduction 120
The Adaptation of the Methodology to this Research 121 The Formative Evaluation Model for Data Collection 125
CHAPTER FOUR - DATA COLLECTION
STEP ONE - CURRENT REVIEW AND INFORMATION SEARCH
Purpose of the Product 127
Review of Current Classroom Use of Computers 127
The Scope and Content to be Covered by the Product 129
The Critical Design Issues 130
The Value of the Product 131
STEP TWO - IDENTIFICATION OF NEEDS
Target Audience 132
Relationship Between the Target Audience and the Content 132
Setting for the Use of the Product 132
STEP THREE - THE IDENTIFICATION OF THE SOFTWARE TOOLS
Software Tools Available in the Classroom 133
Software Tools Generally Available 133
STEP FOUR - DATA COLLECTION : INTERVIEWS WITH THE TARGET AUDIENCE
Introduction 136
The PUDDLE Interviews 137
The DMS Interviews 147
STEP FIVE - THE GENERATION OF THEMES AND GEOGRAPHICAL IDEAS
The Selection of the Themes 153
Developments within the Selected Modelling Bases 153 A Simple Rule Based Expert System in Geography 153
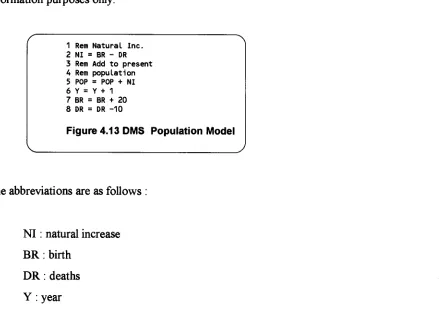
The Dynamic Modelling System 164
Spreadsheet Modelling 167
Prolog Modelling 174
STEP SIX - EVALUATION OF THE THEMES AND SELECTION OF THE PROTOTYPE
Introduction 190
Viewing the Internal Structure of Models 190
The Range of Geographical Models 190
The Developmental Complexity of a Computer System 191
Selection of a Prototype 191
STEP SEVEN - DATA COLLECTION : THE PROTOTYPE WITH THE TARGET AUDIENCE
Prolog Classroom Trial 192
STEP EIGHT - CONSOLIDATION OF DESIGN
Introduction 209
Issues for Inclusion in the Final Prototype 209
STEP NINE - PROTOTYPE METHODS AND CONTENT
Introduction 210
Village Population Growth 210
Slope Infiltration 212
Regional Location of Industry 215
General Industrial Location 217
STEP TEN - DATA COLLECTION : PROTOTYPE WITH TARGET AUDIENCE
Introduction 221
Manipulation of Existing Models 221
The Application of a Model Template to a New Area of Geography 231
Coastal Land Model 234
Suitability of Land for Nuclear Waste 237
Effect on Ecosystems 239
Smalltalk Questionnaire 242
STEP ELEVEN - PRODUCTION OF PROPOSAL FOR FINAL PRODUCT
Purpose Design Criteria
Representation Methods
Interface Components 249
Development Examples 249
Description of Input Forms 251
Output Description 252
CHAPTER FIVE - SUMMARY AND DISCUSSION
Introduction 253
Brief Restatement of Problem 253
Description of the Main Features of the Method 254
Principal Findings 254
Conclusion about Findings 256
Discussion of the Study's Methodological Limitations 263
Implications of the Research 264
Future Developments 273
Conclusions on Application of the Research to the Classroom 273
GLOSSARY OF TERMS 276
REFERENCES 280
FIGURES AND TABLES
CHAPTER ONE Page
Figure 1.1 Student-Tutor Model 24
CHAPTER TWO
Figure 2.1 The Structure of School Geography 29
Figure 2.2. Historical Development 32
Figure 2.3 Synthesis 33
Figure 2.4 Geography and the Environment 35
Figure 2.5 Realist Explanatory Model 36
Figure 2.6 Comparison between Traditional Method and 41 Scientific Method in Geography
Figure 2.7 Reasons for the Sahel Catastrophe 47
Figure 2.8 A System and Its Environment 50
Figure 2.9 Stages in Problem Solving 69
Figure 2.10 Causal Diagram of Common Elements in an 71 Economic Demographic Model
Figure 2.11 Reference Structure for Economic Demographic 73 Model
Figure 2.12 Basic Modules of Forrester's Simulation Language 76
Figure 2.13 Design Components 78
Figure 2.14 Minimum Resources for Model of Human Problem 79 Solving
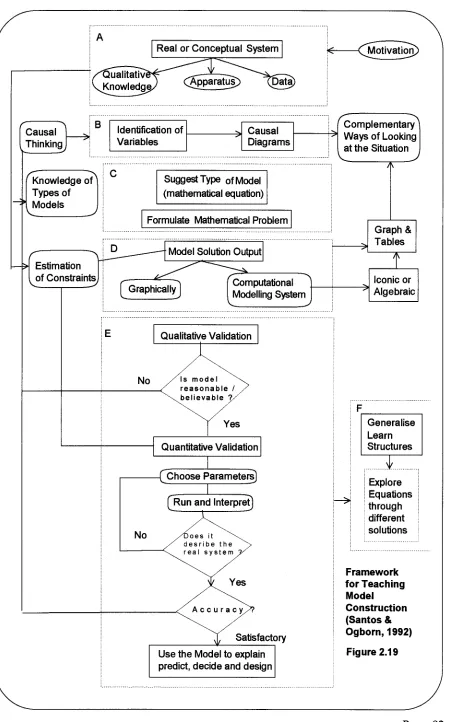
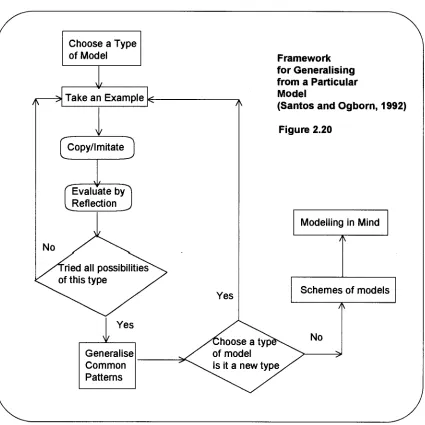
Figure 2.18 The Mathematical Modelling Process 91 Figure 2.19 Framework for Teaching Model Construction 92 Figure 2.20 Framework for Generalising from a Particular 93
Model
CHAPTER THREE
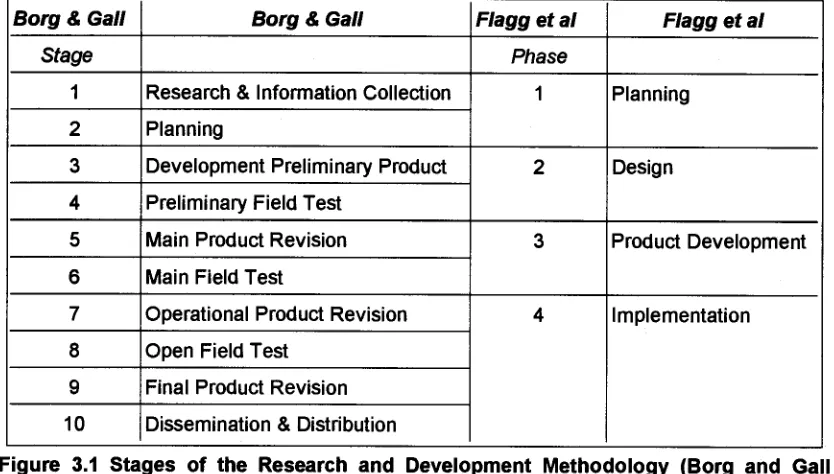
Figure 3.1 Stages of the Research and Development 111 Methodology
Figure 3.2 Adaptation of the Research and Development 122 Methodology
CHAPTER FOUR
Figure 4.1 Inputs to the System 156
Figure 4.2 Materials Entry in Prolog 156
Figure 4.3 The Outputs from the System 157
Figure 4.4 The Outputs from Prolog 157
Figure 4.5 Explanation of Position 158
Figure 4.6 Explanation of Management 158
Figure 4.7 Student Estimated Answers 158
Figure 4.8 Students Answers in Prolog 159
Figure 4.9 Differences between Student and System 159 Figure 4.10 Data Flow Diagram of Industrial Location Expert 161
System
Figure 4.11 Decision Table for Transport 162
Figure 4.12 Prolog Statement for Transport Process 162
Figure 4.13 DMS Population Model 165
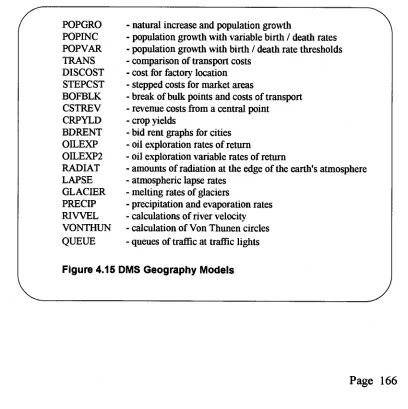
166 170 171 172 173 173 177 177 177 178 178 178 179 180 181 181 182 182 183 183 184 184 185 185 185 186 Figure 4.15 DMS Geography Models
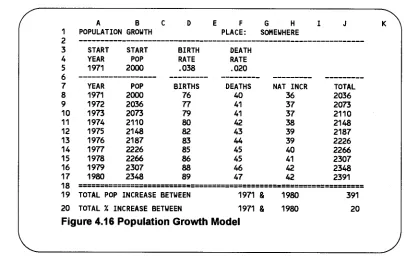
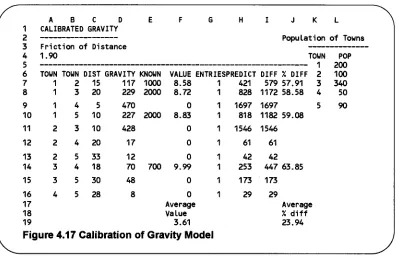
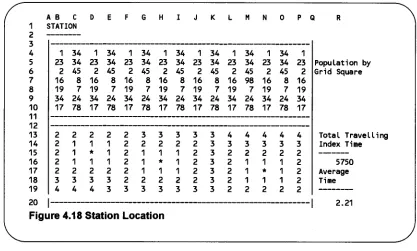
Figure 4.16 Population Growth Model Figure 4.17 Calibration of Gravity Model Figure 4.18 Station Location
Figure 4.19 Meteorological Lapse rates Figure 4.20 A Range of Spreadsheet Models Figure 4.21 Section I - Population Growth Figure 4.22 Section II - Population Growth Figure 4.23 Section III - Population Growth Figure 4.24 Section IV - Population Growth Figure 4.25 Section V - Population Growth Figure 4.26 Section IV - Population Growth Figure 4.27 Range of Procedural Models in Prolog
Figure 4.28 Data Flow Diagram for New Industrial Location Figure 4.29 Initial Decision Structures - Industrial Relocation Figure 4.30 Intermediate Decision Structures - Industrial
Relocation
Figure 4.31 Final Decision Structure - Industrial Relocation Figure 4.32 Prolog Statement for Process Boxes
Figure 4.33 External Events - Sahel Model Figure 4.34 Causal Diagram - Sahel Domain
Figure 4.35 Endogenous Relationships - Sahel Domain Figure 4.36 Prolog Model for Sahel Domain
Figure 4.37 Decisions Structure - Disease Figure 4.38 Water Decision Structure
Figure 4.39 Output from Model - Sahel Domain
187 187 188 188 189 196 201 202 202 203 203 204 204 205 205 206 206 210 212 214 216 218 219 219 220 226 226 Figure 4.41 Pupil Model
Figure 4.42 Teacher Model Figure 4.43. Explanation Template Figure 4.44 Output from Student Model Figure 4.45 Explanation of Differences Figure 4.45 Drainage Processes
Figure 4.46 Initial Statement Population Model Figure 4.47 Students' Initial Statements
Figure 4.48 Data Entry - Population Model Figure 4.49 Students' Data Entry
Figure 4.50 Reference Statements
Figure 4.51 Students' Reference Statements Figure 4.52 Population Model
Figure 4.53 BANAN Drainage Model Figure 4.54 LIZALI Drainage Model Figure 4.55 WATER2 Drainage Model Figure 4.56 WATER1 Drainage Model Figure 4.57 Village Population Growth Figure 4.58 Slope Infiltration - Set Up Figure 4.59 Slope Infiltration - Output Figure 4.60 Regional Location of Industry
Figure 4.61 Question Prompts for Industrial Location Figure 4.62 Outputs from Industrial Location Model Figure 4.63 Changing Individual Values
Figure 4.67 Village Population Group RM 226
Figure 4.68 Village Population Group ST 226
Figure 4.69 Developed Country Model 227
Figure 4.70 Developing Country 228
Figure 4.71 Slope Drainage KE Group 229
Figure 4.72 Slope Drainage JT Group 229
Figure 4.73 Slope Drainage RM Group 229
Figure 4.74 Slope Drainage SS Group 230
Figure 4.75 Slope Drainage ST Group 230
Figure 4.76 Input Factors - Coastal Land Model 234 Figure 4.77 Decision Structure for Input Values - Coastal Land 235
Model
Figure 4.78 Intermediate Decision Structure 236
Figure 4.79 Final Decision - Coastal Land Model 236
Figure 4.80 Examples for Coastal Land Model 236
Figure 4.81 Examples for Nuclear Waste 237
Figure 4.82 Suitability for Nuclear Waster 238
Figure 4.83 Intermediate Decisions - Nuclear Waste 238
Figure 4.84 Final Decision - Nuclear Waste 239
Figure 4.85 Effects on Ecosystems 239
Figure 4.86 Intermediate Decisions - Ecosystem 240
Figure 4.87 Final Decision - Ecosystems 240
Acknowledgments
CHAPTER ONE - INTRODUCTION
Introduction to the Thesis
This thesis illustrates the stages in the design and development of a geographical modelling system prototype. The modelling system encompasses a wide range of geographical examples taken from the systems approach to geography. The target for the use of the system is the geography classes of the upper years of secondary education. Emphasis in the development is placed on the manner in which geographical examples may be represented in the modelling environment.
Chapter One defines modelling in the context of educational software systems and introduces the ways in which information and knowledge may be represented in educational software. The justification for the study of modelling as a research topic is then discussed. The research work is then placed in the context of current educational practice. First, in terms of the use of Computer Aided Learning (CAL) in the classroom, and secondly, in the classroom application of computer systems to geographical education.
Chapter Two reviews the literature in the area of the investigation by addressing two principal themes. First, the evolution of the systems approach in geographical education is related to developments within the discipline of geography. The second principal theme considers the development of modelling. This theme draws out significant milestones in the representation of ideas on computers and the reasoning mechanisms that are used by computer based systems to derive conclusions. Particular emphasis is placed on the links between simulation and modelling. The final section of Chapter Two draws together the state-of-the-art developments, by linking the status of geographical ideas, with the representation and reasoning methods available with modern software systems.
methodology used by other projects are also given. The second section identifies the adaptation of the methodology for this research. The methods of data collection and analysis are given within the overall framework of the Research and Development Methodology. The third section of Chapter Three explains the details and contents of each of the steps within this research. These steps include the planning of the development, the necessary decisions that were identified along the way, as well as the identification of the areas in which data collection was required.
Chapter Four details the findings from the four classroom based activities, the data for which was collected in a variety of ways including video, open interviews and student logs. Each activity is described in terms of specific objectives. The details of the students and their backgrounds are also stated. The amount of teacher involvement is also described. For each session a description of the results is presented, followed by an analysis of the collected data. The results are placed in the context of the development of this research and are also related to the broader area of geographical education.
Chapter Five has a brief summary of the research and then discusses the results and their implications. Conclusions are drawn from the findings of both, the intermediate data collection, and the work completed with the prototype of the product. In keeping with the overall context of the research, discussion of the specification for the product is also included. A discussion of the methodological limitations and difficulties that arose in the execution of the study is then presented. The last section of Chapter Five addresses the implications of using the final modelling product with upper school geography classes. Opportunities for further research, that have been identified as a result of developing the specification for the modelling environment, are given at the end of the chapter.
The Definition of Modelling
Modelling in a broad sense may be defined in several ways : 1. " to frame a theory of a structure "
2. " to give shape to an immaterial object or argument" 3. " to plan "
4. " to bring to a desired or desirable form or condition "
(OED, 1979)
These definitions have formed the basis of modelling for geographers. Skilling (1964) suggested that models could be a theory, law, an hypothesis or a structured idea. Within these suggestions the model could take the form of a rule, relation or equation. Chorley and Haggett (1967) state that a model is a simplifying structure of reality that presents supposedly significant features or relationships in a generalised form. Meadows and Robinson (1985) concur with a view that a model is a set of generalisations or assumptions about the world.
Nichol (1988) identifies the essence of modelling in the humanities as the identification and abstraction of the determining elements and their relationships. He adds, the identification of the relationships in analogous situations, leads to the principle of generalisation. He suggests that a model within the humanities will normally contain the elements of time and place, that are then associated with various objects. The objects may be things, animals, features or people. The relationships may be described as the interaction between the objects.
the interpretation procedures. If these procedures are used appropriately, they will lead to knowledgeable behaviour. Data structures indicate the characteristic attributes of each element within the domain, for example, the locational and temporal properties of a geographical feature.
The Study of Modelling
The justification for the study of computer based geographical modelling in education may be given from two perspectives. First, it can be argued that modelling may give an increased facility for the student to be involved in problem solving. Second, that during a problem solving process there is the potential for the student to derive more creative solutions.
Webb and Hassell (1988) argue that computer based modelling offers a number of opportunities for the enhancement of learning. Children can construct, test and evaluate concrete representations of their own mental models. Weeb and Hassell
base their hypothesis on Kelly (1955) and Osborne and Wittock (1985) who suggest that, when learning a new concept, the learner forms a model in their mind. This model is then assimilated into the learner's overall framework by establishing links with other concepts. Such a theory of learning is 'constructivist' and has been strongly argued in the educational environment by Piaget (Magoon, 1977).
Ginsberg (1985) suggests that a fundamental requirement for learning is an active engagement and commitment in manipulating thoughts. Studies reviewed by Carroll (1984) which investigated user interfaces for novice computer users, suggest that such learners prefer an active role. They prefer, as a learning strategy, to initiate problem solving as opposed to performing conventional rote drill and practice exercises.
Millwood et al. (1987) argue that modelling activities may help learners in three ways. First, they may help both learners and teachers to recognise each other's mental models of processes and problem solving. Second, when the user builds a model and tests it, then the results may be used to evaluate their models. Finally, a modelling system offers the chance to publicly express and share models with others. Various other authors have deemed that problem solving by model building is an appropriate method for developing understanding. Emphasis has often been placed on mathematical models, but many of the application areas for these models are in geography. For example, the modelling of traffic flow through the Humber Tunnel, James and McDonald (1981) and the travelling time to school, Close (1985).
Thus, Ridgway argues for greater transparency of the knowledge base. A consequence of which, is the need for the facts and rules to be made into a form that is accessible to the user.
Technology in the National Curriculum, DES (1990B) states that Information Technology can enhance teaching, by first, making learning more practical, and second, by giving access to new experiences. The document expresses the view, in the section on modelling, that pupils should be able to speculate about appropriate outcomes to models. They should therefore be able to move on and examine the consequences of using complex models. The document further argues that modelling can help to underpin the continuity and progression in the National Curriculum for Information Technology. This can be demonstrated, first, by moving from familiar to unfamiliar problems and, secondly, by applying the more advanced skills of developing new ideas and thereby, communicating information in a coherent form.
The Educational Context of the Research
This research has been developed within an educational context that may be viewed from two perspectives. The first perspective is the various ways in which computers have been used in the classroom to facilitate learning. The second perspective is the relationship between geographical modelling and the development of Computer Aided Learning (CAL) in geography classrooms.
The Facilitation of Learning in the Classroom
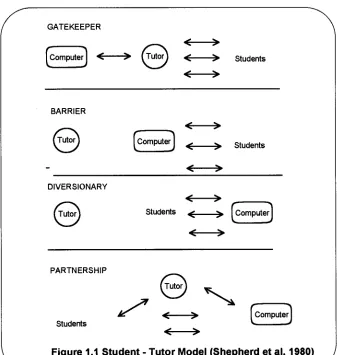
revelatory paradigm, is when a data store is used for the rapid retrieval and manipulation of information. The data may be spatial, non-spatial or a combination of the two. Examples of this paradigm include SYMAP for computer mapping, NEIGHB for spatial summaries, CORR for non-spatial correlation coefficients and QUERY for information retrieval. The third paradigm, conjectural, is when the computer is used to run simulations. These may be prescriptive, LIMITS, descriptive RUNOFF, or a game POVERTY. Kent (1985) argues that these methods of data analysis and exploration remove time consuming and mentally undemanding activities. This allows the students to concentrate on the discussion of results and the drawing of conclusions. The final part of the classification, the emancipatory paradigm, is when the student constructs a program to solve a particular problem in the geographical domain. Abbott (1980) suggests that the boundaries of the four paradigms are blurred, and that there is a continuum from instructional to emancipatory. The latter allows the student more ability to control learning, and therefore to be able to make more learning decisions. In addition to the fourfold classification of the student centred approach, Shepherd et al (1980), also suggest that the computer may be used in a teacher centred approach. Examples of this approach include both, glass box programs and electronic blackboards such as DEWDROP. The distinction between the student centred and teacher centred approach was further developed by Shepherd who proposed a model of student, teacher and computer. This model has four divisions, the gatekeeper, the barrier, the diversionary and the partnership, Figure 1.1.
GATEKEEPER
Computer
1/4 H Students
BARRIER
<->
Computer Students
DIVERSIONARY
Students <>Computer ■ .■
PARTNERSHIP
[Computer Students
Figure 1.1 Student - Tutor Model (Shepherd et al, 1980)
Relationship to the development of CAL
The second perspective of the relationship, between the development of the research and the educational context, focuses on how modelling relates to the development of CAL programs in geography. The original links between geography and computers can be traced to three projects, the National Development Programme in Computer Assisted Learning, (NDPCAL), the Geographical Association Package Exchange (GAPE) and the Computer Assisted Learning in Upper School Geography Project (CALUSG).
programs that were based on simulations and the manipulation of input parameters. Many of the simulations were in the form of games, for example, the mapping of market areas in MILL, which calculated the costs for various locations of windmills. Other similar styles of software accompanied the GYSL NELCAL (1983). Decision making simulations accompanied People on Earth, Robinson and Jackson (1984). The geographical process of locating a factory was developed by ITMA, and was called TRANSPOTS, (1982). Freeman (1981), in a study of Hertfordshire Schools, identified the most popular programs to be PEOPLE, HURKLE, RAIL, ROUTE, QUERY and NEIGH.
The Objectives of the Research
The development of modelling has followed from the range of computer based learning activities that have been identified above. In the early to mid 1980s, the computer became established in the classroom as a method for the facilitation of learning. This led to the identification of the objectives of this research which are :
• to investigate the underlying structure of geographical problems and to determine how they may be openly represented on the computer
• to demonstrate that a range of geographical models can be implemented in a computer based modelling environment
• to show that students can utilise a computer based modelling environment in geography lessons
• to indicate ways in which access can be given to model construction and model manipulation on a computer based system
CHAPTER TWO - REVIEW OF LITERATURE
PART ONE
-
MODELS IN THE DEVELOPMENT OF GEOGRAPHYIntroduction
During the 1960's there was the beginning of a widespread adoption of a new paradigm for geography. The new paradigm, often called the quantitative revolution, became established in academic geography in the early part of the 1970s and became a significant movement in school based geographical education. From that time academic geography has continued to strongly influence school geography and many teachers became aware of activities in the research frontier of the subject, Robinson (1985). The systems approach to geography, which is a major step in the development of models, was part of the development of the new methods and tools that were associated with the emerging paradigm.
The Sub-division of Geography
Ambrose (1973) identified four main themes in geography that are relevant to geographical education in schools. The four themes are :
• the identification of the various sub-divisions of geography and the nature by which they are interlinked
• the development of a conceptual structure from the prevailing factual basis • the emerging importance of values and the identification of subjective and
objective knowledge
• the methods and tools that can be used to draw valid geographical conclusions
specialists ... to ponder carefully Mackinder's remarks on the unity of the whole subject."
Graves (1975) points out the controversy alluded to by Long and Roberson is concerned with how regional geography is defined. Areal differentiation and its associated positions, was rejected by research workers who wished to employ the analytical and predictive techniques previously developed in the social sciences. However, Graves continues that the functional region is still an important integrating concept in geography. When investigating spatial organisation systems, ecosystems, and complex regional systems, the concept of formal regions is a useful way of classifying areas required for specific purposes by planners and research workers.
Further criticisms of the traditional approach to geography are given in "New Thinking in Geography", DES (1972). First, by emphasising the uniqueness of each area, the traditional method depends largely on memorisation, because it lacks a sufficient framework of general concepts. The second criticism focuses on the failure of the regional approach to differentiate between significant and irrelevant materials. This is caused by a stereotypic approach to all issues. Third, it fails to demonstrate many of the similarities that exist over wide areas of the earth's surface. And finally, it presupposes that valid boundaries may be drawn around regions of a multi-functional character. The report also adds that the regional approach accepts vague generalisations when analytical techniques are available to provide greater precision and may even yield possibilities for predicting future events. To replace the traditional view a methodological model is suggested. Figure 2.1
The Real World
Elements in Geography
Classification Unique Relationships
Concepts
Models & Theories
V Systems
The Real World
Structure of School Geography
(DES 1972) Figure 2.1
Fitzgerald (1973) accepts Beddis's general position about fundamental concepts, but suggests a systematic rather than an area based approach. He considers it possible to select a number of systematic topics, identify the principal concepts, and build them into a matrix of different concepts with varying levels of difficulty.
Boden (1976) identified the move, from regionalisation to systematic studies, in terms of a two fold subdivision of academic geography. The two divisions are physical and human. Within each of these he identified the particular traits that diffused into school geography. The physical geography, associated with description and the Davisian model, was superseded by the new methods and tools approach of Chorley and Haggett (1967). Within human geography the descriptive rational economic man approach was gradually replaced with man as decision maker with imperfect knowledge.
was a rise in Applied geography, the school oriented version of which can be found in such projects as the 16-19 Project, Naish (1976,1985). The focusing on topics, also led to a more disciplinary based approach, including not only geography, but aspects of other social sciences. Boden (1976) indicates that a characteristic of the whole trend was the move away from determinism, to the field of geographical enquiry where man was the principal focus. A further development, allowed by the systematic approach, was that of concentric studies and the concentric curriculum. The different scales used were local, national and global as in the 14-18 Project, Schools Council (1978), Tolley and Reynolds (1977) and Orrell (1985), and Geography in the National Curriculum, DES (1991).
The systematic approach to geography was gradually introduced into the school curriculum. The DES (1974) survey identified three principal approaches to geography, the conceptual approach, the systematic approach, and the regional approach. The survey gave the following percentages of the type of geography curriculum in the schools :
18% - conceptual 23% - systematic 46% - regional
In addition to the regional and systematic approaches, a third view of geography focused on concepts or central ideas, that are at the heart of the discipline. Ambrose (1973) identifies that much of geography involves studying repeating patterns of spatial distribution. Such distributions have significant regularities in time and space. These can then be mapped, explained and future circumstances predicted. Ambrose argues that geography should make explicit such processes rather than implicitly assuming them as part of an underlying description.
location, the probability of other events occurring nearby is either increased or diminished. This principal emphasises the cumulative and dynamic processes of space and time.
Boden (1976) states that most geography lessons have a common purpose that reflects the literal meaning of the word geography. The lessons describe and attempt to explain the locational nature of the features at or near the earth's surface. Abler et al (1971) state questions about location, spatial structure and spatial process distinguish geography from the other sciences.
Boden (1976) identifies various sub-divisions of conceptual studies based on the clarity of terms, that can be clearly qualified and related to each other. For example, relief slope distribution is a conceptual term that can be qualified with actual measurable values. Theories are, according to Boden, an attempt to understand the more complex conceptual ideas. They can be developed in two ways. First, by starting with real life and constructing a hypothesis that can be tested by the collection of data. From the data a generalisation can be constructed and a theory evolved. The second approach is to begin with a normative theory, based on what ought to be, and then to investigate the real world to substantiate the theory. He cites the examples of 'busiest places', which may be approached by either manner, and which can lead to central place theory.
Chorology
Description
Determinism
Spatial Process Systems Deterministic Stochastic
Analysis Models Analysis Models Models
Historical Development Figure 2.2 (Holt-Jensen, 1988)
1750 > KANT
1800 > RITTER
1859 > DARWIN
1870 > PENCK-DAVIS (geomorphology)
1880 > RATZEL (determinism)
1890 > VIDAL (possibilism) (regional geography)
1927 > HETTNER HARTSHORNE Philosophy of CiaollfaPhY
1930 > Landscape Geography
1950 > Quantitative Geography
over time (process) Development
Nomothatic V (develop
V V
laws)
V Inductive
V Methods Deductive Methods approach 'whole Teleological
V V
V V
(development guided Laws)
by God(
Indeternin
V V V V
V
V V
V (unique) Ideographic V V Use of regional V ‘41 V synthesis
V \
V V V 1
/ V V V V V V V \
Is and generalise, in a visual way, spatial relations and variations. Also developed were aspects such as spatial literacy, which gave the ability to understand spatial implications. Consideration was also given to the results of interacting variables, such as, the supply and demand of a variety of consumer goods and services across an area or landscape. The assessing and defining of relationships numerically is now prominent in geography at all levels. Such numerical models, as Huff and Reilly, are functional explorations significant to geographical studies, for their spatial consequences. "The gain in spatial literacy has been important and worth while and should not be misunderstood" Slater, (1982).
The
Environmental Challenge
Regional Mosaics
Interregional Stresses
Synthesis (Haggett, 1983) Figure 2.3
Man Environment Ecological Systems
Human Ecological Response
Regional Hierarchies
Regional Interregional Spatial Systems
conceptual geography. Attainment Target One, entitled Skills, addresses the skills of spatial literacy that were identified under the conceptual approach. The systematic approach to geography can be aligned with the Attainment Targets for Physical and Human Geography. The Attainment Target of the Knowledge and Understanding of Locations, addresses the regional perspective, with the final Attainment Target, Environmental Geography, considering the ecosystems approach.
The Synthesizing Approach to Geography
A view that geography is a synthesizing subject has always been basic to the philosophy of the discipline. Holt-Jensen (1988) indicates that throughout the history of Geography there have been various pioneers who have sought to synthesize aspects of the subject, Figure 2.2
not separate but overlapping. The five parts are like the atoms in a molecular chain. The internal structure and linkage between them, and between the outer two systems can be explored. The five circles are superimposed on the two outer systems, Figure 2.3. Johnson (1985), Taylor (1985), Bennett (1985), and others envisage a future for holistic geography with physical-human relations at the core.
Ecosystems Approach
Holt-Jensen (1988) points out that formalised systems theory has only been directly applied to geography since the paradigm shift. However, systemic thinking has been closely associated with a functional analysis viewpoint, where geography has been viewed as human ecology. The development of systems ecology led to the concept of the ecosystem. An ecosystem consists of the biological community at a specific place and the environmental and physical circumstances that influence, and are influenced by, that biological community. The most critical aspects of the ecosystem are the circulation function, and the nature of change and development of the ecosystem. The facility to investigate vastly different scales of ecosystems, ranging from a puddle to the globe, has been an attractive feature of this approach. Holt-Jensen (1988) suggests that one of the most significant results of the study of ecosystems has been the models of circulation that have been developed and described, e.g. the nutrient cycle.
Figure 2.4 Geography and the Environment
(Kirk, 1963) Behavioural environment Phenomenal environment Organic processes and products (including human populations) Inorganic processes products Awareness of environment Changing knowledge of man's natural environment
--1
Sequent occupanceof environments
Man as an agent of environmental change
Geographical environment
Physical relics of human action
Natural Phenomena Development of geographical ideas & values
_1
Cultural environs of geographical ideas Socioeconomic processes & changing environmental valuesEmpirical Results Actual
Decisions Real
Mechanisms
Creative Activity by Actors or Agents and direct effect through Laws of Natures
Actor's Interpretation
Realist Explanatory Model (Holt-Jensen, 1988) Figure 2.5 Actors
7 Natural laws
Ideological Structure
Physical > Environment
(Landscapes Natural resources Pollution)
Sociogeographic Structures (way of life) Economic Base
The Values Approach to Geography
Systems analysis has been applied to, the combination of social and technical change, and economic development. Within these systems humans have had a more central role. This has led to systems with stronger feedback loops and the identification of controlled systems. Controlled systems, based on spatial implication principles, adopt a more behavioural approach to human actions. Humans make decisions in an environment that is perceived in an imperfect and fragmentary way. Such perceptions can result from varying motivations towards the immediate environment.
encourage pupils to interpret, evaluate and criticise their environment. Pupils are asked to make personal responses and to consider the values and attitudes that accompany their responses. A humanistic thread is apparent in the modules of the Geography 16-19 Project, Naish (1976,1985). In the Guiding Concepts "Evaluation and Prescription", the questions 'how ought' are posed, with such issues being addressed as the quality of life, welfare, conflict and planning. Robinson (1985) saw the growth of humanistic geography to be more explicitly linked to its philosophical roots rather than spatial analysis. He suggests the majority of classroom work derives from the study of the local area and from pupil's own experiences. Humanistic geography adds a dimension to studies by bringing classroom learning into the 'real' world of pupils' experiences and minds.
The second theme identified by Boardman (1985) is welfare geography, that analyses space, often using quantitative techniques. The resulting patterns of geographical variations are employed to raise issues of justice and equity, Coates et al (1977).
The third theme is behavioural geography. This focuses on the behaviour of individuals and the ways in which they respond to the stimuli provided by space and place, Gold (1980). Lowenthal (1973) identified the interests of the individual in the environment, with motivation being the central concern, and the study of value judgements therefore becomes significant. In economic geography Wolpert (1964) introduced the optimiser and satisficer concepts of 'economic man'. Optimisers correspond to 'economic' man whilst the 'satisficer' are anxious to succeed but not to the exclusion of other considerations. Robinson (1985) considers that some of the many decision making exercises, found at all levels of school geography, were inspired by the behaviourists.
The Methods and Tools of Geographical Analysis
Harvey (1969) identifies six recognisable forms of scientific explanation in geography. The six forms are:
• temporal modes of explanation • functional and ecological analysis • systems analysis
Cognitive description is the simple description of what is known from an ordering and classification of data that has been collected. Harvey argues this is the lower order of explanation. However, he does concede that advocates of hermeneutic methods in the humanistic schools of thought, often stress cognitive description. The quality of explanation, when using cognitive description, owes more to depth of cognition rather than technical procedures.
Morphometric analysis is a special form of cognitive description where systemisation and classification develop from a geometric and spatial co-ordinate system. This form of explanation permits network analysis so that predictive and simulation models are possible.
Cause and effect analysis is the identification of the principal aspects that can explain observed phenomena. Causal laws may be discovered by the hypothetic-deductive method. Complex cause and effect explanations may be built using multiple regression and factor analysis. The causality laws may be strictly deterministic or can include probability.
The addition of temporal modes to the cause-effect explanation provides scientific procedures for describing or explaining phenomena in relation to their development over time. The analysis of events and possible states of phenomena contribute to these explanations.
range of phenomena, has a specific purpose and the individual phenomenon must be understood in the context of the whole. The methodological strength of functionalism, lies in the support of the reciprocal relationships and conditions, that comprise the feedback mechanisms in complex systems or organisational structures. However, a functional explanation is not a sufficient condition for explanation, as it may be only one of many possible functional associations, thus it may demonstrate what is necessary not what is unique.
One critical feature of the paradigm shift in geography was the introduction of new methods for arriving at sound geographical conclusions. The last of Harvey's (1969) six forms of scientific explanation is systems analysis. Proposals to use systems analysis in geographical explanation developed in the 1960's and early 1970's and were based on the use of general systems theory in geography. Chorley (1973) observed that the applications of systems analysis to geographical explanation was greeted by some as a conceptual breakthrough and by others as a jargon ridden statement of the obvious.
as the main purpose of geography was rejected. He argued that the quantitative methodology could be adapted to a wide range of situations that geographers conventionally investigated. Even if laws were not derived, with this approach, there was at least the development and evaluation of theory.
Newby (1985) argued that geography needed to be presented in schools as an organised entity. However, Ambrose (1973) points out the spatial and scientific aspects of the 'new' geography, encouraged some paradoxical elements into the development in school geography during the 1970s. The style of enquiry that is most appropriate for the study of economic processes and patterns takes place at a scale that submerges the individual human elements. Conversely, the educational requirement of concrete experiences, led to the emphasis of field work and local geography. Slater (1982) points out that in schools, as a result of the introduction of the scientific aspects of geography, there was an increased thinking about such matters as changing land use. This was considered in relation to the cost of rent or accessibility to markets. Robinson (1985) adds that the techniques accompanying the new approach became a dominate feature of 'A' level work and cites examples of Tidswell (1976) and Everson and Fitzgerald (1969). Fitzgerald (1973) summarises the changes, when he gives the diagram that compares the traditional method and the new scientific method. Figure 2.6
Analysis of individual - usually concerning specific places
(so called 'traditional'
approach to Geography)
Spatial information concerning distributions on earth's surface
Development of 'hunch' concerning relationships - a preliminary search for order and pattern
Selection of data (to cut out noise) and recording (on maps data tables etc)
The further analysis of pattern of distribution
V The development of hypothesis reducing the problem to a relationship between two or more variables
Process of generalisation Creation of model
Testing or Prediction
Comparison between Traditional Method and Scientific Method in Geography
Figure 2.6 (Fitzgerald 1973)
were all paper based but the more widespread availability of the computer saw many of them become computerised. Walford identified four styles of games that were available. First, role playing exercises that were informally designed models and were often based on decision making. These gave rise to the many decision making techniques introduced into the school curriculum. The second group is the mathematical models that were often Monte Carlo based, and took the form of diffusion exercises. The third of Walford's groups was the individual exercises, such as the location of towns, with often opposing groups giving decisions and justifications. The final group of games were the operational games of running rival companies to secure profits.
Fitzgerald (1973) concludes his discussion of the various tools available to the geographer by stating that the real task of the geographical analyst is to reach a better understanding of how man is organising himself in space. In some cases this is to help produce more rational, efficient and socially desirable land use patterns by the planning profession. The tools of the trade are essential elements in reaching this understanding, but they should not constitute the direction of advance or the ultimate aims of geography.
From the characteristic methods outlined, Hilton (1982) derives implications for school geography. The contraction of the area of study has resulted in data based activities principally focusing on enquiry based learning. The quantification trend is the simplification of the core components of measurement within academic geography. The issues of physical and human time scales, he indicates, are addressed by the ecosystems approach and cites the various scales and opportunities offered by the hydrological cycle. The final aspect of process he considers to be the links between the human and physical aspects of the subject and these are typified by the 16-19 project, Naish (1976,1985).
Systems Analysis In Geography
Introduction
Systems analysis is a strategy for extracting relevant information from a part of reality and modelling it to produce an analytical description that highlights certain features. A model or abstract view is constructed, this can then be compared with reality, and if a successful match is identified, it can be used to predict the evolution and development of the real system. Initially the system is described, and consideration is given, to the nature and purpose of the models that will represent the real system.
During the late 1960's, in conjunction with the beginnings of the new mathematical and methodological methods, arose the need for a framework to give an overall structure to geographical investigations. The systems approach quickly emerged as one of the most appealing candidates, White et al (1984). Harvey (1973) noted that there was a very close connection between the strategy of systems analysis and the general attempt to analyse the complex systems of geography. In particular the strength of systems analysis lay in its ability to deal with phenomena that were highly interconnected. As geography had a strong multivariate basis, the systems framework offered a sound basis for description and analysis. Johnson (1983) states that both conceptual and technical issues could be resolved by adopting a systems approach. He argued that such an approach is based on a positivistic view of science and could be reasonably applied to the theory, modelling and complexity of the human world.
The Definition of a System
There is a variety of definitions of a system. Hall and Fagan (1956) suggest " a set of elements, together with the relations between the elements and among the states". Huggett (1980) chooses a more simple form," a system is a set of interrelated parts". Hagget (1983) takes another simplified form," a set of components and the relationships between them". Johnson (1983) introduces the idea of the properties of the items within the system when he defines," a system is a set of elements each with certain attributes that are linked in a particular way, with the nature of the links not only determining the operations of the systems but also its evolution". The emphasis of systems as applied to the real world is given by James (1972)," a whole (a person, a state, a culture, a business firm), that functions as a whole because of the interdependence of its parts". A final definition links the idea of a system to the geographical world, "a system is a means of dismantling the environment for analysis and so be able to reassemble the parts to give an integrated synthesis", White et al (1984).
variables. The restriction of a system to a set of elements implies that systems are bounded, Huggett (1980). There are three types of variables, first, those that are totally external to the system, secondly those that are totally internal to the system and thirdly, those that cross the boundary of the system. Those variables that are totally external are assumed to remain constant and have no effect on the system under study, Harvey (1969). Huggett (1980) identifies those variables that are outside of the system but impact on it, as exogenous, whereas the variables totally within the system are endogenous. For example, in a drainage basin system, the rainfall is exogenous and the soil wetness is endogenous. Hagen (1961) indicates that in order to study systems effectively they must be closed. A system that interacts with its environment is an open system, therefore, all systems of 'real' life are open systems. But for the purposes of analysis it is necessary to make some intellectual construct that either totally cuts off or minimises the impact of the system's environment on the system.
Systems are analysed into abstractions that represent the real world. The real system is composed of an endless number of variables that investigators, with different aims, may with good reason analyse in different ways. The abstraction, that forms the model of the system, may therefore be validly constructed from a number of different viewpoints, Holt-Jensen (1988).
Geographical Systems
Ackerman (1963) was one of the first geographers to point out the value of systems research. He expected systems engineering to play an increasingly larger role in coping with the social and economic changes caused by the development of technology. Harvey (1969) wondered how geographers, given the complexity and richness of the interaction with which they deal, could avoid using techniques and terminology specifically devised to attack complexity.
particularly stresses people and their spatial distribution, but also views the human geography world in terms of organisations that are formed to produce goods and services. He adds to this, the use of resources and the broad systems of agriculture. Pred (1967) emphasises the input-output form of systems analysis and its application to economic geography. The systems approach is applicable to the more traditional view of geography, that is, from the regional perspective. This identifies systems for spatial analysis of regions that include the synthesis of geographical factors in cities and urban areas. The systematic geographical theme of historical geography can be viewed from a systems approach through the development of various states that represent time scales. Within the realm of physical geography, Huggett (1980) identifies, as possible systems for study, landforms and their associated sediment transport and the spatial relationships of plants and animals, including their interaction with soil and vegetation. Other possible systems identified include, the hydrological cycle and the pattern of climate ranging from a local to a global scale. In addition to the use of systems in the separate divisions of the discipline, it is argued that synthesizing geographical systems are formed by the interaction of social, ecological and geological units. This interaction can then be described in terms of geographical laws, Huggett (1976). Chorley and Kennedy (1971) suggest that socio-economic systems are dominantly non-spatial, and interact with physical systems, that tend to be spatial, to form intersections between the two.
Reduced subsistence Less Available Cash crops E_Imperiafism production Land for grazing in Sudan zone
and subsistence
N
New immigrants Well diggini (Fulani)
Diminished Burning vegetation Vegetation
cover Natural
—V— Population
More increase animals
Fuelwood collection Normal her
migration Higher
hampered Less mobile.< percentage Overgrazing herds of cattle
SAHEL
CATASTROPHE
Shift of monsoon rain belt
nts1 Changes in global temperature gradie
Tragedy
Soil of the
Erosion Larger Common
Herds
Higher levels of CO2 Social
and dust in the air Less drought Prestige
A resistant
vegetation
Increased Good grasing Veterinary
Vulcanise Industrialisation in the early Control
1960's
Theories based on Long Theories involving
Term Climatic Change over use of land
Reasons for the Sahel Catastrophe (Reenberg, 1982) Figure 2.7
Huggett's justifications, focuses on the openness of the various elements of the systems to examination and amendment. Fourth, he intimates the possibility of establishing 'macro' variables that could in turn establish 'macro' laws which might be one path to a sound geographical theory. Holt-Jensen (1988) adds that a systems model is a conceptual model and this helps us to understand the complex relationships in the geographical domain. His final point is that in the description of complex phenomena the consistent use of the systems approach imparts a terminological coherence.
The application of the systems approach to geographical domains requires a strategy. This will include both, a method for applying the systems structure, and criteria for deciding the particular aspects and view of the domain under consideration. A system is a set of objects, for which a very large number of potential states are feasible. The task of the geographer is to identify the feasible set of attributes, that can give rise to the drawing of suitable geographical conclusions. Ashby (1963) points out that real systems are characterised by an infinity of variables and different observers with different, or even the same aims, may make a wide variety of selection of the variables. Huggett (1980) suggests that systems analysis is not a lot different to normal scientific methods, as both require the specification of real world variables, and the hypothetical creation of the links between them..
Composition of Systems Structure
The composition of the structure of systems describes the components that make up systems. The description of the hierarchical nature of systems is then added. The functions of the systems, when viewed from an external perspective, is then addressed and this is followed by the classification of the geographical systems.
A system consists of a set of fixed elements and the relations between those elements. Each fixed element has variable characteristics called attributes. Each set of attributes or properties may be general descriptors such as size, mass, colour etc. Some of the attributes may take a particular value at any instance in time. These attributes are described as state attributes and their combination gives the state of the element at a particular point in time. The combination of the states of the various elements, that comprise the system, give the overall state of the system. Ackoff (1976) differentiates between physical objects, that are components of concrete systems, and concepts that are components of abstract systems. The most important variables, for geographers, are spatial circumstances such as location, distance, extent and density. Space may be expressed in two dimensions with time adding a third dimension. However, as Holt-Jensen (1988) points out, it may be possible to give a basic explanation of a time space system, but it is a complex and difficult system to handle and manipulate satisfactorily.
The way in which an element may move from one state to another is the result of a process, White et al (1984). These processes will often give rise to flows, influences and reactions between elements. Such flows, where appropriate, may be quantified as varying thicknesses of lines. When diagrammatically representing systems, flows or events that enter a system from its environment will affect at least one element directly and then there may be an impulse that is carried through the system to affect other elements. Sometimes the status of all the elements will be affected and this will change the status of the system as a whole.
between the various elements within the system and the environment that is external to the system. These connections may be called events. They refer to the events that take
place in the environment and that impact on the system. The relations between the state variables or systems elements can be expressed, verbally, statistically or mathematically, Huggett (1980), Figure 2.8.
A series relationship is formed by single causal links. A parallel relationship occurs when two or more elements affect a third or inversely when one element affects two or more others. The third type of relation is when the element's attributes influence other parts of the same element and so a feedback relationship develops.
systems are classified as having a feedback mechanism that results in the system changing itself through a series of states. Negative feedback is the description when the system attempts to return to a stable state, whilst positive feedback takes the system through a set of unrepeated states. Chorley (1973) maintains that real systems are neither in equilibrium or dynamic but that they lurch from one non-equilibrium state to another. White et al (1984) support this view and state that, associated with positive feedbacks, are thresholds for variables, past which they are capable of sudden and dramatic change. White et al (1984) go on to point out that all systems function in some way. With environmental systems, the function requires description in terms of the presence of some driving forces or source of energy.
Of particular interest to most system analysts is the idea of being able to structure a hierarchy of the domain under consideration. There are various ways of describing the view of levels within a system. Simon (1962) takes a threefold view, first, the environment which is the level outside of the system. Second, the level of interest, that is the description of the overall system itself, and third the level of the components within the system. Similar system hierarchies have also been identified by Hagerstrand (1967) and Gould (1969). A system at any level has what Koestler (1969) calls two faces, the face that shows the overall level of interest and the face that reflects the components of the system. Odum's (1971) view of a system involves viewing the system through a 'macroscope', that would have resolving power to focus in and scan the intermediary sub systems. Workable relations between high resolution sub-systems can then be used to predict the behaviour of the system as a whole. The latter can be depicted by the land phase of the hydrological cycle, with a series of storage components, through which incoming water is routed, Crawford and Lindsley (1966). Systems may be classified according to a description of the structure of the relations, including their internal complexity within the system.
bonds. Such systems vary in the number of components of which they comprise and the strength of the links between them.
Cascading systems are those in which the system parts are linked by a flow of mass or energy or a combination of the two. The outputs of one element become the inputs of another. Inputs and outputs are controlled by regulators. Feedback loops may occur but may be lagged in time e.g. the hydrological cycle.
Process response systems are characterised by at least one link between a morphological variable and a flow in a cascading system. Process response systems stress the relationship between system form or structure and system process.
Control systems are process response systems in which the key components are controlled by humans. This intervention may take the form of restricting the levels of individual components in governing the flows or inputs and outputs, e.g. controlled bush burning.
Bennett and Chorley (1978) also identify a classification of systems according to an environmental framework. They give a rising degree of complexity, commencing with animals and their inanimate environment, moving through ecosystems, to a middle point of humans and ecosystems. The next grouping are social systems, with the most complex being socio-ecological systems.
Strategies for Building System Models
Huggett (1980) identifies four stages in the construction of a model of a system. The four stages are sequential steps from the initial phases of examining the domain through to matching the completed model with reality.
boundaries to the elements within the system may be identified. If there are no such connections then a closed system has been delimited. Each element's attributes are then identified and defined.
The parsing stage, is analogous to the establishment of grammar rules and defines the relationships between the components. These relations may take many different forms and may be theoretical equations, empirical equations, statistical correlation or, for a non-mathematical model, textual descriptions.
The third stage, is the modelling phase that has two sections. First, the state variables and the relations are constructed to form a total model. The second section is to calibrate the model by giving values to each of the attributes and substantiating any constants in the system. This allows the model to be put into operation.
The final stage is the analysis phase, whereby the system is stepped through with inputs, the outputs and the change in states then occur. Comparisons with the real world can then be made.
There is a second view of model building, Meadows and Robinson (1985) view the types of models in terms of their generality and development. The first stage is a model that indicates a general understanding and shows a grasp of the principal questions and concepts. This broad model can then be refined into the second stage that considers the causes of the problems that have been identified. The construction of relationships then takes place. These indicate the description of the system for prediction and projection purposes. The final stage is the inclusion of the detailed, specific and accurate facts so that the resultant model may be compared with the actual world.
The Nature of Models
even an equation. His final view of a model was as a synthesis of data. In terms of its composition he states a model could include reasoning about the real world by means of translation in space. This would give spatial models or, if time is included then historical models are possible. He concluded a model is a simplified and intelligible picture of the world. The simplified statements of this structural inter-dependence have been termed models. Therefore a model is a simplified structuring of reality, that presents supposedly significant features or relationships in a generalised form. Models are highly subjective approximations, in that they do not include all observation or measurements, but as such they are valuable in obscuring incidental details and in allowing the fundamental aspects of reality to appear. This selectivity means that models have varying degrees of probability and a limited range of conditions over which they might apply.
White et al (1984) adopt as a starting point, the manner in which the term model is used in every day speech. They state it has three distinct meanings, a replica, an ideal and to display. They consider that models derived for environmental systems can combine all three meanings. Thus, in order to simplify environmental systems, models or replicas can be constructed. To be useful, these models must idealise the system and display or make clear its structure and how it works. The relationships in the model will then map directly to the relations in the system domain. The types of relationships are spatial, distance, causation, conjunction and the succession of events. If models do not include references to processes, they may be taken to be a static description of the structure of the system. To understand the functional aspect of the system model, there is the need to identify the effect of these processes on the system. This mapping between the model and the processes within the system is necessary if the model is to be of use for predictive purposes, such as a drainage basin model to predict flood hazard.
unit whose function may be evaluated without specifying the contents. A white box has most of the element states, relationships and processes identified within the model. The idea of a continuum from black to white box views, through grey, are discussed by White et al. The black-white box continuum has the advantages of providing a hierarchy of models at different levels of discrimination and secondly it allows specialist knowledge to be incorporated within a general model.
The Purpose of Models
Models are necessary to form a bridge between the observational and theoretical levels. They are concerned with simplification, reduction, concretisation, experimentation, action extensions, globalisation, theory formation and explanation, Apostel (1961). They act as a stepping stone from observation to the building of theories and laws, Chorley and Haggert (1967). Harvey (1973) accepts the latter, but also adds models can connect experience and imagination, as well as relating one theory to another theory.
Models are suggestive, in that a model contains suggestions for its own extension and generalisation. Also, a model should have a greater implication than merely the sum of its parts. In doing so, it should act as a basis for predictions about the real world, Toulim (1960). The capability for the collection, ordering and defining of data gives models an acquisitive characteristic, Chorley and Haggert (1967). Models have a psychological aspect, in that they enable some group of phenomena to be visualised and comprehended, which could not otherwise be possible because of the magnitude or complexity of the task. They also supply a cognitive function, in that they are a method for the communication of scientific ideas, Chorley and Haggert (1967).
Modelling Paradigms
The first paradigm is systems dynamics, developed from the work of Forrester (1968). He developed a set of representation techniques for simulating complex, non-linear systems with multi-loop feedbacks. He laid the foundation, in many cases, for future work on simulation and more latterly on certain aspects of modelling.
The second of Meadows and Robinson's modelling paradigms is econometrics. An econometric model is a set of theoretical relationships that have been statistically quantified with historic data from a particular economic system.
Input-output analysis, is the third paradigm. This is based on sets of data that measure the flows of goods or money among various sectors and industrial groups within an economy.
The final paradigm is optimisation, which is based on the development of linear programming . Optimisation models select, mathematically, from a large number of possible policies or options, a single set that allows maximum achievement of some objective.
External Perception of Models