OncoTargets and Therapy
Dove
press
O r i g i n a l r e s e a r c h
open access to scientific and medical research
Open access Full Text article
impact of platelet to lymphocyte ratio and
metabolic syndrome on the prognosis of
colorectal cancer patients
Jie You1,2,*
huxiang Zhang3,*
Yanyan shen2,*
chuanzhi chen2
Wenyue liu4
Minghua Zheng5
sven Van Poucke6
guilong guo2
Zonghai huang1
1Department of general surgery, Zhujiang hospital, southern Medical University, guangzhou, 2Department of Oncological surgery, 3Department of Pathology, 4Department of endocrinology, 5Department of hepatology, liver research center, the First affiliated hospital of Wenzhou Medical University, Wenzhou, People’s republic of china; 6Department of anesthesiology, intensive care, emergency Medicine and Pain Therapy, Ziekenhuis Oost-limburg, genk, Belgium
*These authors contributed equally to this work
Objective: The aim of this study was to evaluate the prognostic value of both platelet to lymphocyte ratio (PLR) and metabolic syndrome (MetS) in colorectal cancer (CRC) patients.
Patients and methods: We retrospectively enrolled 1,163 CRC patients. Preoperative values of PLR were stratified into three groups according to cut-off values of 120 and 220. The Kaplan–Meier analysis was used to calculate cumulative survival rate related to PLR and MetS. Cox proportional hazard regression models were used to analyze potential risk factors and the prognosis associated with PLR and MetS in CRC patients.
Results: PLR was significantly higher in the MetS(+) group as compared to MetS(-) group (P=0.039). An elevated PLR was significantly associated with mortality (P=0.014), but not the existence of MetS (P=0.235). In multivariate regression analysis, PLR was an independent risk factor for overall survival (OS) (P=0.046). For the subgroup with a PLR .220, MetS was an independent predictor for both OS and disease-free survival (P=0.039 and P=0.047, respectively) by multivariate analysis adjusting for confounding covariates. In addition, the presence of MetS was associated with a 2-fold increased risk of mortality and tumor recurrences (hazard ratio [HR] =2.0 and HR =1.9, P,0.05, respectively).
Conclusion: Preoperative PLR was associated with MetS in CRC patients. Testing for the combined presence of PLR and MetS could potentially improve the predictive accuracy of CRC prognosis.
Keywords: colorectal cancer, platelet to lymphocyte ratio, metabolic syndrome, prognosis
Introduction
Colorectal cancer (CRC) is the third most diagnosed malignant tumor worldwide with over 600,000 related deaths a year.1 In People’s Republic of China, an estimated
376,300 new cases and 191,000 deaths from CRC occurred in 2015.2 Understanding
the risk factors for CRC may improve the development of pro-active precision medicine.
Metabolic syndrome (MetS) is characterized by a cluster of metabolic disturbances, including high blood pressure, obesity, atherogenic dyslipidemia, and impaired glucose metabolism.3,4 In the last recent decade, epidemiological and clinical studies have
demonstrated a close link between MetS and an increased risk of CRC.5,6 However,
the correlation between MetS and quantitative analysis of CRC outcome remained unclear.7–10 One possible explanation might be related to the inter-individual and
time-related differences in host systemic inflammatory status, and the quantification of an elevated inflammatory response which is associated with the progression and prognosis of CRC.11–13 Furthermore, chronic low-grade inflammation leads to metabolic
correspondence: Zonghai huang Department of general surgery, Zhujiang hospital, southern Medical University, 253, gongye Dadao Zhong, haizhu District, guangzhou 510280, People’s republic of china
Tel +86 20 6164 3213 Fax +86 20 8431 1562 email dr_huangzh@126.com
guilong guo
Department of Oncological surgery, The First Affiliated Hospital of Wenzhou Medical University, nan Bai Xiang street, Ouhai District, Wenzhou, Zhejiang 325000, People’s republic of china email wzguoguilong@163.com
Journal name: OncoTargets and Therapy Article Designation: Original Research Year: 2017
Volume: 10
Running head verso: You et al
Running head recto: Impact of PLR and MetS on CRC prognosis DOI: http://dx.doi.org/10.2147/OTT.S132621
OncoTargets and Therapy downloaded from https://www.dovepress.com/ by 118.70.13.36 on 25-Aug-2020
For personal use only.
Number of times this article has been viewed
This article was published in the following Dove Press journal: OncoTargets and Therapy
Dovepress
You et al
disturbances, which in turn lead to insulin resistance,14 altered
glucose and lipid metabolism triggering inflammation.15
Systemic inflammation can easily be assessed by means of peripheral blood markers such as serum white blood cells, neutrophils, lymphocytes and platelets, and acute-phase proteins. Platelet to lymphocyte ratio (PLR) has been reported to be associated with the prognosis of CRC.16–18
Previous studies indicated that increased platelet counts were associated with MetS in adults.19,20 Akboga et al reported
that increased PLR was significantly associated with MetS in a Turkish population.21 Whether the presence of MetS,
combined with the different levels of PLR, could improve the ability to predict prognosis of CRC remains unknown. As such, we aimed to evaluate the prognosis of the association of PLR with MetS in CRC patients.
Patients and methods
study patients
In this cross-sectional study, data were retrospectively col-lected from hospital records of 1,163 patients diagnosed with colorectal adenocarcinoma admitted to the First Affiliated Hospital of Wenzhou Medical University between April 2005 and April 2011. Exclusion criteria were as follows: clinical evidence of infection, hematological disease, enterobrosis, intestinal obstruction, neoadjuvant therapy, and patients with familial adenomatous polyposis syndrome. The study was approved by the Ethics Committee of the First Affili-ated Hospital of Wenzhou Medical University and all study patients signed a written informed consent.
Diagnostic criteria of Mets
MetS is considered a cluster of metabolic disturbances.3
In this study, we adopted the criteria proposed by the Chi-nese Diabetes Society in 2004.22 MetS is defined as the
presence of three or more of the following criteria: 1) body mass index (BMI) $25 kg/m2; 2) anti-hypertensive drug
administration and (or) systolic blood pressure $140 mmHg or diastolic blood pressure $90 mmHg; 3) triglycer-ides $1.7 mmol/L and (or) high-density lipoprotein (HDL) cholesterol ,0.9 mmol/L (male), ,1.0 mmol/L (female); and 4) fasting plasma glucose $6.1 mmol/L or 2 h postprandial glucose $7.8 mmol/L.
clinical–pathological and laboratory data
Demographic information including date of birth, gender, age at CRC diagnosis, tobacco use, history of hypertension and diabetes, and family cancer history were recorded. Detailed clinical data such as body weight, height, and blood
pressure were recorded within 1 week before surgery. Preoperative blood values including white blood cell, neu-trophil, lymphocyte, monocyte and platelet counts were collected. PLR was calculated as the absolute platelet count divided by the absolute lymphocyte count. BMI was cal-culated as the weight in kg divided by the square of height in m (kg/m2).
Patients with CRC were treated primarily with surgical resection with adjuvant treatment according to the National Comprehensive Cancer Network guidelines. Tumor stag-ing was performed accordstag-ing to the seventh edition of the American Joint Committee on Cancer staging manual.23 In
addition, information related to tumor location, histological differentiation, and vascular invasion was obtained from pathology reports.
Follow-up evaluation
Follow-up evaluation was conducted every 3–6 months for the first 2 years after hospital discharge, every 6 months thereafter for a total of 5 years, and every year thereafter. Colonoscopy and computed tomography (CT) were per-formed at postoperative follow-up appointments in addition to blood analysis, including carcinoembryonic antigen (CEA) measurements. Tumor recurrence indicated by elevated CEA, abnormal findings on colonoscopy or CT scans, was defined as an earlier follow-up event. Information on death was obtained either from the patient’s social security death index, outpatient medical records, or notifications from the relatives of the patients. The deadline of follow-up was August 1, 2016. Overall survival (OS) was defined as the time from the date of surgery to the date of death or the date of last follow-up. Disease-free survival (DFS) was defined as the time from the date of surgery to the time of recurrence or date of last follow-up.
statistical analysis
All continuous data were expressed as the mean ± standard deviation and compared using Student’s t-test or Mann– Whitney U test according to the data distribution. Categorical data were expressed in numbers (%) and compared by using the Chi-square test or Kruskal–Wallis test. Based on the optional cut-off values of our previous study,16 the distribution of
PLR, and the size of the study population with MetS, patients were stratified into three groups according to the two cut-off values (120, 220). The Kaplan–Meier survival function and log-rank tests were used to assess differences in OS and DFS. The prediction of different variables for the risks of CRC was calculated by Cox proportional hazard regression analyses.
OncoTargets and Therapy downloaded from https://www.dovepress.com/ by 118.70.13.36 on 25-Aug-2020
Dovepress impact of Plr and Mets on crc prognosis
The risk effect-size estimates were expressed as hazard ratio (HR) with 95% confidence interval (CI). Variables with
P#0.1 from univariate Cox regression analysis were used in multivariate analysis by forward stepwise selection. All
P-values were two-sided and a P-value ,0.05 was considered
as statistically significant. Statistical analysis were performed using the SPSS statistical software package, version 19.0 (IBM Corporation, Armonk, NY, USA) and MedCalc version 13.0 (MedCalc Software, Mariakerke, Belgium).
Results
Baseline characteristics
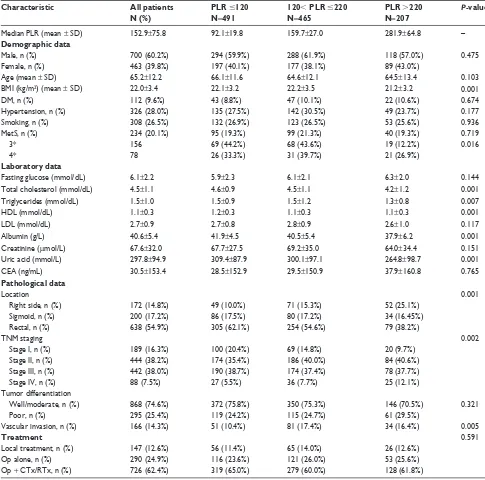
Demographic and clinical characteristics are shown in Table 1. A total of 234 (20.1%) patients were identified to meet the criteria of MetS. The mean age of patients was 65 years, and the majority were male (60.2%). Six hundred and thirty-eight patients (54.9%) were diagnosed with rectal cancer. The majority of tumors were histologically well and moderately differentiated (74.6%). At initial diagnosis, 16.3% of the CRC
Table 1 characteristics of crc patients treated with surgical resection according to Plr
Characteristic All patients N (%)
PLR #120 N=491
120, PLR #220 N=465
PLR .220 N=207
P-value
Median Plr (mean ± sD) 152.9±75.8 92.1±19.8 159.7±27.0 281.9±64.8 –
Demographic data
Male, n (%) 700 (60.2%) 294 (59.9%) 288 (61.9%) 118 (57.0%) 0.475
Female, n (%) 463 (39.8%) 197 (40.1%) 177 (38.1%) 89 (43.0%)
age (mean ± sD) 65.2±12.2 66.1±11.6 64.6±12.1 64.5±13.4 0.103
BMi (kg/m2) (mean ± sD) 22.0±3.4 22.1±3.2 22.2±3.5 21.2±3.2 0.001
DM, n (%) 112 (9.6%) 43 (8.8%) 47 (10.1%) 22 (10.6%) 0.674
hypertension, n (%) 326 (28.0%) 135 (27.5%) 142 (30.5%) 49 (23.7%) 0.177
smoking, n (%) 308 (26.5%) 132 (26.9%) 123 (26.5%) 53 (25.6%) 0.936
Mets, n (%) 234 (20.1%) 95 (19.3%) 99 (21.3%) 40 (19.3%) 0.719
3* 156 69 (44.2%) 68 (43.6%) 19 (12.2%) 0.016
4* 78 26 (33.3%) 31 (39.7%) 21 (26.9%)
Laboratory data
Fasting glucose (mmol/dl) 6.1±2.2 5.9±2.3 6.1±2.1 6.3±2.0 0.144
Total cholesterol (mmol/dl) 4.5±1.1 4.6±0.9 4.5±1.1 4.2±1.2 0.001
Triglycerides (mmol/dl) 1.5±1.0 1.5±0.9 1.5±1.2 1.3±0.8 0.007
hDl (mmol/dl) 1.1±0.3 1.2±0.3 1.1±0.3 1.1±0.3 0.001
lDl (mmol/dl) 2.7±0.9 2.7±0.8 2.8±0.9 2.6±1.0 0.117
albumin (g/l) 40.6±5.4 41.9±4.5 40.5±5.4 37.9±6.2 0.001
creatinine (μmol/l) 67.6±32.0 67.7±27.5 69.2±35.0 64.0±34.4 0.151
Uric acid (mmol/l) 297.8±94.9 309.4±87.9 300.1±97.1 264.8±98.7 0.001
cea (ng/ml) 30.5±153.4 28.5±152.9 29.5±150.9 37.9±160.8 0.765
Pathological data
location 0.001
right side, n (%) 172 (14.8%) 49 (10.0%) 71 (15.3%) 52 (25.1%)
sigmoid, n (%) 200 (17.2%) 86 (17.5%) 80 (17.2%) 34 (16.45%)
rectal, n (%) 638 (54.9%) 305 (62.1%) 254 (54.6%) 79 (38.2%)
TnM staging 0.002
stage i, n (%) 189 (16.3%) 100 (20.4%) 69 (14.8%) 20 (9.7%)
stage ii, n (%) 444 (38.2%) 174 (35.4%) 186 (40.0%) 84 (40.6%)
stage iii, n (%) 442 (38.0%) 190 (38.7%) 174 (37.4%) 78 (37.7%)
stage iV, n (%) 88 (7.5%) 27 (5.5%) 36 (7.7%) 25 (12.1%)
Tumor differentiation
Well/moderate, n (%) 868 (74.6%) 372 (75.8%) 350 (75.3%) 146 (70.5%) 0.321
Poor, n (%) 295 (25.4%) 119 (24.2%) 115 (24.7%) 61 (29.5%)
Vascular invasion, n (%) 166 (14.3%) 51 (10.4%) 81 (17.4%) 34 (16.4%) 0.005
Treatment 0.591
local treatment, n (%) 147 (12.6%) 56 (11.4%) 65 (14.0%) 26 (12.6%)
Op alone, n (%) 290 (24.9%) 116 (23.6%) 121 (26.0%) 53 (25.6%)
Op + cTx/rTx, n (%) 726 (62.4%) 319 (65.0%) 279 (60.0%) 128 (61.8%)
Note: *number of metabolic risk factors.
Abbreviations: BMi, body mass index; cea, carcinoembryonic antigen; crc, colorectal cancer; cTx, chemotherapy; DM, diabetes mellitus; hDl, high-density lipoprotein; lDl, low-density lipoprotein; Mets, metabolic syndrome; Op, operation; Plr, platelet to lymphocyte ratio; rTx, radiotherapy; sD, standard deviation; TnM, tumor-node-metastasis.
OncoTargets and Therapy downloaded from https://www.dovepress.com/ by 118.70.13.36 on 25-Aug-2020
Dovepress
You et al
patients presented with stage I, 38.2% with stage II, 38.0% with stage III, and 7.5% with stage IV.
The median preoperative PLR was 153. There were statis-tically significant differences between the groups with respect to total cholesterol, triglycerides, HDL, albumin, and uric acid (each parameter with P,0.05). In addition, patients with PLR .220 were significantly associated with higher incidence of stage IV and a tumor location at the right side. The tumors were also significantly associated with the clinical variable of vascular invasion (P,0.05). There were no statistically sig-nificant differences in other clinical or pathological features. Although there is no difference in MetS between the PLR subgroup (P=0.719), further analyses showed a significant difference between the PLR subgroup, comparing the MetS subgroups stratified by the metabolic risk factors (P=0.016). PLR was also significantly higher in the MetS(+) group com-pared with MetS(-) (162.0±99.8 vs 150.6±68.3, P=0.039, Table 2), however, there was a graded tendency between increasing number of MetS components and PLR (146.3±66.2, 149.3±65.1, 153.8±72.1, 158.3±106.6, 169.5±84.9, P=0.150, respectively), as illustrated in Figure 1.
survival estimates according to Plr
and Mets
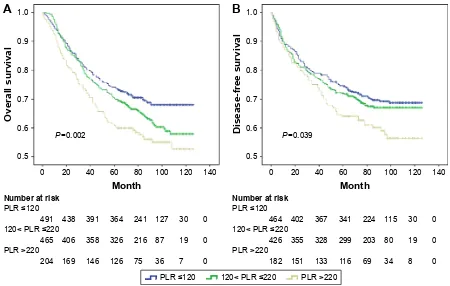
The mean follow-up time was 71.2 months. Kaplan–Meier analysis of OS and DFS demonstrated a progressively lower
OS (P=0.002; Figure 2A) and DFS (P=0.039; Figure 2B) in elevated PLR groups. As shown in Figure 3A, there was a trend of better OS for patients with MetS(-) compared to MetS(+), but the difference between the two survival curves was not statistically significant (P=0.233). Similar results were noticed for DFS (P=0.255, Figure 3B).
risk estimates of Plr and Mets
Cox proportional hazard models were used to identify vari-ables associated with OS and DFS and the results are illus-trated in Table 3. The patients with a PLR .220 revealed a 59% increase in mortality risk and 43% increased risk for the recurrence of disease compared with patients with a PLR ,120 HR =1.594; 95% CI 1.227–2.070, P,0.001 and HR =1.434; 95% CI 1.082–1.902, P=0.012, respectively). Gender, age, HDL, albumin, triglycerides, uric acid, tumor-node-metastasis (TNM) stage, tumor differentiation, the pres-ence of vascular invasion, and CEA were also significantly associated with the risk of death based on univariate analysis (P,0.05 for all measurements). In the multivariate analysis, PLR remained significantly associated with OS (HR =1.511; 95% CI 1.103–2.070, P=0.010). However, only HDL and TNM stage were independent predictors in multivariate Cox analysis for DFS (P,0.05 for all measurements, Table 3).
subgroup analyses associated with
Plr and Mets
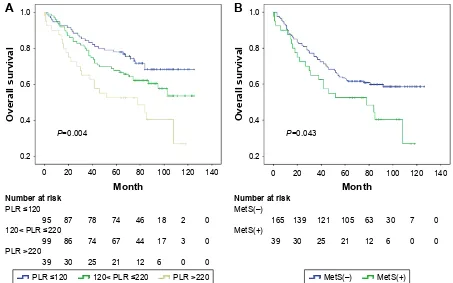
In the MetS(+) subgroup, Kaplan–Meier analysis of OS showed significantly progressively worse OS with elevated PLR (P=0.004; Figure 4A), compared with the MetS(-) subgroup (P=0.064), and PLR remained as an independent predictor for OS in the univariable and multivariable analysis (P=0.006, P=0.047, respectively, Table 4), but not for DFS (P=0.110, P=0.323, respectively). Considering the impact of different ranges of PLR, multivariate analysis showed that the subgroups with PLR values #220 were not associ-ated with the prognosis after adjustment for MetS and PLR, even including other covariates. However, in the subgroup of patients with PLR values .220, the difference between the two survival curves stratified by MetS was statistically significant in OS (P=0.043, Figure 4B), and the coexistence of MetS was associated with a twofold increased risk of CRC mortality and recurrence (HR =2.0, HR =1.9 P,0.05, respectively, Table 5).
Discussion
The main findings of this study are as follows. PLR levels were significantly higher in CRC patients with MetS compared to
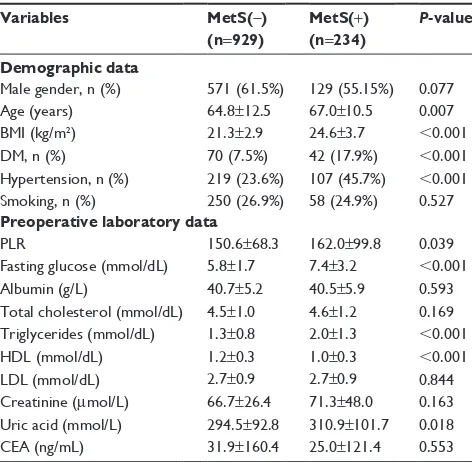
Table 2 Baseline characteristics of CRC patients stratified by Mets
Variables MetS(-) (n=929)
MetS(+) (n=234)
P-value
Demographic data
Male gender, n (%) 571 (61.5%) 129 (55.15%) 0.077
age (years) 64.8±12.5 67.0±10.5 0.007
BMi (kg/m2) 21.3±2.9 24.6±3.7 ,0.001
DM, n (%) 70 (7.5%) 42 (17.9%) ,0.001
hypertension, n (%) 219 (23.6%) 107 (45.7%) ,0.001
smoking, n (%) 250 (26.9%) 58 (24.9%) 0.527
Preoperative laboratory data
Plr 150.6±68.3 162.0±99.8 0.039
Fasting glucose (mmol/dl) 5.8±1.7 7.4±3.2 ,0.001
albumin (g/l) 40.7±5.2 40.5±5.9 0.593
Total cholesterol (mmol/dl) 4.5±1.0 4.6±1.2 0.169 Triglycerides (mmol/dl) 1.3±0.8 2.0±1.3 ,0.001
hDl (mmol/dl) 1.2±0.3 1.0±0.3 ,0.001
lDl (mmol/dl) 2.7±0.9 2.7±0.9 0.844
creatinine (μmol/l) 66.7±26.4 71.3±48.0 0.163 Uric acid (mmol/l) 294.5±92.8 310.9±101.7 0.018
cea (ng/ml) 31.9±160.4 25.0±121.4 0.553
Abbreviations: BMi, body mass index; cea, carcinoembryonic antigen; crc, colorectal cancer; DM, diabetes mellitus; hDl, high-density lipoprotein; lDl, low-density lipoprotein; Mets, metabolic syndrome; Plr, platelet to lymphocyte ratio.
OncoTargets and Therapy downloaded from https://www.dovepress.com/ by 118.70.13.36 on 25-Aug-2020
Dovepress impact of Plr and Mets on crc prognosis
patients not diagnosed with MetS. Also, no correlation was found with severity of MetS. We revealed that in the sub-group of patients with PLR values .220, MetS was an inde-pendent predictor of the prognosis, and the presence of MetS was associated with a twofold increased risk of mortality
and recurrence. To the best of our knowledge, there are no comparable reports describing the impact of both PLR values and MetS on the prognosis of patients with CRC.
MetS is defined as a cardiometabolic condition that increases the risk of type 2 diabetes mellitus, cardiovascular disease, and
Figure 1 The graded relationship between increasing number of Mets components and Plr.
Abbreviations: Mets, metabolic syndrome; Plr, platelet to lymphocyte ratio.
Q
Q Q Q Q
1XPEHURIPHWDEROLFULVNIDFWRUV
3ODWHOHWWRO\PSKRF\WHUDWLR
3
Figure 2 Kaplan–Meier survival curves showing overall survival (A) and disease-free survival (B) stratified by PLR in CRC patients (cutoff values 120, 220, respectively).
Abbreviations: crc, colorectal cancer; Plr, platelet to lymphocyte ratio.
3
3/5
1XPEHUDWULVN
3/5! 3/5
0RQWK
2YHUDOOVXUYLYDO
3
1XPEHUDWULVN
3/5
3/5! 3/5
'LVHDVHIUHHVXUYLYDO
0RQWK
3/5 3/5 3/5!
$
%
OncoTargets and Therapy downloaded from https://www.dovepress.com/ by 118.70.13.36 on 25-Aug-2020
Dovepress
You et al
Figure 3 Kaplan–Meier survival curves showing overall survival (A) and disease-free survival (B) stratified by MetS in CRC patients.
Abbreviations: crc, colorectal cancer; Mets, metabolic syndrome.
$
2YHUDOOVXUYLYDO
3
1XPEHUDWULVN
0HW6±
0HW6
0RQWK
'LVHDVHIUHHVXUYLYDO 3
1XPEHUDWULVN
0HW6±
0HW6
0RQWK
%
0HW6± 0HW6
Table 3 cox proportional hazard regression models of risk factors associated with prognosis among crc patients
Overall survival Disease-free survival
Univariable Multivariable Univariable Multivariable
HR 95% CI P-value HR 95% CI P-value HR 95% CI P-value HR 95% CI P-value
gender (male vs female) 1.365 1.113–1.673 0.003 1.447 1.136–1.844 0.003 1.336 1.072–1.665 0.010 1.384 1.096–1.747 0.006 age 1.014 1.005–1.022 ,0.001 1.008 1.003–1.021 0.068 1.001 0.993–1.010 0.747
Diabetes 0.997 0.847–1.174 0.974 0.990 0.830–1.182 0.915
hypertension 0.860 0.697–1.060 0.158 0.860 0.697–1.060 0.158
Mets 0.932 0.830–1.047 0.235 0.929 0.818–1.055 0.257
BMi (continuous) 0.974 0.945–1.003 0.080 0.986 0.954–1.019 0.391 1.000 0.969–1.032 0.990 Plr (continuous) 1.001 1.000–1.003 0.014 0.996 0.993–1.000 0.043 1.001 1.000–1.002 0.117
Plr #120 1.000 – – 1.000 – – 1.000 – – 1.000 – –
120, Plr #220 1.247 1.002–1.552 0.048 1.445 1.029–2.030 0.034 1.089 0.860–1.379 0.478 1.077 0.844–1.374 0.551 Plr .220 1.594 1.227–2.070 ,0.001 2.374 1.127–5.002 0.023 1.434 1.082–1.902 0.012 1.110 0.809–1.523 0.519 Total cholesterol 0.908 0.823–1.002 0.055 1.064 0.950–1.191 0.283 0.947 0.852–1.053 0.316
Triglycerides 0.887 0.790–0.996 0.042 0.948 0.841–1.068 0.378 0.976 0.875–1.089 0.663
hDl 0.574 0.412–0.798 ,0.001 0.876 0.588–1.306 0.516 0.534 0.371–0.767 0.001 0.668 0.451–0.989 0.044
lDl 0.934 0.811–1.076 0.347 0.921 0.790–1.073 0.291
albumin 0.958 0.942–0.973 ,0.001 0.964 0.942–0.986 0.002 0.970 0.952–0.988 0.001 0.978 0.957–0.999 0.044
creatinine 1.001 0.998–1.003 0.652 1.001 0.998–1.004 0.428
Uric acid 0.999 0.998–1.000 0.037 0.999 0.998–1.001 0.347 0.999 0.998–1.000 0.104 TnM staging
stage i 1.000 – – 1.000 – – 1.000 – – 1.000 – –
stage ii 0.983 0.675–1.431 0.927 0.840 0.565–1.249 0.390 1.022 0.707–1.478 0.908 0.956 0.650–1.406 0.819 stage iii 2.794 1.983–3.938 ,0.001 2.321 1.602–3.364 ,0.001 2.920 2.082–4.095 ,0.001 2.780 1.936–3.993 ,0.001 stage iV 15.369 10.407–22.699 ,0.001 12.655 8.252–19.406,0.001 8.007 1.933–33.165 0.004 7.300 1.746–30.523 ,0.001 Differentiation 0.676 0.548–0.833 ,0.001 0.917 0.728–1.156 0.464 0.664 0.528–0.834 ,0.001 0.882 0.690–1.128 0.316 Vascular invasion 0.532 0.420–0.674 ,0.001 0.777 0.587–1.012 0.061 0.589 0.450–0.771 ,0.001 0.844 0.630–1.130 0.255 cea 1.001 1.001–1.002 ,0.001 1.000 1.000–1.001 0.089 1.001 1.000–1.001 0.272
Abbreviations: BMI, body mass index; CEA, carcinoembryonic antigen; CI, confidence interval; CRC, colorectal cancer; HDL, high-density lipoprotein; HR, hazard ratio;
OncoTargets and Therapy downloaded from https://www.dovepress.com/ by 118.70.13.36 on 25-Aug-2020
Dovepress impact of Plr and Mets on crc prognosis
Figure 4 Kaplan–Meier survival curves showing overall survival stratified by PLR in CRC patients with MetS (A) and overall survival stratified by MetS in CRC patients with Plr .220 (B).
Abbreviations: crc, colorectal cancer; Mets, metabolic syndrome; Plr, platelet to lymphocyte ratio.
3/5 3/5 3/5! 0HW6± 0HW6
3
0RQWK
2YHUDOOVXUYLYDO
3/5
3/5
3/5!
1XPEHUDWULVN
$
3
2YHUDOOVXUYLYDO
0RQWK
0HW6±
0HW6
1XPEHUDWULVN
%
Table 4 Cox proportional hazard regression analysis of prognosis stratified by MetS
MetS PLR Overall survival Disease-free survival
Univariable Multivariable* Univariable Multivariable*
HR 95% CI P-value HR 95% CI P-value HR 95% CI P-value HR 95% CI P-value
Mets(+) group
Plr** – – 0.006 0.047 0.110 0.323
Plr #120 1.000 – – 1.000 – – 1.000 – – 1.000 – –
120, Plr #220 1.452 0.896–2.354 0.130 1.241 0.763–2.018 0.385 1.075 0.645–1.790 0.782 0.946 0.564–1.588 0.834 Plr .220 2.471 1.422–4.293 0.001 1.997 1.143–3.489 0.015 1.843 1.012–3.355 0.046 1.468 0.801–2.689 0.214 Mets(-)
group
Plr** 0.066 0.018 0.185 0.111
Plr #120 1.000 – – 1.000 – – 1.000 – – 1.000 – –
120, Plr #220 1.194 0.934–1.526 0.158 1.253 0.980–1.603 0.072 1.092 0.837–1.425 0.517 1.139 0.873–1.487 0.338 Plr .220 1.415 1.050–1.906 0.023 1.525 1.131–2.058 0.006 1.349 0.979–1.857 0.067 1.410 1.022–1.946 0.036
Notes: *adjusted for all covariates including age, gender, Plr, and TnM staging. **categorical variable.
Abbreviations: CI, confidence interval; HR, hazard ratio; MetS, metabolic syndrome; PLR, platelet to lymphocyte ratio; TNM, tumor-node-metastasis.
Table 5 cox proportional hazard regression analysis of the prognosis of the subgroups of Plr
PLR Overall survival Disease-free survival
Multivariable* Multivariable** Multivariable* Multivariable**
HR 95% CI P-value HR 95% CI P-value HR 95% CI P-value HR 95% CI P-value
,120
Mets 1.072 0.619–1.408 0.742 1.052 0.695–1.592 0.810 1.105 0.734–1.664 0.633 1.298 0.857–1.966 0.218 Plr 1.003 0.989–1.005 0.476 0.996 0.988–1.004 0.298 1.005 0.987–1.013 0.227 0.994 0.986–1.002 0.131 120–220
Mets 1.148 0.611–1.240 0.443 0.908 0.636–1.295 0.593 0.921 0.614–1.380 0.690 0.895 0.595–1.346 0.594 Plr 1.001 0.995–1.006 0.833 1.000 0.994–1.005 0.989 1.002 0.996–1.008 0.510 1.001 0.995–1.007 0.705
.220
Mets 2.016 1.233–3.289 0.005 1.704 1.028–2.825 0.039 1.887 1.081–3.289 0.025 1.779 1.008–3.135 0.047 Plr 1.005 1.000–1.009 0.031 1.004 1.000–1.008 0.051 1.005 1.000–1.010 0.044 1.005 1.000–1.010 0.058
Notes: *adjusted for Mets and Plr. **adjusted for covariates including age, gender, Mets, Plr, and TnM staging.
OncoTargets and Therapy downloaded from https://www.dovepress.com/ by 118.70.13.36 on 25-Aug-2020
Dovepress
You et al
all-cause mortality including cancer.24–26 Previous studies
demonstrated that MetS was associated with an increased risk of mortality and recurrences in CRC patients.9,27 However, the
mechanisms by which MetS affects the prognosis are not fully understood, although several hypotheses have been proposed, including inflammation and insulin resistance.28–30 A low-grade
inflammatory condition in MetS, termed as “metabolic inflam-mation” or “metaflaminflam-mation”, has been regarded as a vital factor that revealed a correlation with impaired demand and supply of oxygen, which results in hypoxia and subsequent inflammation.31,32 As such, an interaction between hypoxic
and inflammatory signaling pathways and blood coagulation disorders have been related to CRC patients.33–35
In recent studies, PLR was considered a predictor of systemic inflammation and was correlated with the prognosis of CRC. Moreover, a higher PLR level was correlated with adverse postoperative survival in CRC patients.16–18 In this
study, we also found that there is an association of high PLR with right-sided colon cancer (RCC), but not left-sided colorectal cancer (LCRC) (P=0.001). Compared with LCRC, RCC had a delay in the diagnosis, due to the more subtle symptoms. To some extent, this leads to RCC hav-ing more active immune cells promothav-ing immunogenicity and producing more inflammatory factors.36 Several studies
have indicated that patients with RCC have a worse prog-nosis compared to those with LCRC.37,38 This is consistent
with the impact of PLR on the survival of CRC patients. In terms of stage distribution, it is well known that with the advanced TNM stage, malignant solid tumors had higher incidence of inducing a hypercoagulable state,39,40 which may
gradually lead to thrombocytosis and high PLR. This can partly explain why PLRs are different in TNM stage distri-bution. Increased PLR levels were significantly associated with both the presence and severity of MetS in cardiology patients.21 It has been shown that platelets are activated in
case of MetS by linking inflammation and thrombosis.41
Activated platelets also release pro-inflammatory mediators which interfere in the pathophysiology of MetS.42 The
lat-est meta-analysis reported that elevated platelet count and thrombocytosis prior to treatment, was related with a poor prognosis for patients with CRC.43,44 Lymphocytes play
a vital role in cancer immune surveillance and suppress tumor maturation.45 Based on the previous studies on PLR,
peripheral platelets, lymphocytes or their ratio are indicators for the inflammatory process induced by tumor cells. A high level of platelets may promote tumor growth by increasing angiogenesis through the production of vascular endothelial
growth factor (VEGF). It has been shown that the overex-pression of VEGF was negatively associated with disease prognosis and metastasis in patients with various cancers, including CRC.46
There are some limitations to our study. First, this study has a retrospective cross-sectional design with single-center data and a relatively small number of MetS patients (n=234). Second, we chose the Chinese Diabetes Society (CDS) criteria to define MetS.22 The CDS criteria used BMI
rather than waist circumference as index to define “over-weight” or “obese”, because the application of the National Cholesterol Education Program-Adult Treatment Panel III criteria or the International Diabetes Federation criteria for Caucasians to East Asians would seriously underestimate the Chinese populations at risk of MetS.47,48 Third, all the
CRC patients were enrolled between 2005 and late 2011, during the 7-year period, remarkable advances in surgical techniques and postoperative adjuvant treatment options might potentially have caused a bias. What is more, MetS is a reversible condition associated with a western lifestyle,49
which could have underestimated the impact of MetS on CRC mortality.
In summary, we found that PLR is associated with MetS in CRC patients. PLR might be a useful marker to monitor an increased thrombotic status and inflammatory response in management of MetS, with respect to predicting the prognosis of CRC patients, and identifying novel treatment strategies. In daily clinical practice, much more attention should be paid to evaluating the presence and severity of MetS in CRC patients, especially with high PLR. Future studies are required to elucidate the relationship between PLR and MetS in CRC patients.
Disclosure
The authors report no conflicts of interest in this work.
References
1. Brenner H, Kloor M, Pox CP. Colorectal cancer. Lancet. 2014; 383(9927):1490–1502.
2. Chen W, Zheng R, Baade PD, et al. Cancer statistics in China, 2015. CA Cancer J Clin. 2016;66(2):115–132.
3. Malik S, Wong ND, Franklin SS, et al. Impact of the metabolic syndrome on mortality from coronary heart disease, cardiovascular disease, and all causes in United States adults. Circulation. 2004;110(10):1245–1250. 4. Expert panel on detection, evaluation, and treatment of high blood
cho-lesterol in adults. Executive summary of the third report of The National Cholesterol Education Program (NCEP) expert panel on detection, evalu-ation, and treatment of high blood cholesterol in adults (Adult Treatment Panel III). JAMA. 2001;285(19):2486–2497.
5. Ahmed RL, Schmitz KH, Anderson KE, Rosamond WD, Folsom AR. The metabolic syndrome and risk of incident colorectal cancer. Cancer. 2006;107(1):28–36.
OncoTargets and Therapy downloaded from https://www.dovepress.com/ by 118.70.13.36 on 25-Aug-2020
Dovepress impact of Plr and Mets on crc prognosis
6. Esposito K, Chiodini P, Colao A, Lenzi A, Giugliano D. Metabolic syndrome and risk of cancer: a systematic review and meta-analysis. Diabetes Care. 2012;35(11):2402–2411.
7. Yang Y, Mauldin PD, Ebeling M, et al. Effect of metabolic syndrome and its components on recurrence and survival in colon cancer patients. Cancer. 2013;119(8):1512–1520.
8. Stocks T, Lukanova A, Bjorge T, et al. Metabolic factors and the risk of colorectal cancer in 580,000 men and women in the metabolic syndrome and cancer project (Me-Can). Cancer. 2011;117(11):2398–2407. 9. You J, Liu WY, Zhu GQ, et al. Metabolic syndrome contributes to
an increased recurrence risk of non-metastatic colorectal cancer. Oncotarget. 2015;6(23):19880–19890.
10. Peng F, Hu D, Lin X, et al. Preoperative metabolic syndrome and prog-nosis after radical resection for colorectal cancer: The Fujian prospective investigation of cancer (FIESTA) study. Int J Cancer. 2016;139(12): 2705–2713.
11. Maeda K, Shibutani M, Otani H, et al. Inflammation-based factors and prognosis in patients with colorectal cancer. World J Gastrointest Oncol. 2015;7(8):111–117.
12. Mantovani A, Allavena P, Sica A, Balkwill F. Cancer-related inflam-mation. Nature. 2008;454(7203):436–444.
13. Colotta F, Allavena P, Sica A, Garlanda C, Mantovani A. Cancer-related inflammation, the seventh hallmark of cancer: links to genetic instabil-ity. Carcinogenesis. 2009;30(7):1073–1081.
14. Fernandez-Real JM, Ricart W. Insulin resistance and chronic car-diovascular inflammatory syndrome. Endocr Rev. 2003;24(3): 278–301.
15. Shoelson SE, Lee J, Goldfine AB. Inflammation and insulin resistance. J Clin Invest. 2006;116(7):1793–1801.
16. You J, Zhu GQ, Xie L, et al. Preoperative platelet to lymphocyte ratio is a valuable prognostic biomarker in patients with colorectal cancer. Oncotarget. 2016;7(18):25516–25527.
17. Tan D, Fu Y, Su Q, Wang H. Prognostic role of platelet-lymphocyte ratio in colorectal cancer: A systematic review and meta-analysis. Medicine (Baltimore). 2016;95(24):e3837.
18. Szkandera J, Pichler M, Absenger G, et al. The elevated preoperative platelet to lymphocyte ratio predicts decreased time to recurrence in colon cancer patients. Am J Surg. 2014;208(2):210–214.
19. Fang KC, Cheng YL, Su CW, et al. Higher platelet counts are associated with metabolic syndrome independent of fatty liver diagnosis. J Chin Med Assoc. 2017;80(3):125–132.
20. Chen YL, Hung YJ, He CT, et al. Platelet count can predict metabolic syndrome in older women. Platelets. 2015;26(1):31–37.
21. Akboga MK, Canpolat U, Yuksel M, et al. Platelet to lymphocyte ratio as a novel indicator of inflammation is correlated with the severity of meta-bolic syndrome: A single center large-scale study. Platelets. 2016;27(2): 178–183.
22. Chinese Metabolic Syndrome Study Cooperation. Suggestions about metabolic syndrome of Chinese diabetes society. Chin J Diab. 2004;12:156–161.
23. Edge SB, Compton CC. The American Joint Committee on Cancer: the 7th edition of the AJCC cancer staging manual and the future of TNM. Ann Surg Oncol. 2010;17(6):1471–1474.
24. O’Neill S, Bohl M, Gregersen S, Hermansen K, O’Driscoll L. Blood-based biomarkers for metabolic syndrome. Trends Endocrinol Metab. 2016;27(6):363–374.
25. Wu SH, Liu Z, Ho SC. Metabolic syndrome and all-cause mortality: a meta-analysis of prospective cohort studies. Eur J Epidemiol. 2010; 25(6):375–384.
26. Arbel Y, Havakuk O, Halkin A, et al. Relation of metabolic syndrome with long-term mortality in acute and stable coronary disease. Am J Cardiol. 2015;115(3):283–287.
27. Jaggers JR, Sui X, Hooker SP, et al. Metabolic syndrome and risk of cancer mortality in men. Eur J Cancer. 2009;45(10):1831–1838. 28. Ishino K, Mutoh M, Totsuka Y, Nakagama H. Metabolic syndrome: a novel
high-risk state for colorectal cancer. Cancer Lett. 2013;334(1):56–61.
29. Hirabara SM, Gorjao R, Vinolo MA, Rodrigues AC, Nachbar RT, Curi R. Molecular targets related to inflammation and insulin resistance and potential interventions. J Biomed Biotechnol. 2012;2012:379024. 30. Liu JJ, Druta M, Shibata D, et al. Metabolic syndrome and colorectal
cancer: is hyperinsulinemia/insulin receptor-mediated angiogenesis a critical process? J Geriatr Oncol. 2014;5(1):40–48.
31. Despres JP. Abdominal obesity and cardiovascular disease: is inflam-mation the missing link? Can J Cardiol. 2012;28(6):642–652. 32. Kloting N, Bluher M. Adipocyte dysfunction, inflammation and
meta-bolic syndrome. Rev Endocr Metab Disord. 2014;15(4):277–287. 33. Muller-Edenborn K, Leger K, Glaus Garzon JF, et al. Hypoxia
attenu-ates the proinflammatory response in colon cancer cells by regulating IkappaB. Oncotarget. 2015;6(24):20288–20301.
34. Mariani F, Sena P, Roncucci L. Inflammatory pathways in the early steps of colorectal cancer development. World J Gastroenterol. 2014;20(29): 9716–9731.
35. Nielsen VG, Nfonsam VN, Matika RW, et al. Colon and pancreas tumors enhance coagulation: role of hemeoxygenase-1. Blood Coagul Fibrinolysis. 2014;25(5):435–438.
36. Lee GH, Malietzis G, Askari A, et al. Is right-sided colon cancer dif-ferent to left-sided colorectal cancer? – a systematic review. Eur J Surg Oncol. 2015;41(3):300–308.
37. Benedix F, Kube R, Meyer F, et al. Comparison of 17,641 patients with right- and left-sided colon cancer: differences in epidemiology, perioperative course, histology, and survival. Dis Colon Rectum. 2010;53(1):57–64.
38. Meguid RA, Slidell MB, Wolfgang CL, Chang DC, Ahuja N. Is there a difference in survival between right- versus left-sided colon cancers? Ann Surg Oncol. 2008;15(9):2388–2394.
39. Ishizuka M, Nagata H, Takagi K, Iwasaki Y, Kubota K. Preoperative thrombocytosis is associated with survival after surgery for colorectal cancer. J Surg Oncol. 2012;106(7):887–891.
40. Sasaki K, Kawai K, Tsuno NH, Sunami E, Kitayama J. Impact of preoperative thrombocytosis on the survival of patients with primary colorectal cancer. World J Surg. 2012;36(1):192–200.
41. van Rooy MJ, Pretorius E. Metabolic syndrome, platelet activation and the development of transient ischemic attack or thromboembolic stroke. Thromb Res. 2015;135(3):434–442.
42. Wang YY, Lin SY, Liu PH, Cheung BM, Lai WA. Association between hematological parameters and metabolic syndrome compo-nents in a Chinese population. J Diabetes Complications. 2004;18(6): 322–327.
43. Long Y, Wang T, Gao Q, Zhou C. Prognostic significance of pretreat-ment elevated platelet count in patients with colorectal cancer: a meta-analysis. Oncotarget. 2016;7(49):81849–81861.
44. Zhao JM, Wang YH, Yao N, et al. Poor prognosis significance of pretreatment thrombocytosis in patients with colorectal cancer: a meta-analysis. Asian Pac J Cancer Prev. 2016;17(9):4295–4300. 45. Dunn GP, Old LJ, Schreiber RD. The immunobiology of cancer
immu-nosurveillance and immunoediting. Immunity. 2004;21(2):137–148. 46. Wiesner T, Bugl S, Mayer F, Hartmann JT, Kopp HG. Differential
changes in platelet VEGF, Tsp, CXCL12, and CXCL4 in patients with metastatic cancer. Clin Exp Metastasis. 2010;27(3):141–149. 47. Tan CE, Ma S, Wai D, Chew SK, Tai ES. Can we apply the National
Cholesterol Education Program Adult Treatment Panel definition of the metabolic syndrome to Asians? Diabetes Care. 2004;27(5): 1182–1186.
48. Xi B, He D, Hu Y, Zhou D. Prevalence of metabolic syndrome and its influencing factors among the Chinese adults: the China Health and Nutrition Survey in 2009. Prev Med. 2013;57(6):867–871.
49. van Duijnhoven FJ, Bueno-De-Mesquita HB, Calligaro M, et al. Blood lipid and lipoprotein concentrations and colorectal cancer risk in the European Prospective Investigation into Cancer and Nutrition. Gut. 2011; 60(8):1094–1102.
OncoTargets and Therapy downloaded from https://www.dovepress.com/ by 118.70.13.36 on 25-Aug-2020
OncoTargets and Therapy
Publish your work in this journal
Submit your manuscript here: http://www.dovepress.com/oncotargets-and-therapy-journal OncoTargets and Therapy is an international, peer-reviewed, open access journal focusing on the pathological basis of all cancers, potential targets for therapy and treatment protocols employed to improve the management of cancer patients. The journal also focuses on the impact of management programs and new therapeutic agents and protocols on
patient perspectives such as quality of life, adherence and satisfaction. The manuscript management system is completely online and includes a very quick and fair peer-review system, which is all easy to use. Visit http://www.dovepress.com/testimonials.php to read real quotes from published authors.
Dovepress
Dove
press
You et al
OncoTargets and Therapy downloaded from https://www.dovepress.com/ by 118.70.13.36 on 25-Aug-2020