The advantage of using platinum (Pt) in indus-trial applications is due to its unique properties, such as its catalytic activity, high melting point (1), ductility (2, 3) and chemical inertness over a wide range of temperatures (4, 5). Platinum has been used for biomedical components, specialty chemi-cals, fuel cells and for pollution control catalysts, such as in automobile exhausts, as well as for jew-ellery, thermocouples and the cathodic protection of ships’ hulls (3).
One typical application of platinum is in elec-tronics devices, with thick film conductors being among the major products (6). Alloying elements, selected from the platinum group metals and noble metals, are usually employed to help develop high-er strength or to protect a surface against deleterious service conditions (3). However, the addition of an alloying element may degrade the conductivity. Until now, the data available on the conduction properties of platinum alloys have been limited (7–12).
This present investigation will survey the
para-meters of thermal conductivity in various platinum alloys at high temperatures. First, the composition dependence of thermal conductivity will be inves-tigated and the results will be ordered according to the Periodic Table; second, the effect of work hardening will be investigated; and third, the tem-perature dependence of thermal conductivity will be surveyed.
Dependence of Thermal
Conductivity on Composition
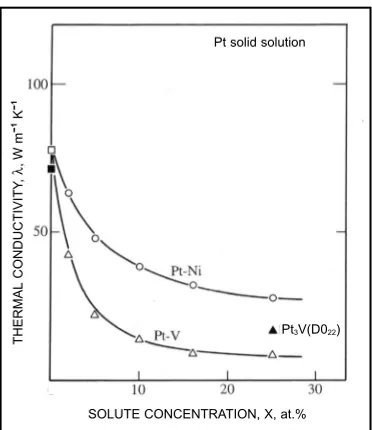
The thermal conductivities at 300 K for Pt alloys as a function of solute concentration, is shown in Figure 1, together with data for pure Pt (1, 13, 14). Vanadium (V) and nickel (Ni) were selected as solutes. Nickel belongs to the same col-umn as Pt in the Periodic Table (Pt-Ni is an isoelectronic system) while V is positioned hori-zontally far distant from Pt (Pt-V is a non-isoelectronic system). All the alloys used in this investigation have a face centred cubic (f.c.c.) single phase; whereas in the Pt-V system, the
DOI: 10.1595/147106705X24364
Thermal Conductivities of Platinum Alloys
at High Temperatures
OBSERVATIONS COMPLIANT WITH THE WIEDEMANN-FRANZ RELATION
By Yoshihiro Terada
Department of Metallurgy and Ceramics Science, Tokyo Institute of Technology, Meguro-ku, Tokyo 152-8552, Japan; E-mail: terada@mtl.titech.ac.jp
and Kenji Ohkubo and Tetsuo Mohri
Division of Materials Science and Engineering, Graduate School of Engineering, Hokkaido University, Sapporo 060-8628, Japan
order-disorder transformation occurs at a stoi-chiometry of 3 : 1. The data for Pt3V with a f.c.c. disordered structure and a D022ordered structure are from earlier work (15). Note that the heat treat-ment at 1573 K for 1 hour was undertaken to achieve the disordered state in Pt3V, while ageing at 1020 K for 168 hours was employed for the ordering reaction.
The thermal conductivity of pure Pt found in the present experiment was 77.8 W m–1K–1, which is slightly higher than values in the literature (1, 13, 14). It decreased monotonically with increasing solute concentration for both alloys. In the com-position ranges used, the conductivity-comcom-position plots are characterised by a sharp maximum at pure Pt in each case. The composition dependence is more pronounced in the Pt-V alloy, with the addition of only two atomic percent V reducing the thermal conductivity of Pt by one half. The rate of reduction in thermal conductivity becomes smaller at higher V concentrations, typically above ten atomic percent.
Figure 1 shows that the thermal conductivity increases on formation of the D022ordered phase
at composition Pt3V. This increase in conductivity by ordering seems to be a general feature which is also demonstrated by Pt3Cr with the L12structure, and in Ni3V(D022), Ni3Mn(L12) and Ni3Fe(L12) (15). Thermal conductivity is usually degraded by the scattering of carriers in the crystal lattice. Topological and configurational disorder, such as impurities, vacancies and lattice defects, impede the flow of heat carriers. Hence, well-ordered intermetallic compounds should have higher con-ductivity than their disordered alloys, assuming that the carrier concentrations do not change in both phases (16).
The essential question then to be answered is what is responsible for thermal conduction in Pt alloys. The thermal conductivity of metallic mate-rials is generally composed of an electronic component and a phonon component. The Wiedemann-Franz relation is a criterion for identi-fying the carrier of thermal conduction. The Wiedemann-Franz law states that at high tempera-tures the ratio of thermal to electrical conductivity (the reciprocal of the resistivity) for all metals is proportional to absolute temperature. When the electronic component is the dominant contributor to the total thermal conductivity, λ, the Wiedemann-Franz relation should hold (17–19), as in Equation (i):
λ= L T σ (i)
where Lis the Lorentz number, Tis the absolute temperature and σis the electrical conductivity. A universality constant of λ/σwas found to be equal to 7.5 × 10⁻⁶ΩK–1at 300 K for pure metals (17). The Wiedemann-Franz relation was examined for the Pt alloys under investigation here. Figure 2 shows the electrical conductivity (the inverse of electrical resistivity) plotted against the thermal conductivity for Pt-Ni and Pt-V alloys. The straight line indicates the Wiedemann-Franz rela-tion given by Equarela-tion (i) at 300 K. All the plots for the Pt alloys, including pure Pt, fall close to the line. This indicates that Pt alloys satisfy the Wiedemann-Franz relation at 300 K, even highly concentrated alloys.
The dominant carrier of thermal conduction in Pt alloys is, therefore, ascribed to an electron
Fig. 1 Composition dependence of thermal conductivity at 300 K in Pt-Ni and Pt-V alloys. Data for pure Pt are represented by the solid square on the axis (1, 13, 14). The recommended values for pure Pt in these data
sources are similar. The solid triangle is data for Pt3V
with the D022ordered structure (15)
SOLUTE CONCENTRATION, X, at.%
THERMAL CONDUCTIVITY
,
λ
,
W m
-1K
-1
Pt solid solution
rather than to a phonon: more specifically, the 6s
electrons are considered to be responsible for the thermal conduction.
Dependence on the Constituents
Figure 1, the dependence of thermal conduc-tivity on composition in Pt alloys, shows that there is a drastic decrease in thermal conductivity at low concentrations of solute, up to 2 atomic percent, from the value for pure Pt. It is well known that Pt has a wide solid solubility range for most alloying elements (20). In this section, we focus on the thermal conductivities of various Pt-2 at.% X alloys to identify the effect of solute, X, on the thermal conductivity of Pt.
Figure 3 summarises the thermal conductivities of Pt-2 at.% X alloys at 300 K. Solute X is arranged in Periodic Table order. It can be clearly observed that the addition of a solute element decreases the thermal conductivity of Pt. When solute X belongs to B-subgroup (Cu, Ga, Ge) in the first long period, the thermal conductivity decreases monotonically as the horizontal distance of X from the solvent Pt increases. This trend also holds for the solute X in the second long period. It is worth noting that Al and Si, which are locat-ed above Ga and Ge, respectively, also fall on the same line.
This trend was reported for electrical resistivity and is known as the Norbury rule (21). Norbury studied the change in electrical resistivity by the addition of solutes to Fe, Ni, Cu, Ag, Au and Mg and the molten states of Na and K. An
Fig. 2 Wiedemann-Franz relation for Pt-Ni and Pt-V alloys at 300 K. Alloy compositions are in atomic percent
Fig. 3 The thermal conductivity at 300 K of Pt-2 at.% X alloys as a function of the atomic number of solute X.
The solid black square shows the thermal conductivity for pure Pt.
Data for Pt-2 at.% Al and Pt-2 at.% Si are the solid diamond-shaped symbols. As, Pb and Bi are not soluble in Pt (20). There are no data for Tc because the alloy is unstable.
There are no data for Zn, Cd, Hg and Tl as their lower boiling temperatures prevent the alloy ingots being prepared by arc melting
Pt solid solution
Wiedemann-Franz relation
THERMAL CONDUCTIVITY, λ, W m-1K-1
ELECTRICAL CONDUCTIVITY
,
σ
,
10
6Ω
-1m
-1
pure Pt
2Ni
5Ni
2V 10Ni 16Ni 25Ni
10V
THERMAL CONDUCTIVITY
,
λ
,
W m
-1K
-1
Pt-2 at.% X
5V : Pt-Ni alloy : Pt-V alloy
25V
ELEMENT, X
empirical rule was found that the electrical resistiv-ity of binary alloys increases as the position in the Periodic Table of the solute element becomes hor-izontally distant from that of the host component. The current results imply that the Norbury rule generally holds for transport phenomena driven by
electrons. Unlike the case of B-subgroup elements, however, the behaviour is more complicated when the solute belongs to the remaining transition ele-ments. For the first long period, the thermal conductivity decreases monotonically as the dis-tance of X from Pt increases. This breaks down at Mn. The breakdown occurs at elements distant from Pt when solute X belongs to the third long period. It is notable that Re most significantly decreases the thermal conductivity of Pt. Also noteworthy is the fact that the thermal conductivi-ties are quite similar to one another for solutes belonging to the same column, typically demon-strated in the columns IVA, VA and VIII (Fe, Ru, Os). The data in Figure 3 also suggest that the ther-mal conductivity is more dependent on the column of solute X and is less dependent on the period.
Dependence on Work Hardening
In order to study the sensitivity to fabrication conditions, thermal conductivity was investigated as a function of reduction by cold rolling for some Pt alloys. Figure 4 shows results for pure Pt and for three Pt alloys. A slight decrease in thermal con-ductivity was observed in pure Pt, typically at above 30% of reduction by cold rolling, while a fairly constant value is maintained for high con-centrated alloys with lower conductivities. The results imply that the thermal conductivity of these alloys is chiefly determined by the initial composi-tion and hardly by the defect structure developed during fabrication.
Temperature Dependence
Thermal conductivities in Pt-Ni alloys as a function of temperature are shown in Figure 5 together with values for pure Pt from data sources represented by the broken line (13, 14). The ther-mal conductivity of pure Pt, measured in the present study, increases monotonically with increasing temperature and reaches approximately 95 W m–1 K–1at 1100 K. The monotonic increase is also confirmed for the reference data, though the magnitude is systematically lower. Adding Ni does not alter the general trend of monotonic increase and only results in shifting the entire data to lower values. Furthermore, close observation
Fig. 4 Thermal conductivity of pure Pt and Pt alloys as a function of reduction by cold rolling. The values of the thermal conductivities were measured at 300 K
Fig. 5 Thermal conductivity versus temperature for the Pt-Ni alloys. Data for pure Pt recommended in the data sources are shown by the dotted line (13, 14). The values from the data sources are similar
THERMAL CONDUCTIVITY
,
λ
,
W m
-1K
-1
REDUCTION BY COLD ROLLING, %
THERMAL CONDUCTIVITY
,
λ
,
W m
-1K
-1
TEMPERATURE, K Pt solid solution
Pt solid solution pure Pt
Pt-2 at.% Ir
Pt-16 at.% Ni
Pt-10 at.% V
pure Pt Pt-2 at.% Ni
Pt-5 at.% Ni
Pt-10 at.% Ni
reveals that the temperature coeffi-cient becomes larger with increasing nickel concentration and all the data seem to converge at higher tempera-tures.
The temperature coefficient, α, in
the temperature range between 300 to 1100 K was initially estimated from Equation (ii):
α= (1/λ300 K)(dλ/dT)
= (1/λ300 K){(λ1100 K– λ300 K)/(1100 – 300)} (ii)
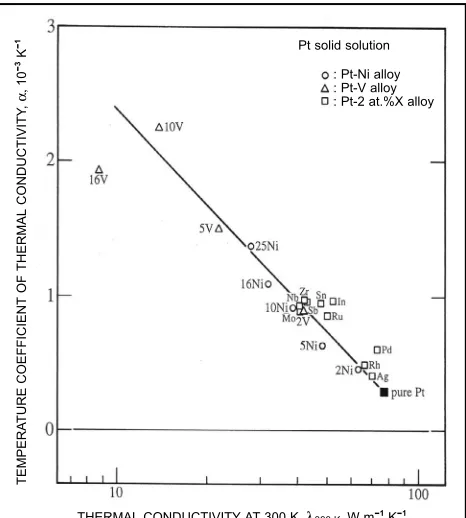
where λ300 Kand λ1100 Kare the thermal conductivi-ties at the indicated temperatures. In Figure 6, the temperature coefficients obtained for the Pt alloys are plotted against thermal conductivity at 300 K. The pure Pt had a thermal conductivity of 77.8 W m–1K–1at 300 K with a positive temperature coefficient of 2.9 × 10⁻⁴K–1. The thermal conduc-tivity monotonically decreases with increasing Ni concentration, accompanied by the increase in the coefficient. Such an inverse correlation is more clearly seen in the semi-log plot, see Figure 6. Interestingly, most Pt-V alloys have the same cor-relation except for Pt-16V alloy. Moreover, various selected elements from the second long period shown by open squares also keep the same correlation, which implies the correlation may have a universal feature. The inverse correlation between αand λ300 Kmay be a general feature for metallic materials, and has been well documented
not only for binary solid solutions but also for multicomponent materials, such as steels and superalloys, and for intermetallic compounds (15, 22).
Conclusions
Thermal conductivity in Pt alloys was compre-hensively surveyed as a function of solute concentration, work hardening and temperature. The results are as follows:
[1] The thermal conductivity of Pt alloys is main-ly determined by both alloy composition and temperature and is hardly influenced by work hardening.
[2] Alloying decreases the thermal conductivity of Pt, and the conductivity-composition relationship is characterised by a sharp maximum at pure Pt. The Wiedemann-Franz relation held for Pt alloys indicates the dominant carriers of thermal conduc-tion are electrons.
[3] It is found that thermal conductivity decreas-es monotonically as the position of the solute element in the Periodic Table becomes horizontal-ly more distant from that of Pt (but onhorizontal-ly for
Fig. 6 Correlation at 300 K, between the thermal conductivity and the temperature coefficient for Pt-Ni and Pt-V alloys. Each value has an alloy composition. Ten values for Pt-2 at.% X alloys are plotted.
Elements X are from the second long period
THERMAL CONDUCTIVITY AT 300 K, λ300 K, W m-1K-1
TEMPERA
TURE COEFFICIENT OF THERMAL CONDUCTIVITY
,
α
,
10
-3K
-1
B-subgroup elements). This is a counterpart of the Norbury rule originally proposed for electrical resistivity.
[4] A continuous increase in thermal conductivity
with temperature is observed for Pt alloys in the temperature range between 300 and 1100 K. The temperature coefficient and the thermal conductiv-ity are inversely correlated.
Kenji Ohkubo is a Technician in the Division of Materials Science and Engineering, Hokkaido University. His major field of interest is the determination and characterisation of thermal properties of metallic materials by the laser flash method.
Tetsuo Mohri is a Professor in the Division of Materials Science and Engineering, Hokkaido University. His major field of interest is the first-principles study on phase stability, equilibria and transformation for metallic systems.
Yoshihiro Terada is an Associate Professor in the Department of Metallurgy and Ceramic Science, Tokyo Institute of Technology. His main activities are in the thermal and mechanical properties of metallic materials for high temperature applications. The Authors
References 1 ‘Tables of Physical and Chemical Constants’, 16th
Edn., eds. G. W. C. Kaye and T. H. Laby, Longman, Essex, 1995
2 E. Gruneisen, Ann. Phys., 1908,25, 825
3 “Metals Handbook”, 10th Edn., eds. S. R. Lampman, T. B. Zorc, S. D. Henry, J. L. Daquila and A. W. Ronke, Vol. 2, ASM International, Materials Park, OH, U.S.A., 1990, p. 707
4 E. M. Wise and J. T. Eash, Trans. AIME, 1938, 128, 282
5 “Metals Handbook”, 9th Edn., eds. J. R. Davis, J. D. Destefani and G. M. Crankovic, Vol. 13, ASM International, Metals Park, OH, U.S.A., 1987, p. 793 6 N. M. Davey and R. J. Seymour, Platinum Metals Rev.,
1985, 29, (1), 2
7 W. A. Nemilow, Z. Anorg. Allg. Chem., 1934, 218, 33 8 O. A. Novikova and A. A. Rudnitskii, J. Inorg. Chem.
(USSR), 1957, 2, 1840
9 R. G. Stewart and R. P. Huebener, Phys. Rev., 1970, B1, 3323
10 W. M. Star, E. de Vroede and C. van Baarle, Physica, 1972, 59, 128
11 E. K. Azarbar and G. Williams, Phys. Rev., 1976, B14, 3301
12 J. R. Kuhn, C. L. Foiles and J. Bass, Phys. Lett., 1977, 63A, 401
13 Y. S. Touloukian, R. W. Powell, C. Y. Ho and P. G. Klemens, “Thermal Conductivity, Metallic Elements and Alloys”, Plenum, New York, 1970, p. 262 14 C. Y. Ho, R. W. Powell and P. E. Liley, ‘Thermal
conductivity of the elements: a comprehensive review’, J. Phys. Chem. Ref. Data, 1974, 3, 511 15 Y. Terada, K. Ohkubo, T. Mohri and T. Suzuki,
Mater. Sci. Eng. A, 1997, 239-240, 907
16 G. K. White, “Intermetallic Compounds, Principles”, Vol. 1, eds. J. H. Westbrook and R. L. Fleischer, John Wiley & Sons, Chichester, 1994, p. 1017
17 C. Kittel, “Introduction to Solid State Physics”, John Wiley & Sons, New York, 1953
18 J. M. Ziman, “Principles of the Theory of Solids”, Cambridge University Press, London, 1964 19 F. J. Blatt, “Physics of Electronic Conduction in
Solids”, McGraw-Hill, New York, 1968
20 “Binary Alloy Phase Diagrams”, 2nd Edn., ed. T. B. Massalski, ASM International, Materials Park, OH, U.S.A., 1990
21 A. L. Norbury, Trans. Faraday Soc., 1921, 16, 570 22 Y. Terada, T. Mohri and T. Suzuki, Proc. 3rd Pacific