University of South Carolina
Scholar Commons
Theses and Dissertations
12-14-2015
Vulnerable Species in a Changing Climate: The
Genomic Response of Antarctic Notothenioid
Fishes to Predicted Oceanic Conditions as a Model
of Physiological Plasticity and Adaptive Capability
Troy James Huth
University of South Carolina - Columbia
Follow this and additional works at:https://scholarcommons.sc.edu/etd Part of theBiology Commons
This Open Access Dissertation is brought to you by Scholar Commons. It has been accepted for inclusion in Theses and Dissertations by an authorized administrator of Scholar Commons. For more information, please [email protected].
Recommended Citation
Huth, T. J.(2015).Vulnerable Species in a Changing Climate: The Genomic Response of Antarctic Notothenioid Fishes to Predicted Oceanic Conditions as a Model of Physiological Plasticity and Adaptive Capability.(Doctoral dissertation). Retrieved from
VULNERABLE SPECIES IN A CHANGING CLIMATE: THE GENOMIC RESPONSE OF ANTARCTIC NOTOTHENIOID FISHES TO PREDICTED OCEANIC CONDITIONS AS A MODEL OF PHYSIOLOGICAL PLASTICITY AND ADAPTIVE
CAPABILITY. by
Troy James Huth Bachelor of Science
University of South Carolina, 2006 Master of Science
University of South Carolina, 2008
Submitted in Partial Fulfillment of the Requirements For the Degree of Doctor of Philosophy in
Biological Sciences College of Arts and Sciences University of South Carolina
2015 Accepted by:
Jeffry L. Dudycha, Major Professor Roger H. Sawyer, Committee Member
Sean P. Place, Committee Member W. Joe Jones, Committee Member Joseph M. Quattro, Committee Member
ii
iii DEDICATION
iv
ACKNOWLEDGEMENTS
To the members of my committee: I would like to thank: my advisor Dr. Jeff Dudycha for inviting me into his lab when I was without a home and providing me guidance on all things, even those not concerning Daphnia; Dr. Sean Place, for giving me the chance to continue my graduate education and continuing to work with me from across the country; Dr. Roger Sawyer, for providing me a start to my graduate studies so many years ago; and Dr. Joe Quattro and Dr. Joe Jones, for their time, effort and counsel throughout my program.
To my colleagues: I would like to thank all my fellow graduate students and researchers whom are too numerous to name here, whose efforts were invaluable to my growth as a researcher and a person. Particularly all those that ventured to the bottom of the earth to collect, experiment, and bring back the notothenioid samples that were critical to my research. Without this extraordinary effort none of this would have been possible.
v ABSTRACT
In its fifth report in 2014 the IPCC reinforced the contribution of anthropogenic CO2 to global climate change predicting widespread and significant changes to the global
climate over a relatively short time scale. The polar regions, including the Southern Ocean surrounding Antarctica, were identified as ecosystems that may experience the most rapid and severe changes. As the Southern Ocean is one of the coldest and most oceanographically stable regions on earth, the endemic fauna likely have no alternative habitats available for migration. Further compounding the challenge these species will face is the substantial degree of adaptation to the extreme cold and oxygen rich waters that may render these species particularly vulnerable to increasing temperatures and
pCO2.
The Perciform fishes of the suborder Notothenioidei dominate the fauna of the Southern Ocean. These fish have been relatively well studied under heat stress
conditions, but only recently have research efforts begun to discern the potentially compounding effects of the multiple stressors, notably increased temperature and pCO2.
This effort set out to analyze the genomic response of these fish to increased water temperature (4°C) and increased pCO2 levels (1000 μatm), and in doing so create a
wealth of sequence data to serve as the foundation for future research efforts for three notothenioid species Trematomus bernacchii, Pagothenia borchgrevinki and Trematomus newnesi.
vi
plasticity and potential adaptability of these fish to changing climate conditions in the Southern Ocean. While all three species demonstrated a widespread and substantial response to the multi-stressor condition, these responses varied in timing, duration, intensity of response, and the biological pathways driving the response. T.bernacchii
vii
TABLEOFCONTENTS
DEDICATION ... iii
ACKNOWLEDGEMENTS ... iv
ABSTRACT ...v
LIST OF TABLES ... viii
LIST OF FIGURES ... ix
INTRODUCTION ...1
CHAPTER 1.DE NOVO ASSEMBLY AND CHARACTERIZATION OF TISSUE SPECIFIC TRANSCRIPTOMES IN THE EMERALD NOTOTHEN,TREMATOMUS BERNACCHII ...5
CHAPTER 2.TRANSCRIPTOME WIDE ANALYSES REVEAL A SUSTAINED CELLULAR STRESS RESPONSE IN THE GILL TISSUE OF TREMATOMUS BERNACCHII AFTER LONG TERM ACCLIMATION TO MULTIPLE STRESSORS ...40
CHAPTER 3.RNA-SEQ REVEALS A DIMINISHED ACCLIMATION RESPONSE TO THE COMBINED EFFECTS OF OCEAN ACIDIFICATION AND ELEVATED SEAWATER TEMPERATURE IN PAGOTHENIA BORCHGREVINKI ...79
CHAPTER 4.GENOME WIDE EXPRESSION ANALYSIS OF THE DUSKY ROCKCOD TREMATOMUS NEWNESI,DEMONSTRATES A PARADOXICAL RESPONSE TO OCEAN ACIDIFICATION AND INCREASING SEA SURFACE TEMPERATURES ...110
CHAPTER 5.ABRIEF COMPARATIVE ANALYSIS OF THE DIFFERENTIAL GENE EXPRESSION OF T. BERNACCHII,P. BORCHGREVINKI AND T. NEWNESI UNDER THE MULTI-STRESSOR CONDITION ...140
REFERENCES ...151
viii
LISTOFTABLES
Table 1.1 Read Sequencing and de novo Assembly Statistics ...32 Table 1.2 T. bernacchii Unigene BLAST Comparison against 9 Teleost Fish ...32 Table 2.1: A summary of major gene ontology groups demonstrating differential gene expression at the 7d, 28d, and 56d time-points of the multi-stressor condition ...69 Table 3.1: Pagothenia borchgrevinki transcriptome assembly statistics ...103 Table 3.2: Pagothenia borchgrevinki transcriptome annotation statistics ...103 Table 3.1 Selection differentials (s) and selection gradients (β) for the correlated
phenotypic traits, natural logarithm transformed body length and eye diameter. ...52 Table 4.1 Trematomus newnesi transcriptome assembly statistics: Statistics for the
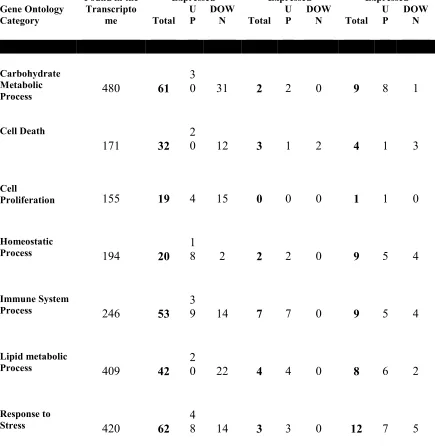
filtered de novo assembly were computed on the transcript and gene level. The # of sequences of the transcript level represent all surviving contiguous sequences, the # of sequences on the gene level represent the number of putative genes surviving based upon groupings of homologous transcripts ...135 Table 4.2: Trematomus newnesi transcriptome annotation statistics: Statistics for the filtered de novo assembly were computed on the transcript and gene level. The # of sequences of the transcript level represent all surviving contiguous sequences, the # of sequences on the gene level represent the number of putative genes surviving based upon groupings of homologous transcripts ...135 Table 4.3 Pathway up- and down-regulation at each time-point: The total number of genes expressed in the up- and down-regulated sub-groups for each multi-stressor time point (FDR ≤ 0.05) including genes associated with the gene ontology terms
carbohydrate metabolic process (GO:0005975), lipid metabolic process (GO:0006629), cell death (GO:0008219), cell proliferation (GO:0008283), response to stress
(GO:0006950), immune system process (GO:0002376), homeostatic process
ix
LISTOFFIGURES
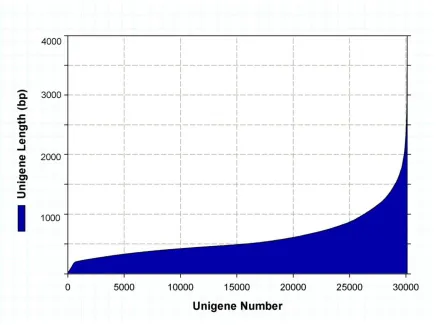
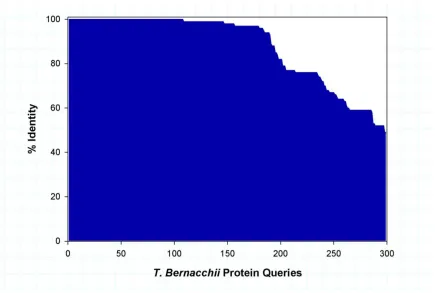
Figure 1.1 De novo assembly unigene length distribution. Length distribution of unigene sequence obtained from the de novo assembly. The unigenes are grouped from shortest to longest with each column representing the number of unigenes of that specific length. ..33 Figure 1.2 BLAST results: T. bernacchii protein sequences vs. unigene sequences. The percent identity of each known T. bernacchii full or partial protein sequence versus a unigene from the assembled transcriptome. 299 of 303 query sequences of known T. bernacchii protein sequences matched a unigene with an e-value cutoff of 10-10, and of those 184 matched a unigene at greater than 95% identity ...34 Figure 1.3 Tissue specific GO comparison. Unigenes expressed in at least one treatment were included in the gene ontology analysis. GO terms were determined using
BLAST2GO with an e-value cut off of 10-5, a minimum sequence filter of 25, and sorted
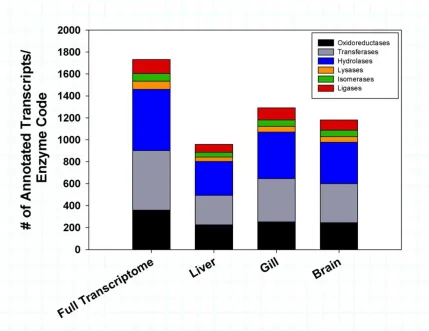
based on level 2 GO classifications. Any GO term that met the filter for the minimum number of sequences to include as a node (n = 25) was included in the comparison. ...35 Figure 1.4 Tissue specific enzyme code distribution of T. bernacchii. The stacked
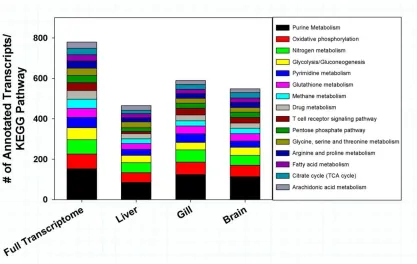
columns represent the number of annotated transcripts obtained from each tissue whose function could be classified by a specific enzyme code. As a comparison, the total number of enzyme codes identified in the fully assembled transcriptome is provided on the left column. The main enzyme classes included in this analysis were oxidoreductases (black bar), transferases (grey), hydrolases (blue), lysases (orange), isomerases (green) and ligases (red). Enzyme codes were determined using BLAST2GO with an e-value cut off of 10-5. ...36 Figure 1.5 Categorization of T. bernacchii unigenes to KEGG biochemical pathways. A KEGG biochemical pathway analysis was performed on the full transcriptome and individual tissue transcriptomes using every unigenes expressed in at least one treatment. The stacked columns represent the top 15 KEGG pathways found in the full
x
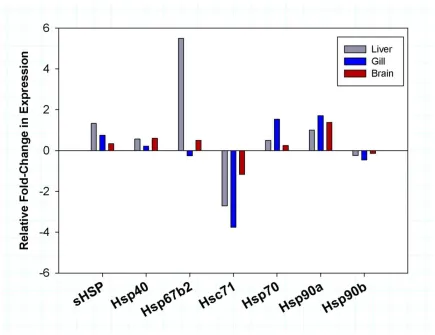
Figure 1.7 Differential expression of heat shock protein families in T. bernacchii.
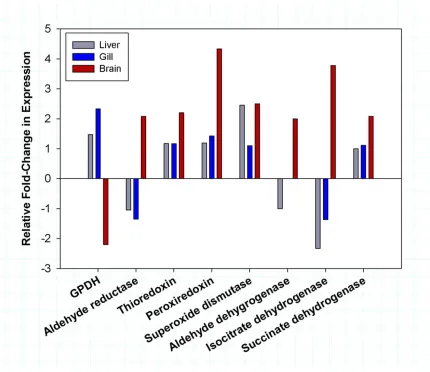
Relative fold-change in expression of annotated HSPs in +4 °C acclimated fish compared to control fish were obtained from the RNAseq analysis and directly compared across liver (grey), gill (blue) and brain (red). HSPs were grouped by gene family and the relative fold-change computed by averaging the change in expression of gene family constituents. ...39 Figure 1.8 Differential expression of redox regulator proteins in T. bernacchii. Relative fold-change in expression of annotated redox regulator proteins in +4 °C acclimated fish compared to control fish were obtained from the RNAseq analysis and directly compared across liver (grey), gill (blue) and brain (red). Redox proteins were grouped by gene family and the relative fold-change computed by averaging the change in expression of gene family constituents. ...40
Figure 2.1 Transcriptome wide sample similarity matrix and cluster dendrogram: the sample similarity matrix represents the cumulative similarity of each individual at each time-point as a reflection of transcriptome wide gene expression. Transcriptome wide expression is represented by all gene products that demonstrated an FDR ≤ 0.05 during the differential gene expression analysis. Portions of the matrix shown in yellow
demonstrate a high degree of similarity in the transcriptomic expression profiles between the two samples, with a value of 1 indicating the samples are identical; whereas those shown in grey demonstrate a lower degree of similarity, with a value of 0.65
demonstrating the most dissimilar expression profiles between two samples. As the samples are extracted from the same tissue and species, the degree of similarity in this case is a minimum of 0.65. The cluster dendrogram also groups samples based upon similar expression profiles, with those samples grouped most closely demonstrating more analogous transcriptomic expression responses...70 Figure 2.2 Over-representation analysis of gene ontology level 2 category molecular function: shown are gene ontology terms within the broad molecular function category (GO:0003674) that were significantly over-represented in the stressor treatments
compared to the reference transcriptome as determined by a Fisher's exact test (p < 0.01, categories containing only one gene are not included for readability). Subgroups of up- and down-regulated gene cohorts were created for each stressor time-point (7d, 28d and 56d) and compared to the GO term distribution of the reference transcriptome. The number in each category represents the total number of genes within that over-expressed GO term category (blank = 0).. ...71 Figure 2.3 Over-representation analysis of the gene ontology level 2 category biological process: gene ontology terms within the broad biological process category (GO:0008150) that were significantly over-represented in the stressor treatments compared to the
xi
compared to the GO term distribution of the reference transcriptome. The number in each category represents the total number of genes within that over-expressed GO term
category (blank = 0) ...72 Figure 2.4 Volcano plot - carbohydrate metabolic processes: this plot demonstrates differential gene expression for the 7d (diamonds/blue), 28d (circles/red), and 56 (triangles/purple) multi-stressor treatments (n = 4) as compared to the ambient control treatments (n = 4). All genes within the reference transcriptome associated with the gene ontology term carbohydrate metabolic process (GO:0005975) are included. Fold change is log2 adjusted whereas FDR is loge adjusted. Points demonstrating both an abs(fold change) ≥ 2 and a FDR ≤ 0.05 are considered significant and colored according to
treatment; whereas all other points are deemed not significant and are colored black ...73 Figure 2.5 Volcano plot – lipid metabolic process: this plot demonstrates differential gene expression for the 7d (diamonds/blue), 28d (circles/red), and 56 (triangles/purple) multi-stressor treatments (n = 4) as compared to the ambient control treatments (n = 4). All genes within the reference transcriptome associated with the gene ontology term lipid metabolic process (GO:0006629) are included. Fold change is log2 adjusted whereas FDR is loge adjusted. Points demonstrating both an abs(fold change) ≥ 2 and a FDR ≤ 0.05 are considered significant and colored according to treatment; whereas all other points are deemed not significant and are colored black ...74 Figure 2.6 Volcano plot – cell death: this plot demonstrates differential gene expression for the 7d (diamonds/blue), 28d (circles/red), and 56 (triangles/purple) multi-stressor treatments (n = 4) as compared to the ambient control treatments (n = 4). All genes within the reference transcriptome associated with the gene ontology term cell death
xii
considered significant and colored according to treatment; whereas all other points are deemed not significant and are colored black ...77 Figure 2.9 Volcano plot – immune system processes: this plot demonstrates differential gene expression for the 7d (diamonds/blue), 28d (circles/red), and 56 (triangles/purple) multi-stressor treatments (n = 4) as compared to the ambient control treatments (n = 4). All genes within the reference transcriptome associated with the gene ontology immune system process (GO:0002376) are included. Fold change is log2 adjusted whereas FDR is loge adjusted. Points demonstrating both an abs(fold change) ≥ 2 and a FDR ≤ 0.05 are considered significant and colored according to treatment; whereas all other points are deemed not significant and are colored black ...78 Figure 2.10 Volcano plot – homeostatic process: this plot demonstrates differential gene expression for the 7d (diamonds/blue), 28d (circles/red), and 56 (triangles/purple) multi-stressor treatments (n = 4) as compared to the ambient control treatments (n = 4). All genes within the reference transcriptome associated with the gene ontology term homeostatic process (GO:0042592) are included. Fold change is log2 adjusted whereas FDR is loge adjusted. Points demonstrating both an abs(fold change) ≥ 2 and a FDR ≤ 0.05 are considered significant and colored according to treatment; whereas all other points are deemed not significant and are colored black ...79 Figure 3.1 Transcriptome transcript size distribution: The length distribution (loge
adjusted) of transcripts with a minimum length of 200bp resulting from de novo assembly (grey), following CD-HIT-EST transcript clustering with a percent identity requirement of 95% (blue) and transcript filtering after RSEM requiring an expression level of at least 1.0 FPKM (yellow). ...104 Figure 3.2 Top BLAST result species: Following BLASTx searches of the transcripts of the reference transcriptome against the NCBI nr database, up to 10 BLAST hits were obtained for each transcript. The BLAST hit for each sequence with the lowest e-value was designated as the top hit and the species which the result match originated was recorded. The graph represents the total number of BLAST hits out of all top BLAST hits mapped to each particular species ...105 Figure 3.3 P. borchgrevinki transcriptome level GO comparison: A comparison of the GO term distribution for the broad category of molecular function is provided for the
previous P. borchgrevinki transcriptome assembly and annotation conducted by Bilyk and Cheng (2014) and the current transcriptome assembly and annotation. To provide a more direct comparison, the data bars represent the proportion of terms assigned to the specific GO term listed along the x-axis out of all GO terms within that broad category.106 Figure 3.4 Sample level gene expression correlation matrix: The correlation matrix
xiii
0.5 and yellow representing a correlation of 0.9. Cluster dendrograms are provided to demonstrate the relationships between the expression profiles of each individual sample.107 Figure 3.5 GO molecular function expression: Molecular function gene ontology terms with more than 5 differentially expressed genes per category (FDR ≤ 0.05) across all time-points are shown for each time-point. Yellow bars indicate the number of
up-regulated genes associated with that GO term and blue bars indicate the number of down-regulated genes associated with that GO term ...108 Figure 3.6 GO biological process expression: Biological process gene ontology terms with more than 5 differentially expressed genes per category (FDR ≤ 0.05) across all time-points are shown for each time-point. Yellow bars indicate the number of
up-regulated genes associated with that GO term and blue bars indicate the number of down-regulated genes associated with that GO term ...109 Figure 3.7 Pathway expression summary: The number of differentially expressed genes (FDR ≤ 0.05) for the biological process gene ontology categories: response to stress (GO:0006950), immune system process (GO:0002376), homeostatic process
(GO:0042592), carbohydrate metabolic process (GO:0005975), lipid metabolic process (GO:0006629), cell proliferation (GO:0008283) and cell death (GO:0008219) are shown for each multi-stressor treatment as compared to the control for the 7d, 28d and 56d time-points. A bar above the black line indicates the number of up-regulated genes within that GO category, whereas the bar below the black lines indicates the number of
down-regulated gene within that GO category ...110 Figure 4.1 Sample level gene-expression correlation matrix: The correlation matrix demonstrates the level of transcriptome wide gene expression correlation from 0-1, with 0 indicating no correlation and 1 indicating an identical expression profile. The current correlation matrix is indexed between 0.5 and 0.9 with black representing a correlation of 0.5 and yellow representing a correlation of 0.9. Cluster dendrograms are provided to demonstrate the relationships between the expression profiles of each individual sample.137 Figure 4.2 The stress response heatmap: The heatmap displays all differentially regulated genes (FDR ≤ 0.05) within the GO categories response to stress (GO:0006950), immune system process (GO:0002376), and homeostatic process (GO:0042592) for each multi-stressor time-point as compared to the control (7 days, 28 days, and 42 days). The fold change is log2 scaled with blue representing down-regulation, black indicating no significant regulation, and yellow representing up-regulation. Any changes with an absolute fold change greater than log2(2) (abs 4X) are represented as the maximum. The
xiv
translation (GO:0006412) for each multi-stressor time-point as compared to the control (7 days, 28 days, and 42 days). The fold change is log2 scaled with blue representing
down-regulation, black indicating no significant down-regulation, and yellow representing up-regulation. Any changes with an absolute fold change greater than log2(2) (abs 4X) are
represented as the maximum. The gene symbol is included for each gene with a number within parentheses indicating an isoform of that gene. Each gene symbol also includes an additional symbol associating that gene with a GO category in the following manner: transcription = “-” and translation = “+” ...139 Figure 4.4 – Metabolism, proliferation and death heatmap: The heatmap displays all differentially regulated genes (FDR ≤ 0.05) within the GO categories carbohydrate metabolic process (GO:0005975), lipid metabolic process (GO:0006629), cell
proliferation (GO:0008283) cell death (GO:0008219), for each multi-stressor time-point as compared to the control (7 days, 28 days, and 42 days). The fold change is log2 scaled
with blue representing down-regulation, black indicating no significant regulation, and yellow representing up-regulation. Any changes with an absolute fold change greater than log2(2) (abs 4X) are represented as the maximum. The gene symbol is included for each
gene with a number within parentheses indicating an isoform of that gene. Each gene symbol also includes an additional symbol associating that gene with a GO category in the following manner: carbohydrate metabolic process = “#”, lipid metabolic process = “=”, cell proliferation = “+”, and cell death = “X” ...140 Figure 5.1 The total number of differentially expressed genes (FDR ≤ 0.05, fold change ≥ 2) for T. bernacchii (black), P. borchgrevinki (dark grey), and T. newnesi (light grey) in the multi-stressor treatment as compared to the control at each time-point 7 days, 28 days and 42/56 days for T. newnesi and T. bernacchii/P. borchgrevinki, respectively. Bars above the x-axis indicate up-regulated genes; bars below the x-axis indicate
xv
1
INTRODUCTION
As the consensus on global climate change becomes more resolute within the scientific community, the focus has begun to shift from whether global climate change is occurring, to how these changes will impact the biosphere. While no region is likely to escape the effects of global climate change, certain ecosystems may be particularly vulnerable (Pachauri et al., 2014). The polar regions are among those identified as most vulnerable to climate change (Pachauri et al., 2014). In fact the Southern Ocean
surrounding Antarctica has already experienced a warming of approximately 0.8 ºC (Gille, 2002).
When the Drake passage opened some 14-25 million years ago the circumpolar current formed around Antarctica, leading to the formation of one of the coldest more oceanographically stable environments on Earth (Livermore, Nankivell, Eagles, &
2
Nogales, & Downing, 2000), and anti-freeze proteins (Cheng, Cziko, & Evans, 2006; A. L. DeVries & Cheng, 2005). Other adaptations to the extreme cold include increased mitochondrial densities, reduction in hematocrit, and reductions in cardiovascular output (D’Amico et al., 2002; Johnston, Calvo, GuderleyY, & D, 1998; Lucassen, Schmidt, Eckerle, & Pörtner, 2003).
A unique aspect of Notothenioids is the apparent loss of an inducible heat shock response, and thus these fish have been relatively well studied by polar researchers with a particular focus upon the impact of heat stress on the physiology of these fish (Bilyk & DeVries, 2011; Bilyk, Evans, & DeVries, 2012; Davison, Franklin, & Carey, 1990; Forester, Franklin, H, & Daviso, 1987; H. O. Pörtner, Lucassen, & Storch, 2005; Esme Robinson & Davison, 2008; Sleadd et al., 2014; Somero & DeVries, 1967). However, addressing multiple simultaneous stressors that are likely more indicative of future oceanic conditions is essential. Prior results from non-polar marine organisms have indicated that multiple simultaneous stressors may have a greater effect than the sum of the individual stressors (O’Donnell, Hammond, & Hofmann, 2009; Rosa & Seibel, 2008; Schulte, 2007). This synergistic effect has recently been confirmed with these same three species in multiple physiological pathways where synergistically increased temperature and pCO2 was found to have a greater effect than the sum of the two stressors (Enzor, Zippay, & Place, 2013; Enzor & Place, 2014, 2015).
3
no genomic analyses assessing the synergistic effects of multiple simultaneous stressors across multiple interacting pathways, no less studying the entire transcriptome.
Recognizing that the analysis of a limited range of molecular or cellular responses would no longer be sufficient (Gretchen E Hofmann & Todgham, 2010; Place, O’Donnell, & Hofmann, 2008) I set out to fill this gap and provide analyses of the notothenioid stress response to synergistic stressor from the transcriptomic to the gene level.
However, in order to conduct the analysis of the multi-stressor condition it was necessary to create the genomic resources by which gene expression would be
determined. Utilizing newly developed methods to accurately assemble billions of short read raw sequence data (Grabherr et al., 2011; Haas et al., 2013), I was able to create raw transcriptomic libraries that were then annotated utilizing sequencing homology to known sequences (Altschul, Gish, Miller, Myers, & Lipman, 1990; Conesa et al., 2005). These transcriptomic libraries not only made it possible to determine differential expression under the multi-stressor condition, they established valuable transcriptomic databases for these notothenioid species. Once the initial genomic resources were in place I was able to proceed with the main thrust of the study, to analyze physiological pathways separately and in conjunction across the entire transcriptome. Thereby enhancing our understanding of the physiological plasticity of notothenioids to forecasted conditions of the Southern Ocean, and to impute these findings upon the survivability of these same species on a changing planet.
Differential gene expression analyses were initially conducted on the
4
5 CHAPTER 1
DE NOVO ASSEMBLY AND CHARACTERIZATION OF TISSUE SPECIFIC TRANSCRIPTOMES IN THE EMERALD NOTOTHEN, TREMATOMUS
BERNACCHII.1
6 1.1 ABSTRACT
Background
The notothenioids comprise a diverse group of fishes that rapidly radiated after isolation by the Antarctic Circumpolar Current approximately 14-25 million years ago. During this period, unique adaptations evolved in several members of this fish clade, such as the tolerance of sub-freezing temperatures. Although able to thrive under temperatures below the thermal limits for most organisms, the astounding stability of their environment has resulted in an extremely narrow window of physiological
tolerances. Given that evolutionary adaptation has led to finely tuned traits with narrow physiological limits in these organisms, this system provides a unique opportunity to examine physiological trade-offs and limits of adaptive responses to environmental perturbation. As such, notothenioids have a rich history with respect to studies attempting to understand the vulnerability of polar ecosystems to the negative impacts associated with global climate change. Unfortunately, despite being a model system for
understanding physiological adaptations to extreme environments, we still lack fundamental molecular tools for much of the Nototheniidae family.
Results
7
reads produced a functional transcriptome library of T. bernacchii containing 30,107 unigenes, 13,003 of which possessed significant homology to a known protein product. Digital gene expression analysis of these extremely cold adapted fish reinforced the loss of an inducible heat shock response and allowed the preliminary exploration into other elements of the cellular stress response.
Conclusions
Preliminary exploration of the transcriptome of T. bernacchii under elevated temperatures enabled a semi-quantitative comparison to prior prior studies aimed at characterizing the thermal response of this endemic fishwhose size, abundance and distribution has established it as a pivotal species in polar research spanning several decades.
The comparison of these findings to previous studies demonstrates the efficacy of transcriptomics and digital gene expression analysis as tools in future studies of polar organisms and has greatly increased the available genomic resources for the suborder Notothenioidei, particularly in the Trematominae subfamily.
1.2 INTRODUCTION
8
coldest, most oceanographically stable environment on the planet. However, in direct opposition to this highly stenothermic environment are the profound environmental extremes produced by the transition from 24 hours of sunlight to complete darkness over the winter months, resulting in significant variation in primary productivity. As a result, Antarctic marine organisms inhabiting these ice-laden waters have faced unique
metabolic and physiological challenges for survival and persistence. The impacts of low temperatures and seasonally limited food availability have long been recognized as primary selective forces driving the evolution of the many endemic species found in Antarctica today (Arntz et al., 1994; A Clarke, Johnston, Murphy, & Rogers, 2007; Andrew Clarke, 2011; Peck, Clark, Morley, Massey, & Rossetti, 2009; Peck, Webb, & Bailey, 2004; H. Pörtner, Peck, & Somero, 2006). In addition to the high degree of endemism produced by these evolutionary processes, a wide-array of functional
9
Specialization has thus forced some of these species to lead a less active, rather sluggish lifestyle.
Although a significant amount of sequencing work has been done to elucidate the evolutionary history and phylogenetic relationships among these unique fishes, much of the available sequence information is constrained to a few highly conserved genes such as ribosomal and mitochondrial genes, or highly specified genes such as the antifreeze glycoprotein genes. Recent advances in DNA sequencing technology have led to a significant increase in the availability of molecular tools to ecologists and physiologists. A particular research niche that is poised to benefit greatly from this rapid increase in sequence data is the field of polar biology. The availability of well-annotated
transcriptomes from a variety of polar species will provide the groundwork for future functional genomics studies aimed at elucidating the impact of global climate change on polar ecosystems. With the application of next generation sequencing tools in an
10
assessing the plasticity of this highly stenothermic family of fishes and the cost of adaptation to such a cold stable environment (Bilyk & DeVries, 2011; Davison,
Axelsson, Forster, & Nilsson, 1995; Davison, Franklin, & McKenzie, 1994; a L. DeVries & Wohlschlag, 1969; Enzor et al., 2013; G E Hofmann et al., 2000; Place et al., 2004; Somero & DeVries, 1967). While earlier attempts at using heterologous hybridizations to a cDNA array of a temperate goby provided insight into the transcriptional response of highly conserved genes in this species (Buckley & Somero, 2009), we still lack a robust approach to functional genomics in these unique fish. Here we describe the de novo
assembly and annotation of the transcriptome of the emerald notothen, T. bernacchii. In addition, we provide a glimpse into the tissue specific response to thermal stress at the level of the transcript that highlights the sensitivity and utility of these applications in polar fish.
1.3 RESULTS AND DISCUSSION
Sequence data and de novo assembly
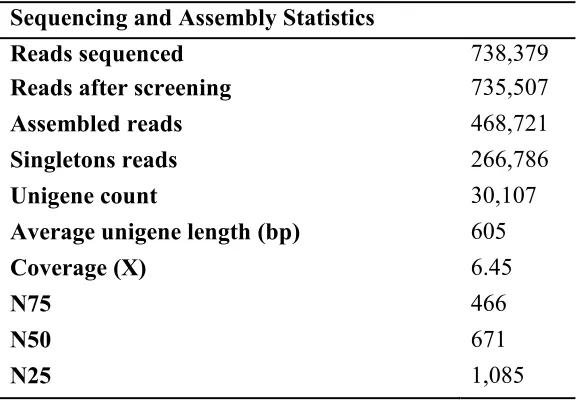
Roche 454 sequencing generated a total of 738,379 unpaired reads across six samples with an average length of 335.80 bp. The raw data were deposited at the NCBI Sequence Read Archive under the study accession number [SRP026018]. After sequence trimming for adapter removal, and screening of sequences based on quality and
ambiguity scores, 735,507 reads remained with an average length of 320.98 bp. De novo
11
N75, N50, and N25 of 466bp, 671bp, and 1,085bp respectively (Table 1.1). The unigene length distribution can be seen in Figure 1.1.
Overall, the resulting number of unigenes produced in our assembly is in line with results reported in previous studies utilizing Roche 454 data for de novo full
transcriptome assemblies of other fish species, including 1,150,339 reads yielding 36,811 unigenes with an average length of 888 bp in Common Carp (Cyprinus carpio) (Ji et al., 2012); and 1,004,081 reads yielding 33,191 unigenes with an average length of 991 in Asian Seabass (Lates calcariefer) (Xia et al., 2013). Furthermore, our average coverage (6.45X) is comparable to 454 de novo transcriptome assemblies conducted with similar number of sequencing reads (Logacheva et al., 2011); and possesses a similar percentage of reads mapping back to the unigenes (63.7%) as well (Ferreira de Carvalho et al., 2013; Logacheva et al., 2011).
To further validate our transcriptome, we compared the alignment and similarity of our unigenes to the 303 known full and partial T. bernacchii sequences currently available on NCBI at the time of our study using BLASTx. This comparison yielded 236 matches with an e-value < 10-10, of which 180 sequences possessed a percent identity > 95% (Fig. 1.2). Despite the limited sequence data available for T. bernacchii, these alignment metrics indicate a relatively accurate transcriptome assembly.
12
that this product would be found in the liver, gill or brain tissues that were sequenced in this effort. Another unmatched query represented a partial of E3 ubiquitin protein ligase 2; however, six different unigenes (1260, 4958, 15902, 18843, 22152, and 27842) matched E3 ubiquitin ligase-like proteins during annotation, thus it is likely that this partial query sequence did not overlap with the available assembled sequence of the unigenes, which themselves are not complete representations of the entire coding region of E3 ubiquitin. The last query that failed to align was that of a putative voltage-activated sodium channel alpha subunit (SCNA) which are functionally conserved and with lengths ranging between 3300-3500bp in teleost fish (Novak et al., 2006). As the partial sequence available for T. bernacchii SCNA is only 276bp, it is very likely our sequencing efforts simply failed to provide areas of overlap with the partial cDNA sufficient to align it to a unigene.
In an effort to further validate our transcriptome assembly, we compared our assembly to the transcriptomes of nine other prior sequenced teleost fish including:
Notothenia coriiceps, Chaenocephalus aceratus, Pleuragramma antarcticum,
Gasterosteus aculeatus, Takifugu rubripes, Oryzias latipes, Tetraodon nigroviridis,
13
(16,822 hits e-value < 10-3, 10,033 hits e-value < 10-10) and C. aculeatus (14,533 hits e-value < 10-3, 10,138 hits e-value < 10-10). BLASTx searches against the non-polar fish in our analysis yielded results similar to previous comparisons between the transcriptomes of notothenioid fishes and those of non-polar fish species (Table 1.2) (Coppe et al., 2013).
Annotation, classification, and analysis
BLASTx results using the unigene sequences as queries against the non-redundant protein sequences (nr) database at NCBI yielded 9,243 significant alignments (e-value 10
-3), and when combined with an additional 3,760 BLASTn results from our searches
against the nucleotide collection (nr/nt) database, yielded a total of 13,003 unigene sequences with a significant BLAST result. Of these results, 7,677 unigene sequences mapped to GO terms using the B2GO software package. Ultimately InterProScan results merged with B2GO annotations yielded a total of 6,528 fully annotated unigene
sequences. The final distribution of annotated unigenes included 5,351 unigenes sequences with a significant BLAST result only, 1,149 unigene sequences mapped in B2GO, and 6,528 unigene sequences fully annotated with GO terms. Overall,
14
Tissue specific gene expression
The transcriptome wide gene ontology in WEGO format yielded 14,181 (~35%) GO annotation results for cellular component, 17,515 (~44%) GO annotation results for biological process, and 8,447 (~21%) GO annotation results for molecular function in T. bernacchii. For the most part, expression levels associated with individual GO
classifications were found to be very similar across the entire transcriptome and
individual tissues (Fig. 1.3). However, some gene expression trends can be detected that are likely associated with differences in functional roles of the tissues. For example, when comparing the biological processes between tissues, the role of the liver in protein metabolism is evident with 24.7% of its total biological processes dedicated to metabolic processes as compared to 22.9% in the gill and 21.1% in the brain. Also, the gill tissue demonstrated elevated representation for the GO classification ‘response to stimuli’,
perhaps due to their more immediate exposure to the external environment,with
approximately 8.2% of biological processes dedicated to this function as opposed to 5.1% in the brain.
The molecular function of expressed transcripts also displayed variation that mirror physiological differences between the tissues. For instance, despite being a
15
concentrations of two isoforms of the antioxidant enzyme family superoxide dismutase (SOD1 and SOD2) are relatively higher in gill tissue compared to liver tissue and total SOD activity is also elevated in gill tissue. As for cellular components, each tissue largely mirrored one another and the transcriptome as a whole (Fig. 1.3).
Enzyme code distributions for each tissue calculated by the main enzyme classes: oxidoreductases, transferases, hydrolases, lysases, isomerases, yielded the following: liver (359, 542, 559, 74, 71, 127), gill (252, 269, 308, 39, 44, 72) and brain (245, 355, 377, 52, 59, 93) respectively (Fig. 1.4). The liver displayed the greatest variety of enzymes, commiserate with its involvement in protein and lipid metabolism.
A comparison of the unigenes against the KEGG database, a resource for
16
114 KEGG pathways and 592 enzymes; gill tissue matched 1,397 unique sequences to 114 KEGG pathways and 674 enzymes; brain tissue matched 1,272 unique sequences to 111 KEG pathways and 620 enzymes.
Digital gene expression analysis
17
expression levels of 10,084 unigene pairs showed 4,369 unigenes were down-regulated and 3,065 unigenes were up-regulated at least 2-fold or greater. For expression analysis of the brain tissue we compared the expression levels of 9,044 unigene pairs, of which 3,347 were down-regulated and 3,965 were up-regulated at least 2-fold.
Below we discuss the general gene expression trends that emerged from our preliminary RNAseq analyses with respect to the most highly expressed gene families under ambient conditions. In addition, in order to more fully interpret the effects of long-term acclimation to elevated temperatures on T. bernacchii, we extended our analysis beyond that of the most highly represented gene families, and in doing so, focus on three particular areas that encompass the cellular response to elevated temperature observed in
T. bernacchii.
Tissue specific gene expression profiles under ambient conditions
18
acclimation to elevated temperatures. Analysis of the liver transcriptome of fish
acclimated to +4 °C for 28 days showed apolipoproteins were considerably up-regulated with the 14 kda apoliprotein undergoing a 7.1-fold increase to represent 5.10% of all transcripts and apolipoprotein A-I undergoing a 11.5-fold increase to represent 4.65% of all transcripts. Given their role in lipid mobilization and transport, it seems plausible this significant increase in apolopiproteins is playing an important role in offsetting the rapid increase in metabolic demands previously associated with the acclimatory response of T. bernacchii to elevated temperature ( & Place, 2014).
In addition to the liver, we found similar patterns of gene expression in the brain tissue of T. bernacchii and compared to those of D. mawsoni. Chen and colleagues report a number of transcripts that are involved in the protection, maintenance, and repair of neural tissue, including S100β and ependymin-1, which are highly represented in the transcriptome of D. mawsoni brain tissue (Chen et al., 2008). Under ambient temperature conditions, S100β and ependymin-1 comprise 0.30% and 0.18% respectively of the expressed genes in T. bernacchii brain tissue, and when exposed to a thermal stress, the expression of these two transcripts increased significantly. In fish acclimated to +4 °C, S100β increase over 13-fold, representing 2.21% of all expressed transcripts and ependymin-1 increased by greater than 7-fold to represent ~2% of all expressed
transcripts in the brain. Although only semi-quantitative at this point, these data suggest
T. bernacchii maintain a strong capacity to respond to environmental conditions perturbing to neural function.
19
from fish acclimated to +4 °C, we saw an overall down-regulation of many of the most highly expressed transcripts found in ambient fish including, 60s ribosomal proteins (8.8-fold), zinc finger proteins (14.3-(8.8-fold), MAPKs (4.7-fold) and translation initiation factor eif2b (3.4-fold). Interestingly, many of these genes were reported to show a moderate up-regulation (<1.5-fold) after an acute heat shock event (4h at +4 °C) in a previous study employing a transcriptome wide analysis of T. bernacchii (Buckley & Somero, 2009). The differences in gene expression profiles between these two studies likely capture the transition that occurs between immediate response to stress and the long-term
physiological adjustments that follow. The general down-regulation of gene families involved in transcription and translation in our long-term treatment may indicate a diminished capacity for protein turnover at elevated temperatures. However, despite a general down-regulation of one of the cells major energy consuming pathways in the gill tissue, we see a 2.5-fold regulation of cytochrome c oxidase I and a 1.5-fold up-regulation of cytochrome b which mirrors the increased capacity for aerobic metabolism found under conditions of acute thermal stress in T. bernacchii (Buckley & Somero, 2009). These findings, along with the strong up-regulation of apolipoproteins in the liver suggest that mobilization of energy stores and ATP production continue to play a central role in the capacity of T. bernacchii to mitigate the effects of elevated temperatures long-after cellular restructuring has likely occurred.
Protein homeostasis and the Heat Shock Response (HSR): Heat shock proteins (HSPs) have long been known to play a significant role in folding of nascent polypeptides as well as the rescue and refolding of proteins under conditions of cellular stress (Feder &
20
families being highly conserved across all taxa, Antarctic notothenioids display divergent expression patterns that might be related to environmental constraints. Previous studies have observed that inducible HSP isoforms and protein-specific chaperones are
21
Place & Hofmann, 2005; Place et al., 2004). Intriguingly, although no significant changes were seen in the inducible HSP isoforms, we did observe a significant decrease in
expression levels of the constitutive isoform, Hsc71, in liver and gill (2.7 & 3.7-fold respectively). This down-regulation of Hsc71 was also accompanied by moderate decreases in the constitutively expressed Hsp90β (Fig. 1.7).
In addition to the major molecular chaperone families represented in the
transcriptome, we also identified a number of contigs with homology to several members of the α-crystallin-type super family, collectively referred to as small heat shock proteins (sHSPs). Although sHSPs are known have similar cytoprotective effects as those found with larger size class molecular chaperones, they are often found expressed in lower abundances and in some instances their function may be non-essential for cell survival (Bartelt-Kirbach & Golenhofen, 2014; MacRae, 2000; Narberhaus, 2002). In our study, we found the sHPSs showed tissue specific responses with sHSPs in the liver displaying the greatest magnitude change. After acclimation to +4 °C, transcript levels for
Hsp27/B1, Hsp30/B11 and α-crystallin all showed a 2-fold or greater up-regulation in liver tissue. However, in gill and brain tissue, expression of these sHSPs were either not detected or down-regulated, except in the case of α-crystallin in the brain tissue which displayed a 3-fold increase.
As this is only a preliminary characterization of the transcriptome of T. bernacchii
22
elevated temperatures, potentially as a means to conserve energy. We have previously shown metabolic rates in T. bernacchii are initially elevated when acclimated to +4 °C but gradually return to baseline levels (Enzor et al., 2013). A general reduction in transcription rates could represent physiological trade-offs associated with long-term physiological adjustments necessary to reduce the cellular demand for oxygen. Alternatively, these reductions in capacity for protein synthesis and chaperoning may represent hallmarks of temperature compensation at the cellular level in these fish. These results represent potentially novel insight into the thermal acclimation of these fish and highlight the sensitivity and utility of these approaches for understanding physiological responses in this system.
Cellular Stress Response (CSR)
23
HSR has largely been lost, these additional CSR mechanisms could play a more significant role in maintaining cellular homeostasis.
The alteration of cellular redox potential due to stress is a major trigger of the CSR and the expression of certain reductases, redoxins and dehydrogenases signify a robust CSR to changing conditions (Adler, Yin, Tew, & Ronai, 1999; Kültz, 2005). We analyzed these redox regulators using our dataset to provide preliminary insight into the broader CSR of T. bernacchii. Each tissue demonstrated a general trend of up-regulation of redox regulators with all but three of the annotated redox regulators being up-regulated in at least two tissues (aldehyde reductase, aldehyde dehydrogenase, isocitrate
dehydrogenase), and 4 of 8 up-regulated in all three tissues (thioredoxin, peroxiredoxin, superoxide dismutase, succinate dehydrogenase) (Fig. 1.8). The brain tissue displayed the greatest magnitude of response for redox regulators, with 7 of 8 redox regulators up-regulated 2-fold or greater compared to the liver in which only 5 were found up-up-regulated and only 1 redox regulator up-regulated 2-fold or more (Fig. 1.8). While T. bernacchii
does appear to up-regulate redox regulators as part of its CSR, much like the HSPs, the ability to increase the expression of redox regulators may be moderated to some extent and is highly tissue specific.
High Mobility Group B1 protein and its role as a global temperature sensor
24
(Podrabsky & Somero, 2004). The expression levels of HMGB1 in T. bernacchii support the idea that HMGB1 is highly responsive to temperature and may serve as a gene expression temperature sensor in fish. However, HMGB1 expression patterns in T. bernacchii dramatically differ with those reported for A. limneaus. We found HMGB1 undergoes substantial up-regulation when exposed to chronic thermal stress, not down-regulation as seen in the killifish. In all three tissues characterized in this study, HMGB1 showed a 2-fold or greater increase in expressed transcripts when acclimated to elevated temperatures. If we consider the functional role of HMGB1 we might be able to draft some potential insight into these contradictory results.
25
acclimation times used within the two studies, these datafurther supports the case for HMGB1 as an important regulator of thermal stress response in fish.
1.4 CONCLUSION
To our knowledge this is the first large-scale effort aimed at sequencing and assembling the transcriptome of a species from the ecologically important subfamily Trematominae. With this dataset, we now have an annotated transcriptome from at least one member of all three major subfamilies in Notheniidae. Our sequencing, assembly, and annotation efforts yielded an annotated transcriptome library for T. bernacchii
containing 30,107 unigenes of which 13,003 possess strong homology to known proteins. The subsequent application of this library to characterize tissue specific changes in relative abundance using raw sequencing reads allowed us to observe the transcriptomic composition of a polar organism in much greater detail than previously available. Our preliminary RNAseq analysis of a portion of the CSR demonstrates the potential of digital gene expression analysis to greatly increase our understanding of notothenioids, and polar organisms in general, on a genomic level.
26
resources will prove vital to our understanding of the adaptive potential of endemic polar organisms.
1.5 METHODS
Tissue collection and RNA extraction
All procedures were conducted in accordance with the Animal Welfare Act and were approved by the University of South Carolina Institutional Animal Care and Use Committee (ACUP protocol # 100377). To obtain a broad representation of genes
expressed in various tissues under normal and stressed conditions, we used gill, liver and brain tissue that had been collected from a total of ten different fish acclimated to either -1.5 °C or +4 °C (n=5 fish per treatment) for 28 d in flow-through seawater tanks located in the Crary Science and Engineering Center at McMurdo Station Antarctica.
Immediately after euthanizing the fish, tissues were excised in a -2 °C environmental chamber and flash frozen in liquid nitrogen and shipped back to our home institution on dry ice where they were stored at -80 °C until used. Total RNA from approximately 100 mg of frozen tissue was extracted using TRIzol (Invitrogen) following the manufacturer’s recommendations. The RNA was further cleaned by re-suspending in 0.1 ml of RNase/ DNase-free water and adding 0.3 ml of 6 M guanidine HCl and 0.2 ml of 100%
-27
80 °C for 1 h. After this period, tubes were centrifuged at 12,000 × g for 20 min at 4° C. Pellets were washed twice with 80% EtOH and re-suspended in 30 μl of RNase/ DNase-free water. Lastly, RNA was DNase treated at 30 °C for 10 min. After quality assessment and determination of specific concentration using an Agilent 2100 BioAnalyzer and pico-green assay respectively.
cDNA library preparation and 454 sequencing
For each tissue, 10 μg of total RNA from all individuals within a thermal
28
SMART cDNA protocol. Lastly, the tissue specific libraries from each thermal
acclimation treatment were barcoded with MID-tags and pyrosequencing was carried out using Titanium FLX chemistry on a Roche GS-FLX sequencer by the engencore facility at the University of South Carolina.
Sequence filtering, de novo assembly, and assembly validation: To maximize the
relatively high accuracy of Roche GS-FLX 454 sequencing and to ensure a more accurate
de novo transcriptome assembly we accepted sequences for assembly only after a stringent quality control and trimming process. The 454 sequence primers for the plus strand (CGTATCGCCTCCCTCGCGCCATCAG) and for the minus strand
(CTATGCGCCTTGCCAGCCCGCTCAG) were removed. Sequences were then screened for ambiguity and quality; all sequences of low quality (limit = 0.05) or with more than three consecutive ambiguous nucleotides were trimmed or removed if no untrimmed sequence remained.
De novo assembly was conducted using the CLC Genomics Workbench de novo
assembly tool (CLC Bio, 2012a). A word size of 21 and bubble size of 320 were selected as parameters because of the relatively high accuracy of 454 sequencing, and the
moderate coverage depth (roughly 8X based upon the expectation of 30,000 genes within the transcriptome (Ensembl:, n.d.), an average gene length of 1,350 (L. Xu et al., 2006), and ~250,000,000 total bases sequenced) to maximize accuracy and unigene length (CLC Bio, 2012b). Reads were mapped back to the unigenes with a minimum percent identity = 0.9 and minimum length = 0.5.
29
database and sequence similarity was compared to all known full and partial protein sequences available for T. bernacchii on NCBI unigene database using tBLASTn (
e-value 10-10, word size 3, gap penalty -9, gap extension penalty -2, mismatch penalty -2, match award 1) (Altschul et al., 1990). The distribution of the e-value and greatest percent identity between unigene query and protein result was gathered and greatest percent identity charted to demonstrate the quality and accuracy of the resulting de novo
transcriptome assembly.
Transcriptome annotation and analysis
The resulting unigenes were loaded in the BLAST2GO software package (B2GO) for further analysis (Conesa et al., 2005). Using the unigenes as query sequences,
BLASTx searches were conducted against the non-redundant protein sequences (nr) database and BLASTn searches were conducted against nucleotide collection (nr/nt) database at NCBI, the acceptance cutoff was an e-value of 10-3. Unigenes with BLAST results were mapped and annotated using the mapping and annotation functions of B2GO. InterProScan searches were conducted for each unigene (Jones et al., 2014) and all annotation information was merged into the B2GO interface generating our final gene ontology (GO) annotations. GO annotations were exported from B2GO in Web Gene Ontology (WEGO) format and input into the BGI WEGO Annotation Plotting tool to provide the gene ontology distribution of the T. bernacchii transcriptome at GO level 2 (Ye et al., 2006). Pathway assignments were determined using the Kyoto Encyclopedia of Genes and Genomes pathway database (KEGG) (Kanehisa & Goto, 2000) using a
30
Tissue Specific Gene Expression
Reads from each tissue (liver, gill and brain) and treatment (-1.5 °C control and +4 °C acclimated fish) were individually analyzed to characterize the functional
representation of expressed genes. The CLC Genomics Workbench RNAseq analysis tool was employed to calculate read expression for each sample using the unigene library as the reference transcriptome. The sequencing reads from each tissue were mapped back to the reference unigenes based upon a minimum similarity of 0.9 and length fraction of 0.5 (Mortazavi, Williams, McCue, Schaeffer, & Wold, 2008). Any unigene with at least one successfully mapped sequencing read from either treatment was deemed expressed in that tissue sample. Expressed unigene subsets were created for each tissue type in B2GO to provide tissue specific gene ontology and used to generate a graphical comparison of the transcriptome and tissue specific gene ontology. Furthermore, the enzyme code
distribution for each tissue was generated using B2GO and compared between tissues. Lastly, the pathway assignments of the expressed unigenes in each tissue were
determined using the KEGG database with a BLASTx e-value cutoff of 10-5 and
compared between the full transcriptome and specific tissues.
Digital Gene Expression Analysis
31
32
Table 1.1. Read Sequencing and de novo Assembly Statistics
Sequencing and Assembly Statistics
Reads sequenced 738,379
Reads after screening 735,507
Assembled reads 468,721
Singletons reads 266,786
Unigene count 30,107
Average unigene length (bp) 605
Coverage (X) 6.45
N75 466
N50 671
N25 1,085
Table 1.2. T. bernacchii Unigene BLAST Comparison Against 9 Teleost Fish
Species Sequences available for subject species
T. bernacchii hit
e-Value < 10-3
T. bernacchii hit
e-Value < 10-10
Notothenia coriiceps 34,371 19,235 15,861
Chaenocephalus aceratus
17,233 14,533 10,138
Pleuragramma antarcticum
19,945 16,822 10,033
Gasterosteus aculeatus 27,576 9,056 8,010
Takifugu rubripes 47,841 8,539 7,541
Oryzias latipes 24,674 8,686 7,630
Tetraodon nigroviridis 23,118 8,382 7,393
Oreochromis niloticus 26,763 9,116 8,066
33
34
35
Figure 1.3: Tissue specific GO comparison. Unigenes expressed in at least one treatment were included in the gene ontology analysis. GO terms were determined using BLAST2GO (Enzor & Place, 2014) with an e-value cut off of 10-5, a minimum sequence filter of 25, and sorted based on level 2
36
37
Figure 1.5: Categorization of T. bernacchii unigenes to KEGG biochemical pathways. A KEGG biochemical pathway analysis was performed on the full transcriptome and individual tissue transcriptomes using every unigenes expressed in at least one treatment. The stacked columns represent the top 15 KEGG pathways found in the full
transcriptome and their distribution in each tissue, using an e-value cut off of 10-5 and
38
39
Figure 1.7: Differential expression of heat shock protein families in T. bernacchii.
40
41 CHAPTER 2
TRANSCRIPTOME WIDE ANALYSES REVEAL A SUSTAINED CELLULAR
STRESS RESPONSE IN THE GILL TISSUE OF TREMATOMUS BERNACCHII AFTER LONG-TERM ACCLIMATION TO MULTIPLE STRESSORS.2
42
2.1 ABSTRACT
Background
As global climate change progresses, the Southern Ocean surrounding Antarctica
is poised to undergo potentially rapid and substantial changes in temperature and pCO2.
To survive in this challenging environment, the highly cold adapted endemic fauna of
these waters must demonstrate sufficient plasticity to accommodate these changing
conditions or face inexorable decline. Previous studies of notothenioids have focused
upon the short term response to heat stress; and more recently the longer term
physiological response to the combined stress of increasing temperatures and pCO2. This
inquiry explores the transcriptomic response of Trematomus bernacchii to increased temperatures and pCO2 at 7, 28 and 56 days, in an attempt to discern the innate plasticity
of T. bernacchii available to cope with a changing Southern Ocean
Results
Differential gene expression analysis supported previous research in that T.
bernacchii exhibits no inducible heat shock response to stress conditions. However, T.
bernacchii did demonstrate a strong stress response to the multi-stressor condition in the
form of metabolic shifts, DNA damage repair, immune system processes, and activation
of apoptotic pathways combined with negative regulation of cell proliferation. This
response declined in magnitude over time, but aspects of this response remained
detectable throughout the acclimation period.
Conclusions
43
basal levels of expression at longer acclimation times. However, subtle changes in
expression persist in fish acclimated for 56 days that may significantly affect the fitness
T. bernacchii over time.
2.2 BACKGROUND
Isolation of the Antarctic continental shelf by the Polar Front has arguably
produced the coldest, most oceanographically stable environment on the planet.
However, this long-term oceanographic stability may have resulted in the evolution of an
ecosystem filled with endemic fauna that are poorly poised to deal with rapid climate
variation (Peck et al., 2005; Rogers, Murphy, Johnston, & Clarke, 2007). In the face of
global climate change, marine organisms are perceived to have but three options: they
can migrate to more favorable environments, alter their biology through physiological
plasticity, or evolve in response to the altered environment (Hoegh-guldberg & Bruno,
2010; Portner & Knust, 2007; Solomon et al., 2007; Somero, 2010; Tillmann, 2011).
Given the unique environment afforded by the Southern Ocean, it is highly unlikely that
population migration is a viable option for its endemic biota. While evolutionary
responses may benefit the species in some longer time frame, they may be outpaced by
environmental change. Thus, for extant communities in the Antarctic, use of
physiologically plastic responses may be the only available method of persisting under
near-term future environmental variations.
The Southern Ocean is dominated by an endemic suborder of perciform fishes,
the Notothenioidei (Gon & Heemstra, 1990). The effects of increased temperature on the
44
into the physiological plasticity of a number of Antarctic fish species to a single stress
(Bilyk & Cheng, 2013; Bilyk & DeVries, 2011; Bilyk et al., 2012; Davison et al., 1990;
Forester et al., 1987; H. O. Pörtner et al., 2005; Esme Robinson & Davison, 2008;
Somero & DeVries, 1967). However, we have very little information regarding what
impact interacting and synergistic stressors will have on the physiological tolerances of
these unique fish. This is problematic for identifying physiological tipping-points for
polar species, as previous measurements of their capacity to respond may be overly
conservative since they do not account for non-additive effects of the joint action of
multiple stressors. This point has been highlighted by recent studies that assessed the
physiological response of temperate and eurythermal organisms to the combined stress of
ocean acidification and elevated temperature. Results reported from these studies suggest
significant trade-offs in performance and stress tolerance may exist when two or more
environmental conditions are varied (O’Donnell et al., 2009; Rosa & Seibel, 2008;
Schulte, 2007). An important outcome of these studies is an increased understanding
among physiological ecologists that relevant assessment of species vulnerabilities will
require consideration of multiple environmental variables (Gutt et al., 2014; Gretchen E
Hofmann & Todgham, 2010). Equally important is the realization that it is no longer
sufficient to focus on a single cellular or molecular response, but rather the consideration
of multiple co-regulated processes is critical (Gretchen E Hofmann & Todgham, 2010;
Place et al., 2008).
Genomics-based approaches hold the promise of greatly facilitating our
understanding of physiological plasticity in these endemic fishes, especially when
45
(Bilyk & Cheng, 2014; Buckley, Gracey, & Somero, 2006; Huth & Place, 2013; Jia,
Jurkowska, Zhang, Jeltsch, & Cheng, 2007). With modern genomic techniques, we can
now ask: to what extent are conserved patterns of gene expression absent in the Antarctic
fishes and how does this affect their ability to adjust to major changes in their
environment? To this end, we have used RNA-seq analyses to profile the genomic
response of an endemic Antarctic fish to predicted levels of ocean acidification and
global increases in mean sea surface temperature (SST). In this investigation of multiple
stressors related to climate change, our goal was to assess the molecular response of
Trematomus bernacchii to conditions consistent with scenarios laid out by the IPCC with
respect to anthropogenic increases in atmospheric CO2 (Solomon et al., 2007) while
providing direct comparison to previous studies looking at thermal stress in this
organism.
2.3 RESULTS AND DISCUSSION
Reference Transcriptome
Following assembly, the transcriptomic library initially consisted of 421,044
unigenes (unique gene products including all isoforms) and 537,064 transcripts with a
median transcript length of 444bp, mean transcript length of 1,011bp and N50 of
2,160bp. After removing transcripts with expression levels below 0.001 FPKM
(fragments per kilobase million) and clustering at 100% identity; 314,638 transcripts and
246,333 unigenes remained. Transcript level annotation yielded 98,451 BLAST hits
46
Sequencing Read Quality Control and Mapping
Sequencing yielded an average of 27,141,939 reads (s.d. = ±2,544,475; min =
22,080,886; max = 30,834,415) per sample. Trimmomatic (Bolger, Lohse, & Usadel,
2014) quality processing retained an average of 94.28% (s.d. = ±0.14%; min = 93.99%;
max = 94.58%) of the input reads; resulting in samples containing an average of
25,591,193 reads (s.d. = ±2,413,885; min = 20,760,581; max = 29,083,777). Bowtie2
(Langmead & Salzberg, 2012) mapping achieved an average of 90.90% (s.d. = ±5.76%;
min = 89.52%; max = 91.72%) of the trimmed sequencing reads mapped to the reference
transcriptome, which corresponded to an average number of mapped reads per sample of
23,261,884 (s.d. = ±2,206,537; min = 18,817,366; max = 26,562,213).
Transcriptome-wide Differential Gene Expression Analysis
Differential gene expression analysis using edgeR (M. D. Robinson, McCarthy, &
Smyth, 2010) yielded a total of 4,880 differentially expressed genes across all three time
points (FDR ≤ 0.05). A sample similarity comparison demonstrated that the 7d
multi-stressor treatment resulted in considerable differential gene expression when compared to
the 7d control treatment (Fig. 2.1). Furthermore, the 7d multi-stressor individuals
clustered as an outgroup in the cluster dendrogram of all treatments and time-points,
demonstrating the consistent and distinct effect of this treatment-time combination on
overall gene expression as compared to all others (Fig. 2.1). The 28d and 56d
multi-stressor treatments also segregated from their respective control treatments indicating
differential expression compared to the control, although to a lesser extent that the 7d
47
Direct comparisons of the control and multi-stressor treatment at each time-point
demonstrates 2,528 differentially expressed genes within the 7d multi-stressor treatment;
209 differentially expressed genes within the 28d multi-stressor treatment; and 419
differentially expressed genes within the 56d multi-stressor treatment. Of the 2,528
differentially expressed genes of the 7d multi-stressor treatment, 1,642 were up-regulated
and 886 were down-regulated. Of the 209 differentially expressed genes in the 28d
stressor treatment 123 were up-regulated with 86 down-regulated. Lastly, the 56d
multi-stressor treatment demonstrated 187 up-regulated genes and 232 down-regulated genes
out of the 419 total differentially expressed. These metrics indicate a robust initial
response to the 7d multi-stressor treatment, which tapers off considerably in fish
acclimated to the multi-stressor treatment for 28d and 56d. A slight increase in the
number of differentially expressed genes was observed between the 28d and 56d
time-points which may provide insight into the long-term acclimation tactics in these fish.
Gene ontology over-representation analysis
Fisher’s Exact Tests for gene ontology term over-representation further supported
a robust initial transcriptome-wide response in gill tissues that diminishes over time, with
the 7d stressor treatment exhibiting the most differentially expressed and
over-represented gene ontology terms.
For fish within the 7d multi-stress acclimation group, GO terms within the
molecular function subclasses associated with differentially up-regulated genes indicate
these fish experienced large-scale cellular remodeling (Fig. 2.2). Among the up-regulated
genes in the 7d multi-stressor treatment we found that GO terms associated with nucleic