R E S E A R C H
Open Access
Spatial and spectral regularization to
discriminate tissues using multispectral
photoacoustic imaging
Aneline Dolet
1,2*, François Varray
1, Simon Mure
1, Thomas Grenier
1, Yubin Liu
3, Zhen Yuan
3, Piero Tortoli
2and Didier Vray
1Abstract
Photoacoustics is a hybrid modality used to image biological tissues. As optical absorption of tissues depends on the wavelength of the transmitted light, multispectral photoacoustic datasets can be obtained by changing this wavelength. This study presents a regularization method to segment multispectral photoacoustic images based on both the spatial and spectral features of the dataset pixels. The proposed processing is adapted from the spatiotemporal mean-shift approach and cluster patterns with similar spectral profiles, i.e., the variation of the received amplitude among the wavelengths, independent of their initial position. The segmentation performance of this method has been experimentally tested on multispectral photoacoustic tomographic data. We initially used a phantom that contained fresh and stale liver samples, and then a second phantom that contained two blood dilutions or a colored absorber. Experimentally, a clustering performance greater than 98% is achieved. This method makes it possible to discriminate between different media, between the same medium as fresh or stale, and between the same medium with different dilutions.
Keywords: Photoacoustic imaging, Multispectral imaging, Spatial and spectral filtering
1 Introduction
Multispectral photoacoustic imaging is a functional method that combines the advantages of acoustic and optical imaging [1], the principle of which is to illuminate a region of interest (ROI) with a pulsed laser at different wavelengths. Hence, acoustic waves that originate from a temperature increase due to optical absorption can back-propagate from the ROI to a receiving ultrasound probe. Moreover, illumination of a ROI with a range of optical wavelengths allows the study of the spectral profile of the contained media, as their respective optical absorptions will differ from each other depending on the wavelength of the light [2,3]. For example, oxygenated and deoxygenated blood can be differentiated by their photoacoustic spec-tral evolution when they are illuminated in the range [600 nm ; 900 nm] [4]. This is of great interest in cancer-related
*Correspondence:aneline.dolet@creatis.insa-lyon.fr
1Univ. Lyon, INSA-Lyon, Université Claude Bernard Lyon 1, UJM-Saint Etienne, CNRS, Inserm, CREATIS UMR 5220, U1206, F-69621 Lyon, France
2Department of Information Engineering, University of Florence, Florence, Italy Full list of author information is available at the end of the article
studies, as it can allow differentiation between malignant and benign tumors as part of the follow-up of carcinomas or it can be used to evaluate tissue death [5,6].
In past years, unsupervised and supervised segmen-tation or classification methods have been proposed to automatically discriminate between biological media using multispectral photoacoustic datasets. However, whether they were based on principal and independent component analysis [7], on spectral fitting [7], or on least-squares criteria [8], these methods essentially relied on the spectral shape evolution rather than on the absolute photoacoustic signal amplitude at each wavelength. Thus, they did not take into account light attenuation or ultra-sonic dispersion. This means that a given medium will have different spectral profiles because of the concentra-tion change within the medium that modifies the absorp-tion, the light attenuation within the tissue that impacts differently on the pixels at different depths, and the differ-ent target sizes that create ultrasound waves at differdiffer-ent frequencies. Consequently, media discrimination in mul-tispectral photoacoustic imaging is a challenging task that
requires as many features as possible. [9, 10] presented intra-class correlations using both the spatial neighbor-hood and the spectral signature of the pixels, but this did not provide the expected performance improvement. In the present study, our aims were (1) to propose a method based on both spatial and spectral features to improve media discrimination using multispectral pho-toacoustic imaging and (2) to deal with absolute ampli-tude changes related to concentration differences within a given medium.
To these ends, we adapted the spatiotemporal mean-shift (STM-S) approach to our context, which demon-strated good performance for magnetic resonance image clustering by taking into account both spatial and evo-lutive features [11]. We have already shown some pre-liminary result on a single experimental dataset [12], and further to this, we present here an automatic pre-processing pipeline and a deeper study of the parame-ter choices. Moreover, the quantitative validation is fully explained, and the performance of STM-S is evaluated on several photoacoustic datasets that were acquired from two different home-made phantoms. The first phantom contained two pieces of the same medium that have to be discriminated, one of which was fresh tissue and the other of which was stale tissue. The second phantom contained two different dilutions of the same biological medium, i.e., blood, which corresponded to two differ-ent concdiffer-entrations of oxygen inside these inclusions that could be clustered together or separately, depending on the application. Indeed, it might be important to discrim-inate different concentrations of a single medium, e.g., to determine the concentration of a contrast agent in the body, and to discriminate a single medium from all other media without considering their dilutions, e.g., to deter-mine the level of vascularization for calculation of the oxygenation rate [13].
In the STM-S method, which we shall henceforth refer to as the spatio-spectral mean-shift (SSM-S), the required pre-image and post-image processing are presented in the next section. The datasets acquired for each of the phan-toms are presented in Section3. Then, the results are pre-sented and discussed. Finally, the performance obtained is compared to other methods, followed by the conclusions.
2 Methods
2.1 Pre-processing
The first processing step is to discriminate the photoa-coustic signals of the absorbing media from the back-ground noise over the imaged region. The backback-ground is suppressed by application of a threshold that is related to the gradient calculation from Sobel filtering. The Sobel thresholdThSobelis computed using Eq. (1), as follows:
ThSobel=2×
G (1)
where G is the mean of the Sobel gradient magnitude [14]. Further processing thus considers only the region where the pixels have high photoacoustic responses at all wavelengths.
The step that follows is the normalization of the spec-tral profiles of each pixel of interest, and this is applied only when different concentrations of the same medium are to be merged (i.e., when no discrimination between medium concentrations is needed). Indeed, the spectral shape of a medium is independent of the concentrations of its constituents, while the amplitude depends on these. To consider only the spectral shape without including the amplitude, the spectral profile of each pixel with a photoacoustic signal is normalized as follows.
Let us consider the spectral profile,A ∈ RL, of a given pixel, whereAλl are discrete photoacoustic signal ampli-tudes that are acquired at the wavelengthsλl,l= 1· · ·L, chosen according to the media for discrimination. To have our tuning parameters invariant of the spectral profile of the media, we first integrate and normalize the amplitudes ofA, as:
lis the normalized amplitude ofAλl at the wave-lengthλl. This processing is applied to all of the pixel spec-tral profilesAat all of the wavelengthsλlof [λ1;λL]. Thus, full range adaptation is achieved, which allows images in the same amplitude range to always be dealt with. This normalization was preferred to the classical one that uses the maximum, because it allows the noise to be smoothed, whereas the maximum normalization does not.
Applying this normalization step to the data allows dif-ferent concentrations of a single medium to be merged as a single cluster. On the other hand, using non-normalized data allows discrimination between different concentra-tions as if they were associated with different absorbing media.
2.2 Spatio-spectral mean-shift filtering
Compared to the algorithm used to cluster longitudinal magnetic resonance imaging [11], this study aims to apply STM-S as the SSM-S. This means handling the spectral profiles of multispectral photoacoustic data instead of the temporal evolutions of longitudinal magnetic resonance images.
si∈RS, spatial position xi=[siAi]∈Xwith Ai∈RL, spectral profile
i∈[ 1;N] , sample index (3)
We introduce the two tuning parameters of the SSM-S approach:RSandRλ.
For a given pixelxi, let us consider first its neighboring pixels in the spatial dimension within a radial distanceRS (Fig.1, left). These pixelsxj=
As the spectral profiles of samples of the same medium are close,Rλ is fixed as the maximum accepted distance between the spectral profiles of two samples of the same medium. Then, only the pixels that satisfy both con-straints (as part of the spatial area defined above and spectrally close to the reference spectrum, and controlled byRλ) are used for the update, by computing the mean,
the position, and the spectral profile of the reference pixel (Fig.1, right). Consequently, these pixels also satisfy:
1
In Eq. (5), the infinity norm is the most appropriated norm, because it allows pixels with close spectral shapes to be merged even if the amplitudes at each wavelength are not exactly the same. This also allows spectral profiles with large differences in amplitude at a single wavelength to be differentiated, because the spectral shapes of these pixels are then considered to be different. However, differ-ent norms can be used, depending on the desired effect. Iteration of the spectral mean-shift algorithm can then be achieved through the following calculation:
x[ik+1]= it is 0 otherwise. These steps are applied iteratively to all pixelsxiof the imaged regionXuntil convergence of the procedure, i.e., stabilization of the featured value through-out the filtering process. Indeed, at each iteration, the shift of each updated pixel during the regularization process is calculated. The algorithm stops when the sum of all of these shifts becomes lower than a pre-defined threshold. The result of this SSM-S algorithm can easily be used to segment the imaged region. Indeed, even if the result con-tains too many clusters compared to the desired result, all of the pixels with close spectral profiles are labeled together.
The main advantage of mean-shift spatial regularization is that two areas of the imaged region can be merged into the same cluster even if they are spatially distant, as long as their spectral profiles are close. Moreover, this helps two nearby pixels to be clustered together even if their spectral profiles have small amplitude or shape differences. Indeed, the same medium might be present at different locations within the imaged ROI, and two close pixels are likely to belong to the same medium.
2.3 Post-processing
Different areas of the same medium characterized by the same absorption coefficient will produce spectral pro-files that have the same shape but that have different amplitudes. This latter effect is due to light attenuation and ultrasonic dispersion in the medium. Then, with
Fig. 1The spatio-spectral mean-shift principle. Pixel spatial features at the first iteration with theRSparameter (left) and spectral profiles of three
SSM-S, a medium is represented by more than one label. This is due to the strong amplitude differences between these labeled spectra, which are obtained even if their shapes are similar. Here, only theP largest labeled areas will be kept, whileP is chosen depending on the num-ber of media to be discriminated. The other pixels will be kept unlabeled. Thus, the labeled areas will correspond to the different media to be discriminated. To reduce the number of labels, post-processing based on spatial fea-tures only is applied in the nearest neighbor manner. The sets ofC labeled pixels andN −C unlabeled pixels can be referred to asY = {yi}i=[1;C] andU = {uj}j=[1;N−C], respectively, with:
yi=[si; ci] uj=
sj; cj=0
(7)
whereci ∈Ris the associated label of a pixelxi. For each unlabeled pixeluj ∈ U, the closest spatial pixelyi∗ inY is then found, andcjtakes the value of its corresponding indexci∗, as follows:
i∗|j=argmin i=[1;C]
sj−si
then cj=ci∗
(8)
The post-processing then allows the number of clusters to be reduced, with only the most representative ones kept. Indeed, the unlabeled pixels are clustered with one of the kept labels, considering only the spatial features, i.e., an unlabeled pixel is clustered with the spatially closest SSM-S cluster that is kept.
2.4 Quantitative validation
First of all, a ground truth is needed to evaluate the proposed method. The first threshold applied in the pro-cessing steps (Fig.2) is used to create a binary mask. The background pixels are set to zero, while the others, i.e.,
which belong to different media, are equal to one. After labeling the connected components, counting the pixel population of each region in the reference mask is trivial.
Secondly, two quantitative measures are used to deter-mine the quality of the results of this method: the Dice similarity coefficient (DSC) [15] and the percentage of well-clustered pixels, where its value is named WCP. These are compared in the evaluations here.
The number of well-clustered pixels is counted after the post-processing step. Thus, theWCPis expressed relative to all of the pixels to cluster. To compute this criterion, a pixel merged with the background is considered as well clustered. With this strategy, the WCPrange from 0 to 100%, i.e., from “no well-clustered pixels” to “perfect seg-mentation.” With regards to the DSC, the measure will range from 0 when no pixel is correctly labeled to 1 for a perfect result.
The difference between both of these performance cal-culations is that the DSC will drop together with the number of pixels clustered as background, while it is not considered as a penalizing factor when computing the WCP. Thus, the DSC will always be inferior or equal to the WCP with respect to their result scales. Moreover, the aim in our evaluation was to determine whether or not the method can be used to discriminate between dif-ferent media without considering the background. Con-sequently, with the DSC being more restrictive than the WCP, this might appear less appropriate for the targeted application.
The different processing steps described in Section2are summarized in Fig.2.
3 Materials
3.1 Experimental setup
Both of the experimental datasets used in this study were acquired at the University of Macau (People’s Republic of Macau, China) with the multispectral photoacoustic
Fig. 3Experimental setup used for the photoacoustic tomography acquisitions
tomography acquisition setup presented in Fig. 3 [16]. The optical excitation was a Nd:YAG laser pulse with a duration of 6 ns, coupled to an optical parametric oscil-lator. The ultrasound transducer had a central frequency of 1 MHz and was immersed in water together with the phantom. The laser highlights the top of the phantom, and the ultrasound transducer acquires photoacoustic sig-nals all around the cylindrical phantom at one depth [16]. Moreover, to acquire signals with enough photoa-coustic energy, the absorbing media are set particularly close to the surface and the slice of interest that is to be acquired by the ultrasound transducer is also close to the surface, which thus avoids too much optical energy diffusion (Fig.3).
3.2 Recognition of the same fresh and stale medium The first phantom used in this study was a cylindri-cal polyvinyl alcohol phantom (diameter, 4.5 cm) with
two inclusions of liver tissue of approximately 4 mm in size (Fig. 4a). One inclusion was fresh liver tissue (upper, triangular shape), and the other was stale liver tissue (i.e., after 12 h in ambient air; lower, rectangular shape). This phantom was chosen to assess the discrim-ination ability of our method when two media show dif-ferent, but close, spectral profiles. Indeed, [6] reported that photoacoustic biological tissue signals still evolve over time after death (from alive to 1 day after death). The phantom was then created with fresh liver (directly from the fridge) and a sample of the same fresh liver after 12 h in ambient air (mimicking the photoacous-tic evolution of [6]). The images were acquired for laser wavelengths from 700 to 900 nm (Fig.4b), with 25-nm steps. The spectral profiles of several pixels within the inclusions are shown in Fig. 4c. The overlap of the dif-ferent pixel profiles included shows how challenging the segmentation is.
Fig. 5Photoacoustic tomography acquisition for the blood and ink phantoms.aPhantom used for the discrimination study between blood dilutions. The inclusion in gray is China ink, and the two black inclusions are blood at two different dilutions.bThree photoacoustic experimental ROI images after thresholding at different wavelengths.cSpectral profiles of the selected pixels from each inclusion with (upper) and without (lower) normalization
3.3 Discrimination between different medium concentrations
The second phantom used was also a cylindrical polyvinyl alcohol phantom (diameter, 4.5 cm) but here with three 4-mm-diameter cylindrical inclusions (Fig. 5a). Two inclusions were filled with blood at two differ-ent dilutions, corresponding to two differdiffer-ent concen-trations of oxygen inside these inclusions, and one was filled with diluted black China ink (upper right). This phantom was chosen to test the performance of our method for the discrimination of two media with close spectral profile shapes and clearly different ampli-tudes, which corresponds to the photoacoustic signal properties of one medium at different dilutions [17]. Here, a 0.5 dilution factor was used to test our algorithm on the two absorbing media with reasonable amplitude difference spectra. The dataset was acquired at eight dif-ferent wavelengths from 700 to 910 nm (Fig. 5b), with 30-nm steps. The spectral profiles from the pixels selected within the inclusions can be seen in Fig.5c(upper pro-files). Figure 5c (lower profiles) also shows the same spectral profiles after normalization, where both blood inclusion spectral profiles are similar (which was not the case without normalization), while the ink inclusion spectral profiles are still slightly different. Again, there is overlap between the inclusion profiles. Indeed, in all cases, the inclusion boundaries and their centers have lower photoacoustic signal amplitudes, mainly due to light attenuation.
4 Results
The processing steps are shown here initially only with reference to the blood dataset. Then, the results from these two different types of discrimination are presented. The first results show the feasibility of discriminating between fresh and stale samples of the same medium.
The second results are related to the discrimination or merging of different concentrations of the same medium. The multispectral photoacoustic data were taken through pre-processing, followed by the SSM-S algorithm and post-processing, as presented above. The values of the parameters used for each dataset are summarized in Table1.
4.1 Pre-processing thresholding
The thresholding step allows suppression of the back-ground noise, as shown in Fig. 6a. For this dataset with the blood and ink inclusions, the pre-processed threshold allowed suppression of all values under 18% of the max-imum photoacoustic signal amplitude detected over the dataset. The normalization step can be performed if the discrimination between concentrations is not needed. As this is a facultative step, it is not shown in Fig.6.
4.2 Resulting SSM-S map and post-processing
As explained above, the resulting SSM-S map usingRλand
RSof 15 a.u. and 19 pixels, respectively (Fig.6b), has more clusters than the expected number for this dataset because of light attenuation and diffusion. To remove unneces-sary clusters, only the three largest (P = 3) resulting
Table 1Parameters used in this study
Dataset Desired discrimination Normalization Parameters
RS(pixels) Rλa.u. P
Liver Fresh/stale No 25 20 2
Blood and ink
None concentrations Yes 15 19 2
Blood and ink
Concentrations No 15 19 3
Fig. 6Each step of the results.aBackground noise suppressed by thresholding (for each pixel, the maximum noise amplitudes over all of the wavelengths is shown).bOutput of the spatio-spectral mean-shift algorithm.cTwo-dimensional map obtained, keeping only thePlargest labeled areas. Unlabeled pixels are in black (label sets to zero)
SSM-S clusters are maintained (Fig.6c). Then, the unla-beled pixels of Fig. 6c (in black) are clustered with the spatially closest cluster that is kept. Here, the black pixels then become white or yellow, depending on the inclusion (Fig.8d).
4.3 Discrimination between fresh and stale tissues When there is the need to discriminate between fresh and stale tissues, the normalization step is not used. Indeed, these fresh and stale media would be merged if normaliza-tion was carried out, because the shapes of the fresh and stale liver tissue spectral profiles are similar (Fig.4c). In this case, by settingRλ=20 a.u. andRS=25 pixels, there is discrimination between the fresh and stale liver tissues (Fig.7d). In the present case, theWCPis then 100% and the DSC is 0.87. These scores of theWCPand DSC mean that the segmentation is perfect considering the important task of this clustering method. Indeed, the DSC does not reach its maximal score, which is 1.0, only because some pixels at the inclusion boundaries are clustered with the background.
4.4 Discrimination between concentrations
Using the dataset obtained from the analysis of the three cylindrical inclusions (i.e., two dilutions of blood and diluted China ink), the above processing steps are per-formed withRλ = 19 a.u. andRS = 15 pixels. Normal-ization is applied only when the different concentrations
of the same medium are to be merged, i.e., the differ-ent oxygen concdiffer-entrations in the two blood inclusions. The number of clusters that were kept during the post-processing,P, is then set to 2 or 3 when normalization is or is not performed, respectively.
Figure 8c presents the segmentation map for when normalization is applied. With this strategy, the WCP is 98% which is close to the maximal score. Indeed, the two inclusions of the different blood dilutions are well segmented in the same cluster by the algorithm. Only some pixels at the blood inclusion boundaries are misclassified and are instead classified with the ink clus-ter, because they have low photoacoustic signal ampli-tudes. As no pixel is classified with background, the DSC is 0.98, also giving a result that is close to the expert reference.
Alternatively, not using the normalization step allows discrimination between the different oxygen concentra-tions of the blood of this phantom. The corresponding segmentation map is shown in Fig.8d. Here, a few pix-els at the bottom of the inclusion boundaries are seg-mented with the ink inclusion, again because of their low photoacoustic signal. However, the segmentation with discrimination between concentrations achieves a WCP of 99% (i.e., close to the best score). Here, some pixels at inclusion boundaries are clustered with the background, which leads to DSC of 0.97, which is still a high score.
Fig. 8Blood and ink phantom results.aImaged region of the experimental phantom.bPhotoacoustic tomography imaging after thresholding for the experimental phantom at 730 nm.cResulting spatio-spectral mean-shift map with no discrimination between dilutions.dResulting
spatio-spectral mean-shift map with discrimination between dilutions. The upper-left inclusion is clustered with the bottom one if there is no dilution discrimination or it remains separate if there is dilution discrimination
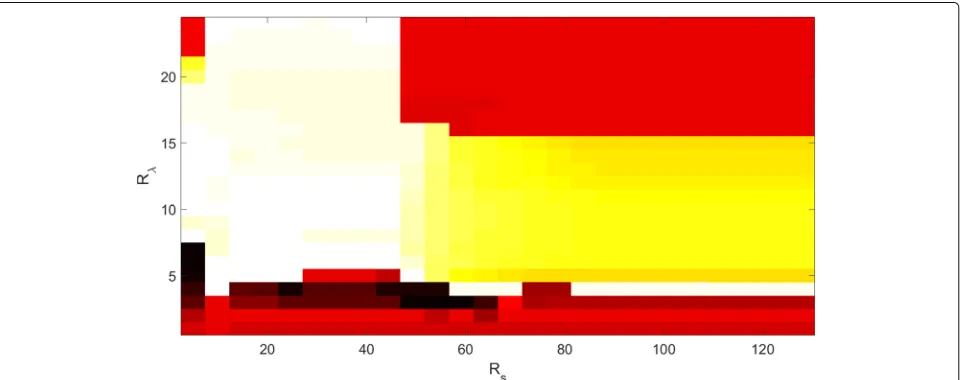
4.5 Setting ofRSandRλ
The settings used for the two parametersRSandRλwere also investigated. These results are shown in the blood and ink dataset when normalization was carried out to merge these two dilutions of blood (Fig. 9). The pixels clustered with the background are considered as well clus-tered in Fig.9. It can be seen that with very smallRλ(i.e., where too many clusters are created) or very largeRλ(i.e., where the two media are clustered together), the perfor-mances decrease. However, the range where Rλ is well adapted to the data is large enough (i.e., from 5 to 15 a.u. in the present case), and in this range,RSdoes not partic-ularly affect the performance. Moreover, whenRλis above this range, the reduction ofRSprovided increased perfor-mance, because it helps the agglomeration of close pixels that are then probably of the same medium. Finally, even if these settings change a little for each dataset, choosing Rλin the range of 10 to 25 a.u. withRSin the range of 10 to 45 pixels provides good performance (above 75%) for all of the datasets, which makes this algorithm easy to use.
5 Discussion
In this paper, we presented a new media segmentation method called SSM-S and tested it on multispectral pho-toacoustic images. We have shown its ability to discrimi-nate between fresh and stale tissues of the same medium and also between different concentrations of the same medium. Its results were compared to two state-of-the-art methods based on spectral fitting [7] and intra-class correlation [9,10] .
Compared to them, SSM-S showed interesting perfor-mance after processing the same dataset, using the same pre-processing pipeline and carrying out its evaluations on the same ground truth. However, as these methods are supervised discrimination methods, a reference spectrum is computed for each medium, as the mean of its pixel spectra. Moreover, as the resulting maps already contain the desired number of clusters, no post-processing step is needed.
The performances of each method are presented in Table 2, and their resulting maps are shown in Fig.10,
Table 2Performance of the discriminations for spectral fitting (SF) [7], intra-class correlation (ICC) [9,10], and the spatio-spectral mean-shift (SSM-S) algorithm, considering two evaluation criteria: the percentage of well-clustered pixels (whereWCPis the value) and the Dice similarity coefficient (DSC)
Dataset Desired discrimination Normalization WCP(%) DSC
SF ICC SSM-S SF ICC SSM-S
Liver Fresh/stale No 95 76 100 0.91 0.63 0.87
Blood and ink None (concentrations) Yes 86 87 98 0.86 0.87 0.98
Blood and ink Concentrations No 77 34 99 0.77 0.34 0.97
where it can be seen that SSM-S performs best. More-over, Table2 shows that the SSM-S results are the best with all the dataset or the desired discrimination when considering theWCPcriterion, which is the most appro-priate to use for the targeted applications. For example, after evaluating the three approaches on the liver dataset, the spectral fitting algorithm performs at 95% with the WCPand at 0.91 with the DSC, the intra-class correlation method performs at 76% with theWCPand at 0.63 with the DSC while SSM-S performs at 100% with theWCP, i.e. perfect segmentation, and at 0.87 with the DSC. A smaller DSC value thanWCPvalue is obtained by SSM-S because the DSC computation imposes to associate each pixel to a cluster, rather than allowing to consider some of them as background. Thus, informed by these results, we can say that SSM-S outperforms the other two state-of-the-art approaches with both datasets, whichever discrimination system is considered.
Moreover, SSM-S performance exceeds 98% withWCP and is equal or greater than 0.87 with DSC for all the
cases, i.e., all the datasets and the desired discrimination. Depending on the type of discrimination that is needed, the normalization step allows to merge pixels belonging to the same medium but with different concentrations. However, the parameters have to be carefully chosen.
First, as the signals back-scattered by a given medium might have different amplitudes due to light attenuation and diffusion, the thresholding step must consider the very low photoacoustic signals at the inclusion boundaries as background in order to avoid misclassification of pix-els and local errors. Also, since the light absorption of the media can differ depending on the wavelength used, the background noise can be equal to different percent-ages of the maximal amplitude of the dataset. However, these problems are overcome by setting an appropriate threshold in the pre-processing pipeline.
Then, two parameters need to be set to run the SSM-S approach.Rλis the parameter that has the greater impact on its results, but, in our experience, its most adapted val-ues range between 10 and 25 a.u. of the photoacoustic
signal. RegardingRS, it has a moderate impact on the per-formance ifRλis well set up. Its optimal value ranges from 10 to 45 pixels, in our experience. Finally, the number of clustersPonly depends on the desired discrimination cri-terion. Thus, finding appropriate settings for these three parameters is rather straightforward.
To conclude, and as previously mentioned in Section1, the shape and the size of the media to discriminate can make the segmentation difficult because of their impact on the photoacoustic signal. Consequently, fur-ther studies could be undertaken on datasets containing inclusions with different shapes and sizes. It could also be interesting to evaluate SSM-S behavior with mixed medium datasets. Finally, further studies could also be carried out using different liver samples with varying wait times in ambient air in order to determine how SSM-S could differentiate them. This might be of particular interest in forensic medicine to estimate the death time of the tissues.
6 Conclusions
The aim of the SSM-S algorithm is to highlight a medium of interest in an imaged region, such as to define a vascu-larized region in terms of the blood oxygenation rate, with a view to further quantification studies. The results of this study show that this can be achieved with high perfor-mance, even if light attenuation and ultrasonic dispersion are not compensated for in the multispectral photoacoustic dataset, which is the typical use of these kinds of data.
Abbreviations
DSC: Dice similarity coefficient; ICC: Intra-class correlation; ROI: Region of interest; SF: Spectral-fitting; SSM-S: Spatio-spectral mean-shift; STM-S: Spatiotemporal mean-shift;WCP: Well-clustered pixels
Acknowledgements
This work was supported by the LABEX CELYA (ANR-10-LABX-0060) and LABEX PRIMES (ANR-10-LABX-0063) of Université de Lyon, within the program
Investissements d’Avenir(ANR-11-IDEX-0007) operated by the French National Research Agency (ANR). It was also performed within the framework of the Université Franco-Italienne (VINCI 2016) and the Région Rhône-Alpes (EXPLORA DOC).
Availability of data and materials
Please contact the author for data requests.
Authors’ contributions
All authors participated in the writing and/or revision of the manuscript. All of the authors have read and approved the final version of the manuscript.
Competing interests
The authors declare that they have no competing interests.
Publisher’s Note
Springer Nature remains neutral with regard to jurisdictional claims in published maps and institutional affiliations.
Author details
1Univ. Lyon, INSA-Lyon, Université Claude Bernard Lyon 1, UJM-Saint Etienne,
CNRS, Inserm, CREATIS UMR 5220, U1206, F-69621 Lyon, France.2Department of Information Engineering, University of Florence, Florence, Italy.3Bioimaging
Core - Faculty of Health Sciences, University of Macau, People’s Republic of Macau, China.
Received: 15 January 2018 Accepted: 28 May 2018
References
1. M Vallet, F Varray, J Boutet, JM Dinten, G Caliano, AS Savoia, D Vray, Quantitative comparison of PZT and CMUT probes for photoacoustic imaging: experimental validation. Photoacoustics.8, 48–58 (2017).
https://doi.org/10.1016/j.pacs.2017.09.001
2. P Beard, Biomedical photoacoustic imaging. Interface Focus.1, 602–631 (2011)
3. RLP van Veen, HJCM Sterenborg, A Pifferi, A Torricelli, R Cubeddu, in
Biomedical Topical Meeting. Determination of VIS-NIR absorption coefficients of mammalian fat, with time- and spatially resolved diffuse reflectance and transmission spectroscopy, (2004).
ftp://physics2.uni-corvinus.hu/FFirtha/Articles/Meat/2003_beef%20fat-NIR.pdf
4. ER Hill, W Xia, DI Nikitichev, K Gurusamy, PC Beard, DJ Hawkes, BR Davidson, AE Desjardins, inProc. SPIE 9708. Interventional multi-spectral photoacoustic imaging in laparoscopic surgery, (2016), p. 97080.
http://spie.org/Publications/Proceedings/Paper/10.1117/12.2208428? origin_id=x4323
5. DR Bauer, R Olafsson, LG Montilla, RS Witte, inProc. SPIE 7564. In vivo multi-modality photoacoustic and pulse echo tracking of prostate tumor growth using a window chamber, (2010), p. 75643.https://pdfs. semanticscholar.org/3043/9456fcfb67c328d528c8d093440ee16d8982. pdf
6. R Su, AS Ermilov, AV Liopo, AA Oraevsky, inProc. SPIE 8223. Optoacoustic 3D visualization of changes in physiological properties of mouse tissues from live to postmortem, (2012), pp. 14–21.http://www.tomowave.com/ wp-content/uploads/7_2012_spie_postmortem.pdf
7. J Glatz, NC Deliolanis, A Buehler, D Razansky, V Ntziachristos, Blind source unmixing in multi-spectral optoacoustic tomography. Opt. Express.19(4), 3175–3184 (2011)
8. K Jansen, M Wu, AFW van der Steen, G van Soest, Lipid detection in atherosclerotic human coronaries by spectroscopic intravascular photoacoustic imaging. Opt. Express.21(18), 21472–21484 (2013) 9. B Wang, J Su, J Amirian, SH Litovsky, R Smalling, S Emelianov, in
Proceedings of IEEE Engineering in Medicine and Biology Society Conference (EMBC, 2009). On the possibility to detect lipid in atherosclerotic plaques using intravascular photoacoustic imaging, (2009), pp. 4767–4770.
https://ieeexplore.ieee.org/document/5334213/?denied
10. S Mallidi, J Tam, T Larson, A Karpiouk, K Sokolov, S Emelianov, in
Proceedings of IEEE International Ultrasonics Symposium (IEEE, 2008). Selective detection of cancer using spectroscopic photoacoustic imaging and bioconjugated gold nanoparticles, (2008), pp. 578–581.https:// ieeexplore.ieee.org/document/4803640/?denied
11. S Mure, T Grenier, DS Meier, CRG Guttmann, H Benoit-Cattin,
Unsupervised spatio-temporal filtering of image sequences. a mean-shift specification. Pattern Recogn. Lett.68(1), 48–55 (2015)
12. A Dolet, F Varray, S Mure, T Grenier, Y Liu, Z Yuan, P Tortoli, D Vray, in
Proceedings of IEEE International Ultrasonics Symposium (IEEE, 2016). Spatial and spectral regularization for multispectral photoacoustic image clustering, (2016).https://doi.org/10.1109/ULTSYM.2016.7728439
13. E Mercep, XL Dean-Ben, D Razansky, Combined pulse-echo ultrasound and multispectral optoacoustic tomography with a multi-segment detector array. IEEE Trans. Med. Imaging.36(10), 2129–2137 (2017) 14. WK Pratt,Digital image processing. (Wiley, 1978). ISBN: 9780471018889 15. LR Dice, Measures of the amount of ecologic association between
species. Ecology.26(3), 297–302 (1945)
16. S Li, B Montcel, Z Yuan, W Liu, D Vray, Multigrid-based reconstruction algorithm for quantitative photoacoustic tomography. Biomed. Opt. Express.6(7), 2424–2434 (2015)
17. M Jeon, W Song, E Huynh, J Kim, J Kim, BL Helfield, BYC Leung, DE Goertz, G Zheng, J Oh, JF Lovell, C Kim, Methylene blue microbubbles as a model dual-modality contrast agent for ultrasound and activatable


![Table 2 Performance of the discriminations for spectral fitting (SF) [7], intra-class correlation (ICC) [9, 10], and the spatio-spectralmean-shift (SSM-S) algorithm, considering two evaluation criteria: the percentage of well-clustered pixels (where WCP is the value) andthe Dice similarity coefficient (DSC)](https://thumb-us.123doks.com/thumbv2/123dok_us/881421.1105907/9.595.62.540.474.704/performance-discriminations-correlation-spectralmean-considering-percentage-similarity-coefficient.webp)
