Characteristics of consecutive bursts of Pi2 pulsations observed at the SMALL
array: A new implication
C.-C. Cheng1, C. T. Russell2, K. Yumoto3, Y. F. Gao4, and P. J. Chi2
1Department of Physics, National Huwei University of Science and Technology, Hu-Wei, Taiwan 63201, ROC 2Institute of Geophysics and Planetary Physics, University of California, Los Angeles, CA 90095, USA
3Department of Earth and Planetary Sciences, Kyushu University 33, Fukuoka 812-8581, Japan 4Institute of Geophysics, China Seismological Bureau, China
(Received August 1, 2003; Revised February 12, 2004; Accepted April 19, 2004)
Consecutive bursts of Pi2 pulsations are examined with magnetic field data obtained by the SMALL array in 1999. With reference to the H-component magnetic bays in the high-latitude magnetograms at CPMN, 10 events consisting of two consecutive Pi2 bursts simultaneously observed by the Beijing (BJI, L = 1.46) and Wuhan (WHN,L=1.20) stations are identified as associated with substorm onsets. Owing to the same waveform seen by the CPMN and IGPP/LANL arrays, they are the global phenomena. Their occurrences are mostly in the 2100–2300 LT (local time) sector in which the dominant frequencies at WHN are higher than the mean frequency, but those at BJI are lower and close to the frequency of the surface wave at the plasmapause. Moreover, the LT dependence of azimuth and polarization of two consecutive Pi2 bursts at BJI and WHN are analyzed and consistent with the ULF waves theory by Itonaga and Yumoto (1998). GOES 8 and GOES 10 confirm the formation of the substorm current wedge after the onsets of two Pi2 bursts. Thus during substorm onsets, Pi2 pulsations at low latitudes may result from hydromagnetic waves driven by an impulsive source in the magnetotail which could commence in the longitude of 2230 LT and later propagate westward and eastward as well. Low-latitude Pi2 waves near the source site may be affected by several factors as they propagate by the stimulation of a surface wave at the plasmapause, by a localized field line oscillation inside the plasmapause, and by the magnetospheric/plasmaspheric cavity (resonance) mode.
Key words:Pi2 pulsations, substorm onsets, ULF waves.
1.
Introduction
For decades, determining the generation and propagation mechanisms of Pi2 pulsations has been an active area of space physics research. Pi2 pulsations consist of impulsive and damped oscillations of geomagnetic fields in a period range of 40 to 150 seconds, and occur predominantly in the nighttime in association with substorm onsets (e.g., Yumoto, 1986; Olson, 1999).
It appears that several mechanisms may generate Pi2s and that several factors affect them before they are observed by a remote observer. The first possible generation mechanism is a bouncing Alfv´en wave between the auroral ionosphere and the plasma sheet. This may produce high-latitude Pi2 pulsations (Baumjohann and Glassmeier, 1984; Baueret al., 1995). The substorm current wedge oscillation that is the ge-omagnetic perturbation induced by the current system in the polar region after substorm onset, has been suggested as a second source mechanism that may be responsible for mid-and low-latitude Pi2 pulsations (e.g., Lanzerotti mid-and Med-ford, 1984; Lesteret al., 1989 and references therein). Sup-port for this is found in polarization patterns and the orienta-tion of the major axis. By using comparison with ground and satellite observations, Kepko and Kivelson (1999) reported
Copy right cThe Society of Geomagnetism and Earth, Planetary and Space Sciences
(SGEPSS); The Seismological Society of Japan; The Volcanological Society of Japan; The Geodetic Society of Japan; The Japanese Society for Planetary Sciences; TERRA-PUB.
that there is a direct link between mid- and low-latitude Pi2 pulsations and bursty bulk flows (BBFs) in the magnetotail. The braking of earthward BBFs could lead to the formation of the substorm current wedge. Consequently, mid-latitude Pi2s were regarded as the transient response of the iono-sphere to the substorm current wedge. Furthermore, low-latitude Pi2s on the flank were found to be in a same period as the oscillating BBF. Thus, Kepko and Kivelson (1999) pro-posed that BBFs could directly excite mid- and low-latitude Pi2 pulsations.
A factor that affects the appearance of mid-latitude Pi2s, is the stimulation of a surface wave at the plasmapause and/or a localized field line oscillation inside the plasmapause. By an-alyzing the latitudinal profile of peak power of Pi2 pulsations in the Circum-pan Pacific Magnetometer Network (CPMN), Yumoto and the CPMN Group (2001) found that the peak power of H and D components of Pi2 pulsations become interchanged from high to low frequency at stations close to plasmapause. In addition, Kosakaet al.(2002) reported that the dominant frequency of mid-latitude Pi2 is consis-tent with the resonance frequency of the surface wave at the plasmapause in a plasmaspheric model including the effect of plasmapause bulge. Another factor that affects Pi2 ap-pearance according to some recent studies (e.g., Linet al., 1991; Li et al., 1998; Lee and Kim, 1999; Nos´e, 1999; Chenget al., 2000; Fujita and Itonaga, 2003 and references therein) is the modification of low-latitude Pi2 from the
Table 1. Occurrences of two consecutive Pi2 bursts at available stations in 1999.
Event Date Start time of Start time of SMALL array CPMN array* number burst 1 (UT) burst 2 (UT)
1 Oct. 8 1112 1138 BJI, WHN DAL, WEP
2 Oct. 11 1348 1400 BJI, WHN
3 Oct. 15 1316 1332 BJI, WHN DAL, WEP
4 Oct. 16 1425 1438 BJI, WHN
5 Oct. 17 1239 1254 BJI, WHN DAL, WEP
6 Oct. 23 1418 1440 BJI, WHN DAL, WEP
7 Oct. 25 1416 1431 BJI, WHN DAL, WEP
8 Oct. 28 1652 1700 BJI, WHN DAL, WEP
9 Dec. 5 1457 1507 BJI, WHN
10 Dec. 6 1704 1726 BJI, WHN
*South-hemisphere stations with nearly sameLas those at SMALL.
Table 2. Locations of available stations at the SMALL, CPMN and IGPP/LANL arrays.
Station name Abbr. Geographic Geographic Corr. geomag. L LT-UT Array name
lat. long. lat. (hrs)
Beijing BJI 40.0 116.2 34.2 1.46 +8 SMALL
Wuhan WHN 30.5 114.6 24.2 1.20 +8 SMALL
Kotelnyy KTN 75.94 137.71 70.25 8.76 +9 CPMN
Tixie TIK 71.59 128.78 65.99 6.04 +9 CPMN
Chokurdakh CHD 70.62 147.89 64.96 5.58 +9 CPMN
Zyryanka ZYK 65.75 150.78 59.87 3.97 +9 CPMN
Magadan MGD 59.97 150.86 53.75 2.86 +9 CPMN
St. Paratunka PTK 52.94 158.25 46.38 2.10 +9 CPMN
Moshiri MSR 44.37 142.27 37.57 1.59 +9 CPMN
Kagoshima KAG 31.48 130.72 24.70 1.21 +9 CPMN
Weipa WEP −12.68 141.88 −21.93 −1.18 +9 CPMN
Dalby DAL −27.18 151.20 −36.61 −1.58 +9 CPMN
Athabasca ATH 54.72 246.72 62.31 4.63 −7 IGPP/LANL
USAFA AFA 39.01 255.12 48.05 2.24 −7 IGPP/LANL
netospheric/plasmaspheric (virtual) cavity resonance. An-other factor for low-latitude Pi2 waves is the coupling of cav-ity (resonance) modes to field line resonances as the eigen-frequency is matched in the inhomogeneous distribution of plasma and field in the inner magnetosphere (e.g., Chenget al., 1998). The last factor is the propagation of the elec-tric field from the nightside auroral latitude to the equatorial ionosphere in a manner favorable to the generation of day-side events.
By comparing mid- and low-latitude Pi2 pulsations, Vil-lanteet al.(1992) found that there is a strong local time (LT) control of low-latitude Pi2 polarization pattern, and the ori-entation of the major axis of low-latitude Pi2 has a clear vari-ation before and after 2200 LT. For the mid-latitude stvari-ation, the observed Pi2 polarizations show clear LT control after local midnight that is contrary to the prediction of the sub-storm current wedge model around 2300 LT. By compar-ing the AMPTE/CCE and ground-based observations, Taka-hashiet al.(1995) reported that compressional Pi2 oscilla-tions are seldom seen at 2 < L < 5 in the inner magne-tosphere outside a region of 6 hours in the midnight sector. Recently, Yumoto and the CPMN Group (2001) showed that
high-latitude Pi2 predominantly appear in the midnight tor but mid- and low-latitude Pi2 in the 2100–0200 LT sec-tor. These phenomena indicate that the source location of mid- and low-latitude Pi2 may be not localized around the midnight as those at high latitudes.
domi-0.0 2.5 5.0 7.5 10.0 12.5 15.0 17.5 20.0 22.5 25.0 27.5 30.0 32.5 35.0 37.5 40.0 42.5 45.0 47.5 50.0 52.5 55.0 57.5 60.0 -0.4
-0.2 0.0 0.2 0.4
BJI (L=1.46) (a)
dH/dt at SMALL (nT/s)
0.0 2.5 5.0 7.5 10.0 12.5 15.0 17.5 20.0 22.5 25.0 27.5 30.0 32.5 35.0 37.5 40.0 42.5 45.0 47.5 50.0 52.5 55.0 57.5 60.0 -0.4
-0.2 0.0 0.2 0.4
WHN (L=1.20)
(b) #1 #2
1630UT 1640 1650 1700 1710 1720 1730UT
0030LT 0040 0050 0100 0110 0120 0130LT
October 28,1999
0.0 7.5 15.0 22.5 30.0 37.5 45.0 52.5 60.0 67.5 75.0 82.5 90.0 97.5 105.0 112.5 120.0 127.5 135.0 142.5 150.0 157.5 165.0 172.5 180.0
720 750 780 810 840 870 900 930 960 990 1020 1050 1080 1110 1140 1170 1200 1230 1260 1290 1320 1350 1380 1410 1440 -1500
-1000 -500 0 500
KTN (L=8.76) (c)
720 750 780 810 840 870 900 930 960 990 1020 1050 1080 1110 1140 1170 1200 1230 1260 1290 1320 1350 1380 1410 1440 -1500
-1000 -500 0 500
TIK (L=6.04) (d)
720 750 780 810 840 870 900 930 960 990 1020 1050 1080 1110 1140 1170 1200 1230 1260 1290 1320 1350 1380 1410 1440 -1500
-1000 -500 0 500
H component at CPMN (nT)
CHD (L=5.58) (e)
720 750 780 810 840 870 900 930 960 990 1020 1050 1080 1110 1140 1170 1200 1230 1260 1290 1320 1350 1380 1410 1440 -1500
-1000 -500 0 500
ZYK (L=3.97) (f)
720 750 780 810 840 870 900 930 960 990 1020 1050 1080 1110 1140 1170 1200 1230 1260 1290 1320 1350 1380 1410 1440 0
50 100 150 200
MGD (L=2.86) (g)
#1 #2
1200UT 1400 1600 1800 2000 2200 2400UT
2100LT 2300 0100 0300 0500 0700 0900LT
October 28, 1999
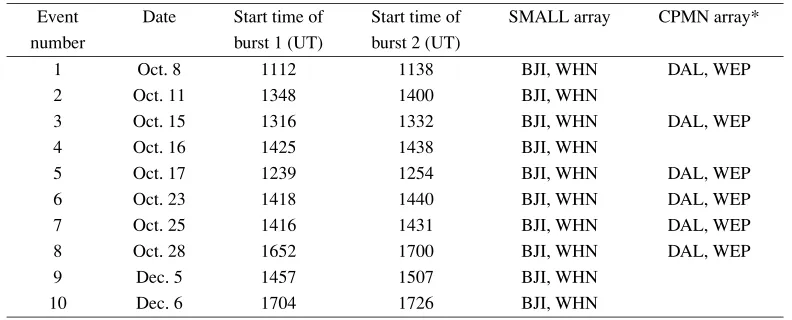
Fig. 1. An example of two consecutive Pi2 bursts simultaneously occurring at BJI (L=1.46) and WHN (L=1.20) as displayed with the time derivative ofH-component in the context of 1-minuteH-component magnetic field data at CPMN on October 28, 1999. The first Pi2 burst occurred at 1652 UT (0052 LT) and the second at 1700 UT (0100 LT). The dashed line denotes the onset time of two Pi2 bursts. #1 denotes the first Pi2 burst and #2 for the second one.
nant frequencies of two consecutive Pi2 bursts. They found that the correlation coefficient for the ‘high-latitude’ station at SMALL is larger than that at the ‘low-latitude’ station. This implies that Pi2 pulsations at low latitudes are more dominated by the cavity wave than those at the higher lat-itudes. Since most stations of the SMALL array are usu-ally inside the plasmasphere, the generation and propaga-tion mechanisms of Pi2 pulsapropaga-tions at low latitudes need to be further verified with consideration of their wave polariza-tions. By reanalyzing the characteristics of two consecutive Pi2 bursts simultaneously observed at SMALL in the Cheng et al.(2002a) study, our goal is first to clarify their generation mechanism, and second to examine their propagation mech-anism. The magnetic field data from the stations at CPMN and IGPP/LANL as well as geostationary satellites will be compared to those at SMALL in this study.
2.
Data Presentation
In the Chenget al.(2002a) study, there are 33 events con-sisting of two consecutive Pi2 bursts at SMALL in asso-ciation with the H-component magnetic bays at the high-latitude stations at CPMN in 1999. Especially ten events are
720 750 780 810 840 870 900 930 960 990 1020 1050 1080 1110 1140 1170 1200 1230 1260 1290 1320 1350 1380 1410 1440 -1000
-800 -600 -400 -200 0
(a) KTN (L=8.76)
720 750 780 810 840 870 900 930 960 990 1020 1050 1080 1110 1140 1170 1200 1230 1260 1290 1320 1350 1380 1410 1440 0
200 400 600 800 1000
(b) TIK (L=6.04)
720 750 780 810 840 870 900 930 960 990 1020 1050 1080 1110 1140 1170 1200 1230 1260 1290 1320 1350 1380 1410 1440 -600
-400 -200 0 200 400
D component at CPMN (nT)
(c) CHD (L=5.58)
720 750 780 810 840 870 900 930 960 990 1020 1050 1080 1110 1140 1170 1200 1230 1260 1290 1320 1350 1380 1410 1440 -600
-400 -200 0 200 400
(d) ZYK (L=3.97)
720 750 780 810 840 870 900 930 960 990 1020 1050 1080 1110 1140 1170 1200 1230 1260 1290 1320 1350 1380 1410 1440 -600
-400 -200 0 200 400
(e) MGD (L=2.86) #1 #2
1200UT 1400 1600 1800 2000 2200 2400UT
2100LT 2300 0100 0300 0500 0700 0900LT
October 28, 1999
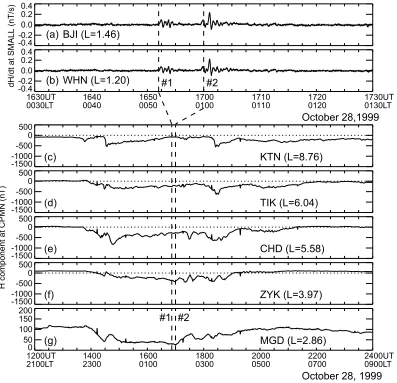
Fig. 2. In the same format as Fig. 1, except for theD-component at CPMN on October 28, 1999.
magnetic field along the CPMN array on October 28, 1999. The onset time of the first Pi2 burst is about 1652 UT (0052 LT) and the second about 1700 UT (0100 LT). Note that the local time at the SMALL array is the universal time (UT) plus 8 hours and that at CPMN plus 9 hours (see Table 2). In Fig. 1, #1 denotes the first Pi2 burst and #2 for the second one. The dashed line denotes the onset time of the Pi2 bursts henceforth in this study. The comparison of Figs. 1(a) to 1(b) shows that two consecutive Pi2 bursts in the time derivative of H-component at BJI are in phase with those at WHN. This supports the view that low-latitude Pi2 may be the cavity (resonance) modes resulting from fast compressional waves from the magnetotail during substorm onsets.
The substorm onset generally occurs after the IMF turns southward for a period time≥30 min (e.g., Russell, 2000). According to the IMF observation at Wind which was lo-cated at ∼28 RE (Earth’s radii) in front of the Earth (not
shown in this study), the IMF turned southward at∼1330 UT on October 28, 1999. And the southward IMF continued to ∼1740 UT with a time of more than 4 hours. It is clear that two consecutive Pi2 bursts at BJI and WHN are associated with substorm onset during the time of interest. Figures 1(c) to 1(g) show the occurrence ofH-component magnetic bays from the high- to low-latitude stations at CPMN. The loca-tions of the available staloca-tions at CPMN are shown in Table 2. From Figs. 1(c) to 1(g), one may find that theH-component of magnetic field at CHD (L = 5.58) is the first to begin a sharp decrease in two stages at∼1345 UT and reach the minimum at∼1440 UT. Subsequently, theH-component at
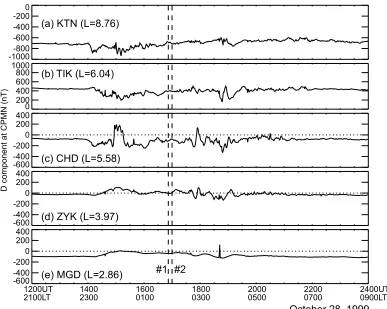
CHD gradually increased but that at ZYK (L = 3.97) and MGD (L =2.86) remained decreasing before onsets of two consecutive Pi2 bursts. After onset of the second Pi2 burst, theHcomponents at ZYK and MGD gradually recovered to be in the undisturbed state. In the same format as Figs. 1(c) to 1(g), Figures 2 and 3 show the Dand Z components at CPMN, respectively. In Fig. 2, theD-component at TIK de-creased and that at CHD inde-creased instead. Moreover, Fig-ure 3 shows that the Z-component at CHD increased and that at ZYK decreased. These indicate that during substorm onset the westward traveling surge may be located between CHD and ZYK and the field-aligned current may go upward over CHD. As a result, two consecutive Pi2 bursts at BJI and WHN may be relevant to the substorm current wedge. To verify the view, we will study the local time dependence of the dominant frequency and wave polarizations of two con-secutive Pi2 bursts at the BJI and WHN stations in the fol-lowing section.
3.
Characteristic Analysis
720 750 780 810 840 870 900 930 960 990 1020 1050 1080 1110 1140 1170 1200 1230 1260 1290 1320 1350 1380 1410 1440 0
200 400 600 800 1000
(a) KTN (L=8.76)
720 750 780 810 840 870 900 930 960 990 1020 1050 1080 1110 1140 1170 1200 1230 1260 1290 1320 1350 1380 1410 1440 -2000
200 400 600 800
(b) TIK (L=6.04)
720 750 780 810 840 870 900 930 960 990 1020 1050 1080 1110 1140 1170 1200 1230 1260 1290 1320 1350 1380 1410 1440 -2000
200 400 600 800
Z component at CPMN (nT)
(c) CHD (L=5.58)
720 750 780 810 840 870 900 930 960 990 1020 1050 1080 1110 1140 1170 1200 1230 1260 1290 1320 1350 1380 1410 1440 -600
-400 -200 0 200 400
(d) ZYK (L=3.97)
720 750 780 810 840 870 900 930 960 990 1020 1050 1080 1110 1140 1170 1200 1230 1260 1290 1320 1350 1380 1410 1440 -50
0 50 100 150
(e) MGD (L=2.86)
#1 #2
1200UT 1400 1600 1800 2000 2200 2400UT
2100LT 2300 0100 0300 0500 0700 0900LT
October 28, 1999
Fig. 3. In the same format as Fig. 1, except for theZ-component at CPMN on October 28, 1999.
H-D hodogram of hydromagnetic waves. It is important to understand the generation and propagation mechanisms of Pi2 pulsations by using the H-D hodogram in addition to the spectral analysis. Hence, the local time dependence of the dominant frequencies and wave polarizations of two consecutive Pi2 bursts can be studied with BANAL in this study.
3.1 Dominant frequency
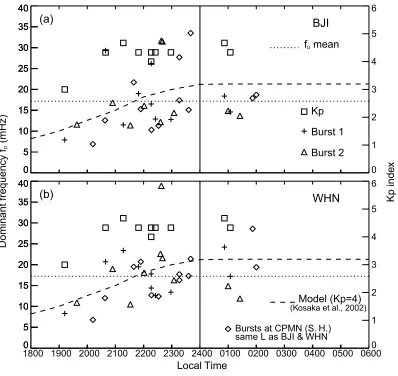
Using FFT, the dominant frequencies of two consecutive Pi2 bursts at BJI and WHN versus LT and theK pindex are shown in Fig. 4. Note that the cross denotes the first Pi2 burst, the triangle for the second burst, the dotted line for the mean dominant frequency fDof Pi2 burst, and the square for the K pindex, respectively. Both panels of Fig. 4 show that fD is about 17.17 mHz for BJI and 17.22 mHz for WHN. One may find from Fig. 4 that most of the two consecutive Pi2 bursts occur before the midnight and dominantly around 2200 LT. Moreover, there are twelve Pi2 bursts at both sta-tions in the interval 2100–2300 LT in Fig. 4. By close in-spection of Fig. 4(a), the dominant frequencies of Pi2 bursts at BJI are below fDwith a margin of 8 to 4. But the dominant frequencies of Pi2 bursts at WHN are above fDwith small margin of 7 to 5 in Fig. 4(b). Hence, there is a tendency for the dominant frequency at BJI to become below fDand that at WHN to be higher than fDinstead. One may argue that the difference of the dominant frequency of Pi2s between BJI and WHN may be attributed to the frequency resolution determined by the length of time window. To reduce the un-certainty, we selected a same length of time window for each
Pi2 event at both BJI and WHN. For justification, we also an-alyzed the same Pi2 events in the south hemisphere stations at CPMN in a similar way. Unfortunately, only six events occurring simultaneously at the Weipa (WEP,L = −1.18) and Dalby (DAL,L = −1.58) stations at CPMN were avail-able for comparison with those at SMALL. The more detail on the location of the WEP and DAL stations can refer to Table 2. In Fig. 4, the open diamond denotes the dominant frequency of Pi2s at WEP and DAL. The pattern of Fig. 4 remains unchanged with inclusion of the data points from the WEP and DAL stations. Hence, the length of time win-dow is not the key factor for the difference of the dominant frequency of Pi2s between BJI and WHN.
18 19 20 21 22 23 24 25 26 27 28 29 30
(Kosaka et al., 2002)
1800 1900 2000 2100 2200 2300 2400 0100 0200 0300 0400 0500 0600
Local Time
Fig. 4. The dominant frequency of two consecutive Pi2 bursts at BJI (L=1.46) and WHN (L=1.20) and theK pindex versus LT, respectively. The cross denotes the first Pi2 burst, the triangle for the second burst, the dotted line for the mean dominant frequency fDof Pi2 burst, the square for the K pindex, the open diamond for the bursts in the south hemisphere, and the dashed line for the estimated frequency of the surface wave forK p=4 by Kosakaet al.(2002), respectively.
in this study, Pi2’s dominant frequency at BJI is similar to that at KAK and in the range of the estimated frequency of the surface wave at the plasmapause in the interval 2100– 2200 LT. The Pi2’s dominant frequency at WHN, however, is slightly different from that at KAK and higher than the es-timated frequency of the surface wave at the plasmapause. According to Fig. 6 in the Kosaka et al.(2002) study, the plasmapause location moves closer to the Earth as K p be-comes higher. During the interval, both BJI and KAK may be closer to the footpoint of the plasmapause for K p = 4 than WHN. This may be the reason why the LT dependence of Pi2’s dominant frequency at KAK resembles BJI and not WHN. On the other hand, Fujita and Itonaga (2003) simu-lated the behavior of hydromagnetic waves in a model mag-netosphere with a longitudinally non-uniform plasmasphere after substorm onset. Their simulation results show that the cavity (resonance) mode in a Pi2 period could sustain in the plasmapshere. In addition, the plasmaspheric cavity (reso-nance) mode could have a position-dependent frequency like those observed at KAK and BJI. Unlike the cavity mode, the surface wave is an evanescent fast mode and its ampli-tude decreases as it propagates isotropically. Until now, the
longitudinal extent of localized Pi2s is not well determined. Hence, Fujita and Itonaga (2003) suggested that the surface wave could be a possible generation mechanism for Pi2s lo-calized in a longitudinal direction. As a result, Pi2 pulsations at BJI in the interval 2100–2300 LT may be affected by at least two factors, the magnetospheric/plasmaspheric cavity (resonance) mode and a surface wave arising at the plasma-pause. Thus, Pi2 frequencies may be not only dependent upon the state of the plasmasphere but also their source lo-cations. In other words, the source location may determine the local time dependence of the dominant frequencies of Pi2 pulsations at low latitudes. In the next subsection, the polarization analysis of two consecutive Pi2 bursts will be performed to track their source locations.
3.2 Wave polarization
counter-18 19 20 21 22 23 24 25 26 27 28 29 30
1800 1900 2000 2100 2200 2300 2400 0100 0200 0300 0400 0500 0600
Local Time
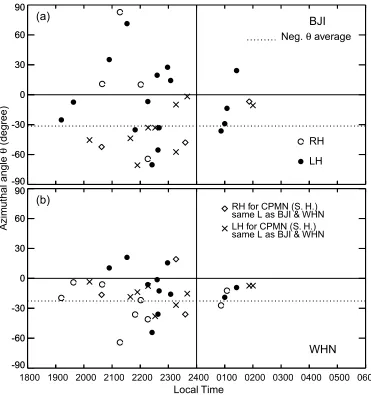
Fig. 5. The azimuthal angle and polarization of two consecutive Pi2 bursts at BJI (L=1.46) and WHN (L=1.20) versus LT. The open circle denotes the right-handed polarization, the solid circle for the left-handed polarization along the geomagnetic field into the north hemisphere, and the dashed line for the average magnitude of the negative azimuthal angle. For the bursts in the south hemisphere, the open diamond denotes the right-handed polarization and the cross for the left-handed polarization.
clockwise rotation of the major axis. By using the Born-Wolf method (e.g., Rankin and Kurtz, 1970), the azimuthal angle θ can be calculated with the eigenvector in principal axis analysis.
Figure 5 shows the azimuthal angle and polarization of two consecutive Pi2 bursts at BJI and WHN versus LT, re-spectively. The pattern of Fig. 5 remains unchanged with inclusion of the data points from the WEP and DAL sta-tions. The open circle denotes the right-handed polariza-tion, the solid circle for the left-handed polarization along the geomagnetic field into the north hemisphere, and the dotted line for the average magnitude of the negative az-imuthal angle. In addition, the open diamond denotes the right-handed polarization, the cross for the left-handed po-larization along the geomagnetic field into the south hemi-sphere. Since there are two azimuthal angles (180◦ apart) that can be used to describe the azimuthal angle and most of azimuthal angles at WHN are negative, the average nega-tive azimuthal angles are consistently used for comparison in this study. Figure 5(a) shows the sense of polarization at BJI
-90 -60 -30 0 30 60 90
-90 -60 -30 0 30 60 90
Corr.Coef.=0.91 BJI (L=1.46)
(a)
Azim
uthal angle of b
urst 2 (deg
ree)
-90 -60 -30 0 30 60 90
-90 -60 -30 0 30 60 90
DAL (L=-1.58)
Corr.Coef.=0.83
(c)
-90 -60 -30 0 30 60 90
-90 -60 -30 0 30 60 90
Corr.Coef.=0.034 WHN (L=1.20)
(b)
-90 -60 -30 0 30 60 90
-90 -60 -30 0 30 60 90
Corr.Coef.=0.37 WEP (L=-1.18)
(d)
Azimuthal angle of burst 1 (degree)
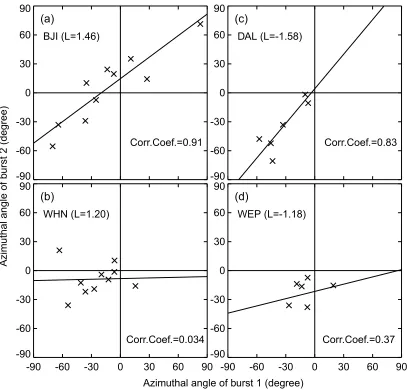
Fig. 6. (a) The azimuthal angle correlation between the first and second Pi2 bursts BJI (L=1.46). (b) In the same format as Fig. 6(a), except for WHN (L=1.20). (c) In the same format as Fig. 6(a), except for DAL (L= −1.58). (d) In the same format as Fig. 6(a), except for WEP (L= −1.18).
at BJI is closer to 90◦ than the WHN station with compari-son of Figs. 5(a) and 5(b).
Moreover in Fig. 5, the major axes of Pi2 waves at WHN are mostly aligned in the northeast direction but those at BJI alternate with the northeast and northwest directions. There is also a clear tendency for the local time distribution of the azimuthal angle and polarization at BJI to be more scattered than WHN. This result is similar to those at the mid-latitude station by Villante et al. (1992). From Fig. 5(b), the Pi2 waves at WHN appear right-hand polarized before 2230 LT and left-hand polarized afterwards. Recently, Itonaga and Yumoto (1998) proposed a theory that the sense of rotation of the magnetic perturbation vector in the H-D plane is clockwise (right-hand polarized) and counterclockwise (left-hand polarized) for the eastward and westward propagations in the northern hemisphere. They also noted that the major axis of theH-Dplane ellipse is oriented in the northeast and northwest directions west and east of the source longitude in the northern hemisphere. Thus, during substorm onsets, the Pi2 waves at BJI and WHN may be driven by an impulsive source in the magnetotail in the longitude of 2230 LT and later would propagate westward and eastward as well.
To clarify the difference of local time dependence of the
240.0 247.5 255.0 262.5 270.0 277.5 285.0 292.5 300.0 307.5 315.0 322.5 330.0 337.5 345.0 352.5 360.0 367.5 375.0 382.5 390.0 397.5 405.0 412.5 420.0
0 30 60 90 120 150
CU (nT)
240.0 247.5 255.0 262.5 270.0 277.5 285.0 292.5 300.0 307.5 315.0 322.5 330.0 337.5 345.0 352.5 360.0 367.5 375.0 382.5 390.0 397.5 405.0 412.5 420.0
-500 -400 -300 -200 -100 0
CL (nT)
#1 #2
1000UT 1030 1100 1130 1200 1230 1300UT
0300LT 0330 0400 0430 0500 0530 0600LT
October 8, 1999
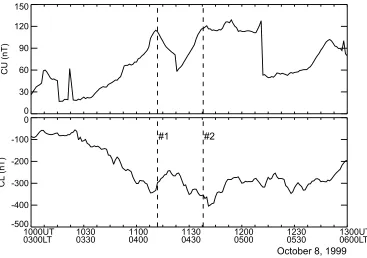
Fig. 7. TheAEindex at CANOPUS from 1000 UT (0300 LT) to 1300 UT (0600 LT) on October 8, 1999. The dashed line denotes the onset time of two Pi2 bursts at BJI (L=1.46) and WHN (L=1.20). #1 denotes the first Pi2 burst and # 2 for the second.
where the fast compressional wave is dominant. As afore-mentioned, the BJI and DAL stations are closer to the foot-point of the plasmapause than WHN and WEP. By contrast, one may find in Fig. 5 that the azimuth of Pi2 polarizations at BJI and DAL becomes larger than that at WHN and WEP around 2230 LT. Accordingly, two consecutive Pi2 bursts at BJI and DAL may be more affected by the substorm cur-rent wedge and/or a localized field line oscillation inside the plasmapause than those at WHN and WEP where fast com-pressional waves may be predominant instead. This may be the reason why the correlation coefficient between two Pi2 bursts at BJI and DAL is higher than that at WHN and WEP. In the following section, to justify the view, we will under-take the October 8, 1999 event study by comparing the mag-netic field data from the stations at CPMN, IGPP/LANL, and geostationary satellites GOES 8 and GOES 10 to those at SMALL.
4.
October 8, 1999
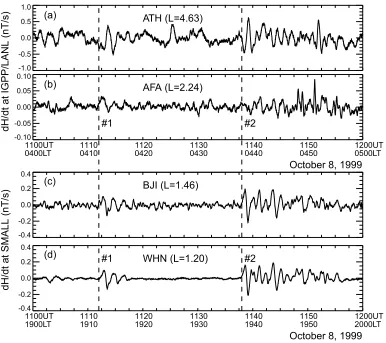
According to the IMF observation at Wind which was situated at∼47 RE in front of the Earth (not shown in this study), the IMF turned southward at∼0834 UT, sporadically northward and southward before ∼1030 UT, and remained southward until∼1230 UT for more than 4 hours on October 8, 1999. Therefore a substorm onset might be expected to occur during the time of interest. To test our expectation, the AE index at CANOPUS from 1000 UT (0300 LT) to 1300 UT (0600 LT) is plotted in this study. Figure 7 shows that there are two sharp declines in CL right after onsets of two consecutive Pi2 bursts at BJI and WHN. To check if the Pi2 waves propagate globally, the magnetic field data at both the Athabasca (ATH, CGM lat. 62.31◦, long. 305.56◦;L=4.63) and Air-Force Academy stations (AFA, CGM lat. 48.05◦, long. 320.22◦; L = 2.24) in IGPP/LANL are compared to
those at SMALL. The geographic locations of the ATH and AFA stations are shown in Table 2. Figure 8 shows the time derivative of H-component with the simulation of a search coil magnetometer with a band pass up to 0.125 Hz. In Fig. 8, two consecutive Pi2 bursts simultaneously occur at two twin stations in a span of at least 100◦ geomagnetic longitude. Figure 8 also shows that two consecutive Pi2 bursts at ATH are out of phase in contrast to other three stations inside the plasmasphere that are in phase with one another.
0.0 2.5 5.0 7.5 10.0 12.5 15.0 17.5 20.0 22.5 25.0 27.5 30.0 32.5 35.0 37.5 40.0 42.5 45.0 47.5 50.0 52.5 55.0 57.5 60.0
-1.0 -0.5 0.0 0.5 1.0
(a) ATH (L=4.63)
dH/dt at IGPP/LANL (nT/s)
0.0 2.5 5.0 7.5 10.0 12.5 15.0 17.5 20.0 22.5 25.0 27.5 30.0 32.5 35.0 37.5 40.0 42.5 45.0 47.5 50.0 52.5 55.0 57.5 60.0
-0.10 -0.05 0.00 0.05 0.10
(b) AFA (L=2.24)
#1 #2
1100UT 1110 1120 1130 1140 1150 1200UT
0400LT 0410 0420 0430 0440 0450 0500LT
October 8, 1999
0.0 2.5 5.0 7.5 10.0 12.5 15.0 17.5 20.0 22.5 25.0 27.5 30.0 32.5 35.0 37.5 40.0 42.5 45.0 47.5 50.0 52.5 55.0 57.5 60.0
0.0 2.5 5.0 7.5 10.0 12.5 15.0 17.5 20.0 22.5 25.0 27.5 30.0 32.5 35.0 37.5 40.0 42.5 45.0 47.5 50.0 52.5 55.0 57.5 60.0
-0.4 -0.2 0.0 0.2 0.4
(c) BJI (L=1.46)
dH/dt at SMALL (nT/s)
0.0 2.5 5.0 7.5 10.0 12.5 15.0 17.5 20.0 22.5 25.0 27.5 30.0 32.5 35.0 37.5 40.0 42.5 45.0 47.5 50.0 52.5 55.0 57.5 60.0
-0.4 -0.2 0.0 0.2 0.4
(d) #1 WHN (L=1.20) #2
1100UT 1110 1120 1130 1140 1150 1200UT
1900LT 1910 1920 1930 1940 1950 2000LT
October 8, 1999
Fig. 8. The time derivatives ofH-component at ATH (L=4.63), AFA (L=2.24), BJI (L=1.46) and WHN (L=1.20) from 1100 UT to 1200 UT on October 8, 1999. The dashed line denotes the onset time of two Pi2 bursts at BJI and WHN. #1 denotes the first Pi2 burst and #2 for the second.
a fast magnetospheric cavity (resonance) mode to field line resonances in the inner magnetosphere. Thus same as Iton-aga and Yumoto (1998) pointed out, mid- and low-latitude Pi2s may be the mixture of the fast magnetospheric cavity (resonance) mode and the shear Alfv´en wave.
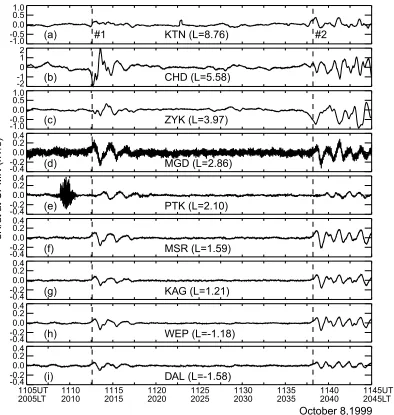
The power spectra of two consecutive Pi2 bursts of seven CPMN stations inside and outside the plasmapause are rean-alyzed with FFT adopted by Chenget al.(2000) and shown in Fig. 10. Note that the solid line deontes burst 1 and the dashed line for burst 2. One may find from Fig. 10 that there is a dominant peak at the frequency of 3/256 Hz at all stations for burst 1. But for burst 2, the power spec-trum at ZYK (L = 3.97) close to the plasmapause is not same as those at other stations that have more than two har-monic peaks. Moreover, the power spectrum of burst 2 at CHD (L = 5.58) similar to that at MGD (L = 2.86) has three harmonic peaks of which the first has the frequnency of 2/256 Hz not seen by the MSR (L = 1.59) and KAG (L =1.21) stations. These confirm once again the findings by Chenget al.(2000) that low-latitude Pi2 pulsations on the nightside may be propagating via the plasmaspheric cavity (resonance) mode resulting from fast compressional waves from the magnetotail during substorm onset. The compari-son of Fig. 8 to Fig. 9, however, shows that the Pi2 ampli-tude at AFA is quite a bit smaller than that at BJI and WHN as well as those at the CPMN stations with L <3.97. Note that the AFA station was in the postmidnight sector but the
SMALL and CPMN stations were in the premidnight sector. This also justifies the view from Fig. 5 that the impulsive source in the magnetotail may commence in the longitude of 2230 LT. Owing to the plasma injection at the time of successive substorm onsets, the plasma density at the outer boundary of the inner magnetopshere would be higher than that at the plasmapause. Then the fast compressional wave could be more easily trapped in the inner magnetosphere than in the plasmasphere. Therefore the strength of the plasma-spheric cavity (resonance) mode may decline in contrast to the magnetospheric cavity (resonance) mode away from the impulsive source site. Hence, the substorm current wedge oscillation and the magnetospheric cavity (resonance) mode may be two dominant components for low-latitude Pi2 away from the source longitude during substorm onset.
paral-5.0 7.5 10.0 12.5 15.0 17.5 20.0 22.5 25.0 27.5 30.0 32.5 35.0 37.5 40.0 42.5 45.0 -1.0
-0.5 0.0 0.5 1.0
#1 #2
(a) KTN (L=8.76)
dH/dt at CPMN (nT/s)
5.0 7.5 10.0 12.5 15.0 17.5 20.0 22.5 25.0 27.5 30.0 32.5 35.0 37.5 40.0 42.5 45.0 -2
-1 0 1 2
(b) CHD (L=5.58)
5.0 7.5 10.0 12.5 15.0 17.5 20.0 22.5 25.0 27.5 30.0 32.5 35.0 37.5 40.0 42.5 45.0 -1.0
-0.5 0.0 0.5 1.0
(c) ZYK (L=3.97)
5.0 7.5 10.0 12.5 15.0 17.5 20.0 22.5 25.0 27.5 30.0 32.5 35.0 37.5 40.0 42.5 45.0 -0.4
-0.2 0.0 0.2 0.4
(d) MGD (L=2.86)
5.0 7.5 10.0 12.5 15.0 17.5 20.0 22.5 25.0 27.5 30.0 32.5 35.0 37.5 40.0 42.5 45.0 -0.4
-0.2 0.0 0.2 0.4
(e) PTK (L=2.10)
5.0 7.5 10.0 12.5 15.0 17.5 20.0 22.5 25.0 27.5 30.0 32.5 35.0 37.5 40.0 42.5 45.0 -0.4
-0.2 0.0 0.2 0.4
(f) MSR (L=1.59)
5.0 7.5 10.0 12.5 15.0 17.5 20.0 22.5 25.0 27.5 30.0 32.5 35.0 37.5 40.0 42.5 45.0 -0.4
-0.2 0.0 0.2 0.4
(g) KAG (L=1.21)
5.0 7.5 10.0 12.5 15.0 17.5 20.0 22.5 25.0 27.5 30.0 32.5 35.0 37.5 40.0 42.5 45.0 -0.4
-0.2 0.0 0.2 0.4
(h) WEP (L=-1.18)
5.0 7.5 10.0 12.5 15.0 17.5 20.0 22.5 25.0 27.5 30.0 32.5 35.0 37.5 40.0 42.5 45.0 -0.4
-0.2 0.0 0.2 0.4
(i) DAL (L=-1.58)
1105UT 1110 1115 1120 1125 1130 1135 1140 1145UT
2005LT 2010 2015 2020 2025 2030 2035 2040 2045LT
October 8,1999
Fig. 9. The time derivatives ofH-component at CPMN from the high- to low-Lstations in the north hemisphere and two stations in the south hemisphere from 1105 UT (2005 LT) to 1145 UT (2045 LT) on October 8, 1999. The dashed line denotes the onset time of two Pi2 bursts at BJI and WHN. #1 denotes the first Pi2 burst and #2 for the second.
lel to the Earth spin axis in the case of a zero degree incli-nation orbit); H e, perpendicular to H p and directed earth-wards; andH n, perpendicular toH pand directed eastwards. Figures 11(a) and 11(d) show that at the onsets of two Pi2 bursts the H e-component simultaneously begins to decrease at GOES 8 and GOES 10. And Figures 11(c) and 11(f) show that the H p-component begins to increase as well for two satellites. This signals the dipolization of geomagnetic con-figuration in the nightside magnetosphere during substorm onset. Figures 11(b) and 11(e) show that the increase in fluc-tuations in the H n direction confirms the onset of activity signaled by the Pi2 on the ground. Moreover at GOES 8 and GOES 10, the H n-component at onset has positive pertur-bations and the H e-component has negative perturbations. These results are similar to those studied by Cheng et al. (2002b) and confirm the formation of the substorm current wedge after onsets of two Pi2 bursts. Although GOES 8 was at the dawn sector during the time of interest, the effect of the substorm current wedge could continue from the night-side to the daynight-side hemisphere. This justifies the possibility
that a transmission of the electric field from the nightside au-roral latitude to the equatorial ionosphere may evoke the oc-currence of the dayside Pi2 (Yumoto and the CPMN Group, 2001).
0 5 10 15 20 25
0 50 100 150 200 250 300
Power spectra of Pi2 bursts at CPMN on Oct. 8, 1999
CHD (L=5.58)
Burst 1 Burst 2
(a)
Relativ
e po
w
er
0 5 10 15 20 25
0 20 40 60 80 100
ZYK (L=3.97) (b)
0 5 10 15 20 25
0 8 16 24 32 40
MGD (L=2.86)
(c)
0 5 10 15 20 25
0 10 20 30 40
MSR (L=1.59)
(d)
0 5 10 15 20 25
0 10 20 30 40
KAG (L=1.21)
(e)
0 5 10 15 20 25
0 10 20 30 40
WEP (L=-1.18)
(f)
0 5 10 15 20 25
Frequency (1/256Hz)
0 10 20 30 40
DAL (L=-1.58)
(g)
Fig. 10. Power spectra of two consecutive Pi2 bursts of seven CPMN stations inside and outside the plasmapause on October 8, 1999. The solid line denotes the first burst and the dashed line for the second.
5.
Discussion and Summary
After the substorm expansion onset, magnetic energy re-leased by reconnection in the near Earth neutral line acceler-ates the plasma flows. These flows are called bursty bulk flows and some move earthward and other tailward. The BBF may move close to the Earth in the longitude of 2100– 2300 LT and brake near the plasmapause due to the balance of magnetic pressure and flow kinetic pressure while theK p index becomes higher. As a result, at least two kinds of hydromagnetic waves are driven impulsively by the BBF. One is the fast compressional wave, propagating from the BBF braking region and bouncing back from the Earth. Dur-ing the lifetime of the BBF, fast compressional waves are trapped in the inner magnetospheric cavity and result in the cavity resonance (e.g., Cheng et al., 2000; and references therein). In this study, Figure 4 shows the dominant frequen-cies of two consecutive Pi2 bursts at WHN are higher than those at BJI. This indicates that the cavity (resonance) mode may play a dominant role in consecutive Pi2 bursts at WHN. Moreover, the braking BBFs may stimulate the surface wave at the plasmapause with the steep gradient of Alfv´en speed. For consistency with the estimated frequency, Pi2 pulsations at BJI may be the surface wave that is excited at the
plasma-pause in the longitude of 2230 LT (see Fig. 5(a) in this study). The other is the shear Alfv´en wave accounting for a lo-calized field line oscillation inside the plasmapause results from the coupling of the fast magnetospheric cavity (reso-nance) mode to field line resonances as the eigenfrequency is met. In Fig. 9, the amplitude enhancement and phase change of the first Pi2 burst at the station near the footpoint of the plasmapause is similar to the one studied by Chenget al. (1998) due to the coupling of a fast magnetospheric cavity resonance mode to field line resonances in the inner magne-tosphere. Thus, mid- and low-latitude Pi2s may be composed of the shear Alfv´en wave and the magnetospheric cavity (res-onance) mode.
120.0 127.5 135.0 142.5 150.0 157.5 165.0 172.5 180.0 187.5 195.0 202.5 210.0 217.5 225.0 232.5 240.0 247.5 255.0 262.5 270.0 277.5 285.0 292.5 300.0 30
35 40 45 50
He (nT)
(a)
GOES 8
120.0 127.5 135.0 142.5 150.0 157.5 165.0 172.5 180.0 187.5 195.0 202.5 210.0 217.5 225.0 232.5 240.0 247.5 255.0 262.5 270.0 277.5 285.0 292.5 300.0 -2
1 4 7 10
Hn (nT) (b) GOES 8
120.0 127.5 135.0 142.5 150.0 157.5 165.0 172.5 180.0 187.5 195.0 202.5 210.0 217.5 225.0 232.5 240.0 247.5 255.0 262.5 270.0 277.5 285.0 292.5 300.0 80
90 100 110 120
Hp (nT)
(c)
GOES 8
#1 #2
1000UT 1030 1100 1130 1200 1230 1300UT
0500LT 0530 0600 0630 0700 0730 0800LT
October 8, 1999
120.0 127.5 135.0 142.5 150.0 157.5 165.0 172.5 180.0 187.5 195.0 202.5 210.0 217.5 225.0 232.5 240.0 247.5 255.0 262.5 270.0 277.5 285.0 292.5 300.0
120.0 127.5 135.0 142.5 150.0 157.5 165.0 172.5 180.0 187.5 195.0 202.5 210.0 217.5 225.0 232.5 240.0 247.5 255.0 262.5 270.0 277.5 285.0 292.5 300.0 20
30 40 50 60 70
He (nT)
(d)
GOES 10
120.0 127.5 135.0 142.5 150.0 157.5 165.0 172.5 180.0 187.5 195.0 202.5 210.0 217.5 225.0 232.5 240.0 247.5 255.0 262.5 270.0 277.5 285.0 292.5 300.0 -100
10 20 30 40
Hn (nT)
(e)
GOES 10
120.0 127.5 135.0 142.5 150.0 157.5 165.0 172.5 180.0 187.5 195.0 202.5 210.0 217.5 225.0 232.5 240.0 247.5 255.0 262.5 270.0 277.5 285.0 292.5 300.0 30
40 50 60 70 80
Hp (nT)
(f)
GOES 10
#1 #2
1000UT 1030 1100 1130 1200 1230 1300UT
0100LT 0130 0200 0230 0300 0330 0400LT
October 8, 1999
Fig. 11. (a) TheH e-component of GOES 8 from 1000 UT (0500 LT) to 1300 UT (0800 LT) on October 8, 1999. During the interval, GOES 8 was moving from (−1.35,−6.40, 1.03)REto (4.88,−4.35, 1.01)RE in the GSM coordinates. #1 and #2 denote ground Pi2 bursts, respectively. The dashed line
denotes the onset time for two Pi2 bursts at SMALL. (b) Same as Fig. 11(a), except for theH n-component. (c) Same as Fig. 11(a), except for the
H p-component. (d) In the same format as Fig. 11(a), except for GOES10 and in the interval 0100–0400 LT. In the mean time, GOES 10 was moving from (−6.27,−2.09,−0.25)REto (−3.05,−5.85, 0.55)REin the GSM coordinates. (e) Same as Fig. 11(d), except for theH n-component. (f) Same
as Fig. 11(d), except for theH p-component.
higher than the first one. If the earthward BBFs move to the flank before approaching the plasmapause, the plasma den-sity at the outer boundary of the inner magnetopshere would be higher than that at the plasmapause. Then the fast com-pressional wave could be more easily trapped in the inner magnetosphere than in the plasmasphere. If the earthward BBFs spread in the wide longitudinal extent, the strength of the magnetospheric cavity (resonance) mode would be stronger than the plasmaspheric cavity (resonance) mode. This may be the other reason why the amplitude of low-latitude Pi2s tends to decrease from pre-midnight to post-midnight (see Fig. 9 in this study). The similar trend can be found in Fig. 3 of the Nos´eet al.(2003) study except from the post-midnight to the morning. Based on the same wave-forms and no phase delays between the multipoint ground and satellite observations, however, Nos´eet al.(2003) sug-gested that low-latitude Pi2 pulsations could extend to the morning side and might result from the plasmaspheric cav-ity (resonance) mode. For this event occurring in the ge-omagnetic quiet periods, Nos´e et al. (2003) inferred that
the plasmapause location could expand to large L from the nightside to the morning. With the analysis of wave modes observed by CRRES, Takahashiet al.(2001) suggested that the outer limit of the inner magnetosphere is the plasma-pause. When the geomagnetic activity is low, there may be no clear difference between the magnetospheric cavity (resonance) mode and the plasmaspheric cavity (resonance) mode.
TIK decreases and that at CHD increases (see Fig. 2 in this study), and the Z-component at CHD increases and that at ZYK decreases (see Fig. 3 in this study). These imply that the westward traveling surge may be located between CHD and ZYK and the field-aligned current may go upward over CHD. Hence, the BBF model may be the possible generation scenario for two consecutive Pi2 bursts at SMALL.
Recently by referring to the ground observation in the same meridian near the midnight, Yamaguchi et al.(2002) examined the timing relationship between Pi2s at the syn-chronous orbit and BBFs in the magnetotail. They found that the ground Pi2 signatures were correlated much better with those at the synchronous orbit than with BBFs. Conse-quently, they suggested that low-latitude Pi2 pulsations may not be directly excited by BBFs. In addition to BBFs, the current disruption in the magnetotail is the other impulsive source associated with the geomagnetic reconfiguration af-ter substorm onset. Assuming the impulsive source current as a wave generator in the magnetotail, Fujitaet al.(2002) and Fujita and Itonaga (2003) simulated the behavior of hy-dromagnetic waves in a model magnetosphere with a lon-gituinally non-uniform plasmasphere between L = 3 and 16.2 after substorm onset. Their simulation results show that the major axis of polarization of the magnetic perturbation like Pi2 pulsation is radially oriented at midnight and az-imuthally oriented at dawn and dusk. They also found that the cavity (resonance) mode in a Pi2 period could sustain in the plasmapshere and the field line resonance could be ex-cited at the regions with the steep gradient of Alfv´en speed as well. Further, the plasmaspheric cavity (resonance) mode could have local time depending spectra like those observed by the ground stations. In addition, the localized field line resonance mode could have the same tendency of local time depending spectra as the plasmaspheric cavity (resonance) mode. Unlike the cavity mode, the surface wave is an evanes-cent fast mode and its amplitude decreases as it propagates isotropically. Until now, the longitudinal extent of local-ized Pi2s is not well determined. Fujita and Itonaga (2003) suggested that the surface wave could be a possible genera-tion mechanism for Pi2s localized in a longitudinal direcgenera-tion. This may be the reason why the amplitude of low-latitude Pi2s tends to decrease from pre-midnight to post-midnight (see Fig. 9 in this study). The simulation features by Fujita et al.(2002) and Fujita and Itonaga (2003) are qualitatively consistent with the observational results in this study. Hence, the current disruption in the magnetotail may be the other possible source candidate for two consecutive Pi2 bursts at SMALL.
Until now, there are no concrete conclusions on interpret-ing the nature of Pi2s at low latitudes from their wave polar-izations. However, the orientation of the major axis can still provide some information about their generation and prop-agation mechanisms. By comparing Fig. 5(a) to Fig. 5(b), one may find that the azimuth versus LT distribution at BJI is more scattered than WHN. The azimuth distribution at BJI is similar to the one at the mid-latitude station reported by Villanteet al.(1992). The azimuth of two consecutive Pi2 bursts versus LT distribution at WHN is also similar to their observation results at the low-latitude station. Villanteet al. (1992) suggested that the Pi2 azimuth at the mid-latitude
sta-tion might be more affected by the substorm current wedge than that at the low-latitude station. Since the SMALL sta-tions are usually inside the plasmasphere, the Pi2 azimuth at BJI and WHN may be more controlled by a localized field line oscillation inside the plasmapause than the substorm cur-rent wedge.
In Fig. 5(b), the Pi2 waves at WHN appear right-hand po-larized before 2230 LT and left-hand popo-larized afterwards. According to Itonaga and Yumoto (1998), hydromagnetic waves may be driven by an impulsive source in the mag-netotail which could commence in the longitude of 2230 LT and later propagate eastward with the sense of right-hand po-larization in theH-Dplane and westward for the left-hand polarization instead. Moreover, Fig. 5(b) is consistent with the observational result reported by Yumoto and the CPMN Group (2001) that Pi2 in the pre-midnight sector occurs ear-lier than that in the evening sector. But in Fig. 5(a), the ma-jor axes of Pi2 waves at BJI alternate with the northeast and northwest directions during 2100–2300 LT. In this study, most of Pi2 bursts occurred in the 2100–2300 LT zone where the westward traveling surge may be located and the field-aligned current may go upward over as well (see Figs. 1, 2, and 3 in this study). Thus we cannot rule out the possibility that the substorm current wedge may result in the apparent azimuth variation of Pi2 at BJI in contrast to WHN. In other words, the control of Pi2 azimuth at WHN by a localized field line oscillation inside the plasmapause is more obvious than that at BJI. As a result, low-latitude Pi2 near the source site may be composed of at least three components including the substorm current wedge oscillation, the surface wave at the plasmapause or a localized field line oscillation inside the plasmapause, and the magnetospheric/plasmaspheric cavity (resonance) mode. But away from the source longitude, the substorm current wedge oscillation and the magnetospheric cavity (resonance) mode may be the main component for low-latitude Pi2 on the nightside.
Except for the substorm current wedge oscillation, other factors responsible for low-latitude Pi2 are closely associ-ated with the plasmapause location. The plasmasphere shape changing with time may lead to the local time dependence of the dominant frequency of low-latitude Pi2s. Recent imag-ing measurements at the spacecraft (e.g., Burchet al., 2001) showed that the plasmapshere rarely had a smooth steady shape and even a plasma tail in the dusk sector. The asym-metric plasmapshere may not vary uniformly so that the dif-ference of the plasmapause distance might be mainly a tem-poral effect. Therefore the temtem-poral variation of the plasma-pause location may result in the slight difference of the dom-inant frequency of Pi2s between the low-latitude sites in the different longitude. To discern which factor is most dom-inant, the latitudinal and longitudinal dependences of the dominant frequency and polarization characteristics of low-latitude Pi2s need further examination on both dense ground measurements and coordinated satellite observations from outside and inside the plasmapause down to the low latitudes in the future study.
Oc-tober 8, 1999 event on the ground and in space verify that two consecutive Pi2 bursts at BJI and WHN are the global phenomena. Their occurrences are mostly in the 2100–2300 LT sector in which the dominant frequencies at WHN are higher than the mean frequency but those at BJI are lower and close to the frequency of the surface wave at the plasma-pause. The azimuthal angles of Pi2 waves are less correlated to each other at WHN than at BJI. The LT dependence of az-imuth and polarization of consecutive Pi2 pulsations at BJI and WHN can be interpreted with the theoretical model by Itonaga and Yumoto (1998). GOES 8 and GOES 10 confirm the formation of substorm current wedge after the onsets of two Pi2 bursts. During substorm onsets, Pi2 pulsations at low latitudes may result from hydromagnetic waves driven by an impulsive source in the magnetotail which could com-mence in the longitude of 2230 LT and later would propagate westward and eastward as well. For low-latitude Pi2 near the source site, the surface wave at the plasmapause, a localized field line oscillation inside the plasmapause, and the magne-tospheric/plasmaspheric cavity (resonance) mode are three important factors in affecting their waveforms. But for low-latitude Pi2 away from the source, the magnetospheric cavity (resonance) mode may be the main factor instead.
Acknowledgments. We thank all members of the CPMN project
for their ceaseless support. We acknowledge T. Uozumi for han-dling the CPMN data archives. The magnetometer data at the ATH and AFA stations were obtained with assistance from M. Connors and F. K. Chun. The K p index data were provided by National Geophysical Data Center, NOAA, Boulder, Colorado at the website (http://www.ngdc.noaa.gov/stp). TheAEindex data at CANOPUS were provided by G. Rostoker at University of Alberta in Canada and CDAWeb. The magnetic field data of GOES 8 and GOES 10 were provided by H. Singer at NOAA on the CDAWeb. This work was supported by National Science Council of R. O. C. on Taiwan under the grant NSC 92-2111-M-150-001.
References
Bauer, T. M., W. Baumjohann, and R. A. Treumann, Neutral sheet oscilla-tions at substorm onset,J. Geophys. Res.,100, 23,737–23,742, 1995. Baumjohann, W. and K. H. Glassmeier, The transient response mechanism
and Pi2 pulsations at substorm onset—Review and outlook,Planet. Space Sci.,32, 1361–1370, 1984.
Burchet al., Global dynamics of the plasmasphere and ring current during magnetic storms,Geophys. Res. Lett.,28, 1159–1162, 2001.
Cheng, C.-C., J.-K. Chao, and T.-S. Hsu, Evidence of the coupling of a fast magnetospheric cavity mode to field line resonances,Earth Planets Space,50, 683–697, 1998.
Cheng, C.-C., J.-K. Chao, and K. Yumoto, Spectral power of low-latitude Pi2 pulsations at 210◦ magnetic meridian stations and plasmaspheric cavity resonances,Earth Planets Space,52, 615–627, 2000.
Cheng, C.-C., C. T. Russell, Y. F. Gao, and P. J. Chi, On consecutive bursts of low-latitude Pi2 pulsations,J. Atoms. Sol. Terr. Phys.,64, 1809–1821, 2002a.
Cheng, C.-C., C. T. Russell, M. Connors, and P. J. Chi, Relationship between multiple substorm onsets and the IMF: A case study,J. Geophys. Res.,
107(A10), 1289, doi:10.1029/2001JA007553, 2002b.
Fujita, S. and M. Itonaga, A plasmaspheric cavity resonance in a longitu-dinally non-uniform plasmasphere,Earth Planets Space,55, 219–222, 2003.
Fujita, S., H. Nakata, M. Itonaga, A. Yoshikawa, and T. Mizuta, A numerical simulation of the Pi2 pulsations associated with the substorm current wedge, J. Geophys. Res.,107(A3), 1034, doi:10.1029/2001JA900137, 2002.
Gao, Y. F., P. J. Chi, G. Le, C. T. Russell, D. M. Yang, X. Zhou, S. F. Yang, V. Angelopoulos, and F. K. Chun, Sino-magnetic array at low latitudes
(SMALL) including initial results from the sister sites in the united states,
Adv. Space Res.,25, 1343–1351, 2000.
Itonaga, M., Spatial structure and polarization of geomagnetic pulsations observed on the ground,J. Geomag. Geoelectr.,47, 1023–1027, 1995. Itonaga, M. and K. Yomoto, ULF waves and the ground magnetic field,J.
Geophys. Res.,103, 9285–9291, 1998.
Kepko, L. and M. G. Kivelson, Generation of Pi2 pulsations by bursty bulk flows,J. Geophys. Res.,104, 25021–25034, 1999.
Kosaka, K., T. Iyemori, M. Nos´e, M. Bitterly, and J. Bitterly, Local time dependence of the dominant frequency of Pi2 pulsations at mid- and low-latitudes,Earth Planets Space,54, 771–781, 2002.
Lanzerotti, L. J. and L. V. Medford, Local night, impulsive (Pi2-type) hy-dromagnetic wave polarization at low latitudes,Planet. Space Sci.,32, 135–142, 1984.
Lee, D. H. and K. Kim, Compressional MHD waves in the magnetosphere: A new approach,J. Geophys. Res.,104, 12,379–12,385, 1999. Lester, M., H. J. Singer, D. P. Smits, and W. J. Hughes, Pi2 pulsations and
the substorm current wedge: Low-latitude polarization,J. Geophys. Res.,
94, 17133–17141, 1989.
Li, Y., B. J. Fraser, F. W. Menk, D. J. Webster, and K. Yumoto, Properties and sources of low and very low latitude Pi2 pulsations,J. Geophys. Res.,
103, 2343–2358, 1998.
Lin, C. A., L. C. Lee, and Y. J. Sun, Observations of Pi2 pulsations at a very low latitude (L=1.06) station and magnetospheric cavity resonances,J. Geophys. Res.,96, 21,105–21,114, 1991.
Mishin, V. M., T. Saifudinova, A. Bazarzhapov, C. T. Russell, W. Baumjo-hann, B. Nakamura, and M. Kubyshkina, Two distinct substorm onsets,
J. Geophys. Res.,106, 13,105–13,118, 2001.
Nos´e, M, Automated detection of Pi2 pulsations using wavelet analysis: 2. An application for dayside Pi2 pulsations study,Earth Planets Space,51, 23–32, 1999.
Nos´e et al., Multipoint observations of a Pi2 pulsation on morning-side: The 20 September 1995 event,J. Geophys. Res.,108(A5), 1219, doi:10.1029/2002JA009747, 2003.
Olson, J. V., Pi2 pulsations and substorm onsets: A review,J. Geophys. Res.,
104, 17,499–17,520, 1999.
Rankin, D. and R. Kurtz, Statistic study of micropulsation polarizations,J. Geophys. Res.,75, 5444–5458, 1970.
Russell, C. T., Interactive analysis of magnetic field data,Adv. Space Res.,
2(7), 173–176, 1983.
Russell, C. T., How northward turnings of the IMF can lead to substorm expansion onsets,Geophys. Res. Lett.,27, 3257–3259, 2000.
Shiokawa, K., W. Baumjohann, G. Haerendel, G. Paschmann, J. F. Fennell, E. Friis-Christensen, H. Luhr, G. D. Reeves, C. T. Russell, P. R. Sutciffe, and K. Takahashi, High-speed ion flow, substorm current wedge, and multiple Pi2 pulsations,J. Geophys. Res.,103, 4491–4507, 1998. Takahashi, K., S. I. Ohtani, and B. J. Anderson, Statistical analysis of Pi2
pulsations observed by the AMPTE CCE spacecraft in the inner magne-tosphere,J. Geophys. Res.,100, 21,929–21,941, 1995.
Takahashi, K., S. I. Ohtani, W. J. Hughes, and B. J. Anderson, CRRES ob-servation of Pi2 pulsations: Wave mode inside and outside the plasmas-phere,J. Geophys. Res.,106, 15,567–15,581, 2001.
Villante, U., M. Vellante, M. De Biase, L. J. Lanzerotti, and L. V. Medford, Pi2 pulsations at separate site ( 90◦): a comparison between mid-and low-latitude observations,Ann. Geophys.,10, 472–482, 1992. Yamaguchi et al., The timing relationship between bursty bulk flows
and Pi2s at the geosynchronous orbit, Geophys. Res. Lett., 29, doi:10.1029/2001GL013783, 2002.
Yumoto, K., Generation and propagation mechanisms of low-latitude mag-netic pulsations—A review,J. Geophys.,60, 79–105, 1986.
Yumoto, K., H. Osaki, K. Fukao, K. Shiokawa, Y. Tanaka, S. I. Soloeyev, G. Krymskij, E. F. Vershinin, V. F. Osinin, and 210◦ MM Magnetic Observation Group, Correlation of high- and low-latitude Pi2 magnetic pulsations observed at 210◦magnetic meridian chain stations,J. Geomag. Geoelectr.,46, 925–935, 1994.
Yumoto, K. and the CPMN Group, Chararcteristics of Pi2 magnetic pulsa-tions observed at the CPMN stapulsa-tions: A review of the STEP results,Earth Planets Space,53, 981–992, 2001.