R E S E A R C H A R T I C L E
Open Access
Linear trends and seasonality of births and
perinatal outcomes in Upper East Region,
Ghana from 2010 to 2014
Eric Osei
1,5*, Isaac Agbemefle
2, Gideon Kye-Duodu
3and Fred Newton Binka
4Abstract
Background:Seasonal variations greatly influence birth patterns differently from country to country. In Ghana, there is paucity of information on birth seasonal patterns. This retrospective study described the trends and seasonality of births and perinatal outcomes in Upper East Region of Ghana.
Methods:Births occurring in each month of the calendar years (2010–2014; inclusive) were extracted from the District Health Information Management System (DHIMS2) database of the Bolgatanga Municipal Health Directorate and exported into Microsoft Excel spread sheet and Epi Ifo for analysis. Analysis was carried out by calculating average number of births per month correcting for unequal month length using 30 days. A Chi-square test for trend was performed to check for statistical significance (p< 0.05) in trends and seasonality of birth and perinatal outcomes.
Results:There were 24,171 health facility deliveries, of which 97.7 % were singleton deliveries and 2.3 % were multiple (two or three) deliveries. There was a consistent rise in the annual health facility deliveries controlled for the number of fertile women, from 4169 in 2010 to 5474 in 2014 (p< 0.0001). Monthly birth distribution displayed a periodic pattern with peaks in May, September and October and troughs during the months of January, February and July (p< 0.0001). Women were likely to give birth during the raining season than the dry season. Caesarean Section (CS) rate showed a steady rise over the years (124 per 1000 births in 2010 to 185 per 1000 births in 2014 (p< 0.0001) with overall rate of 14.6 %. Stillbirth (SB) rate, however decreased slightly over the years from 29 per 1000 births to 23 per 1000 births (p= 0.197) with overall SB rate of 2.6 %. Similarly, Low Birth Weight (LBW) declined from 77 per 1000 live births to 71 per 1000 live births from 2010 to 2014 (p< 0.0001). Seasonal (rainy and dry) distributions did not show a clear difference in birth frequencies.
Conclusion:Health facility delivery was persistently high in the Bolgatanga Municipality with birth peaking in May, September and October. Despite the rising rate of caesarean section, stillbirth rate did not significantly improved over the years. A prospective study may reveal the reasons for the increasing caesarean section rate. Additionally, understanding the factors that affect the decreasing trends of low birth weight in the municipality is crucial to public health policy makers in Ghana.
Keywords:Births, Seasonality, Perinatal outcomes, Low birth weight, Stillbirth, Caesarean section
* Correspondence:erickosei15@gmail.com 1
Department of Population and Behavioural Sciences, School of Public Health, University of Health and Allied Sciences, Ho, Volta Region, Ghana 5School of Public Health, University of Health and Allied Sciences, PMB 31, Ho, Volta Region, Ghana
Full list of author information is available at the end of the article
Background
A very important feature of natality is its seasonal patterns analogous to occurrence of incidence of infections [1]. Seasonality patterns in frequency of births have been well described by many researchers [2–5] with great variation from country to country. Studies in the United States found that there is a persistent birth peak in autumn (Au-gust-September) and minimum birth in spring (March-May) [6, 7]. In Europe, major early spring peak (April) with a minor autumn peak has been described, similar to the Japanese type [8, 9]. It was reported in Australia that there was a significant shift from a September peak in early 1960s to a February-March peak in the late 1970s and also noted that there was a February-March peak in the northernmost states and a September-October peak in the southernmost States [10]. Evolving changes in the birth rhythm pattern have also been reported. In most cases, there is a common trend towards a decrease in spring births and increase in autumn births, with a decline in amplitude and subsequent loss of seasonality [9].
In Sub-Saharan Africa, the magnitude of birth out-comes changes drastically over time even within a coun-try. A very high degree of birth seasonality was reported in Northwest Kenya as compared to other parts of Kenya [11]. Similar birth patterns were reported in four locations in Tanzania whist several locations had erratic birth patterns [12]. In Democratic Republic of Congo, birth seasonality differed among farmers [13]. Racial dif-ferences have also been documented in South Africa: birth seasonality more pronounced in blacks than whites [6]. Generally, the putative hypotheses for the variations in birth seasonality are multi-factorial in origin but can be broadly grouped into three categories: (1) seasonality due to social factors (marriage, holidays, contraception, etc.) that influence the frequency of intercourse; (2) sea-sonality due to climatological factors that directly affect human fecundity; and (3) seasonality due to energetic factors that principally affect female fecundity [14].
Birth outcomes are important early indicators of individ-ual and community well-being. Of particular importance are birth weight and perinatal death, with adverse out-comes such as low birthweight (LBW), stillbirth (SB), and premature delivery presenting common threats to a child’s development, increasing a child’s risk for a variety of condi-tions, such as cognitive impairment and attention-deficit disorder [15]. There is paucity of evidence on birth patterns in Ghana. The aim of this study was to examine the trends and seasonality of birth frequency and perinatal outcomes in Bolgatanga Municipality of Upper East Region, Ghana.
Methods
Study design and setting
This was a retrospective cross sectional study of all births recorded in the Bolgatanga Municipal Health
Directorate database from January, 2010 to December, 2014. The Municipality is located in the central part of the Upper East Region of Ghana, and is also the Regional Capital. It serves a population of 137,979 [16]. There are 28 public health facilities made up of 1 hospital, four health centres, five clinics and 18 Community-based Health Planning and Services (CHPS) centres, of which 26 conduct delivery services and report to the Health Direct-orate. There are on average 12 health facility deliveries in the Municipality every day. The climate of the municipal-ity is classified as tropical and has two distinct seasons–a rainy season that runs from May to October and a dry season that stretches from November to April; with erratic rainfall patterns [17].
Data source
The District Health Information Management System (DHIMS2) database is free, internet-based open source software that is being used by a number of countries all over the world and can be accessed by users who have been approved by the health facility at www.ghsdhim-s2.org. The database serves as a data collection, record-ing and compilation tool, and houses routine clinical and public health data including morbidities and mortal-ities, admissions, and reproductive and child health data. Data entry is done monthly at the service delivery point in list of data elements or in customized user defined forms based on paper form and are aggregated into a district summary. Data are then validated by the district health management team by running validation rules to identify violations.
Data handling and analysis
with skilled deliveries due to differences in their qualifi-cation. Chi square for trend and Odds Ratios (OR) were generated using Epi Info Version 7 and statistical signifi-cance was set atp-value <0.05.
In this study, low birth weight (LBW) was defined as a birth weight of a liveborn infant of less than 2.5 kg re-gardless of gestational age [18]. Stillbirths (SB) are babies born after 28 weeks of gestation [18]. Fresh stillbirths are babies born dead not showing signs of life at birth and no signs of maceration [18]. Traditional Birth At-tendant also known as lay midwife, was defined as one who provide basic pregnancy and birthing care and ad-vice before, during and after pregnancy and child birth based primarily on experience and knowledge acquired informally through the traditions and practices of the communities where they originated [19]. On the other hand, a skilled birth attendant was defined as “some-one trained to proficiency in the skills needed to manage normal (uncomplicated) pregnancies, child-birth and the immediate postnatal period, and in the identification, management and referral of complica-tions in women and newborns” [20]. Facility delivery was defined as any delivery occurring in an accredited healthcare facility [18].
Ethical statement
This study was based on routine service delivery data analysis for purposes of programme monitoring and evaluation. The data analysed had no identifiers for any of the women served and was exempted from ethical
approval. However, permission to analyse the data was sought from the management of the Bolgatanga Munici-pal Health Directorate.
Results
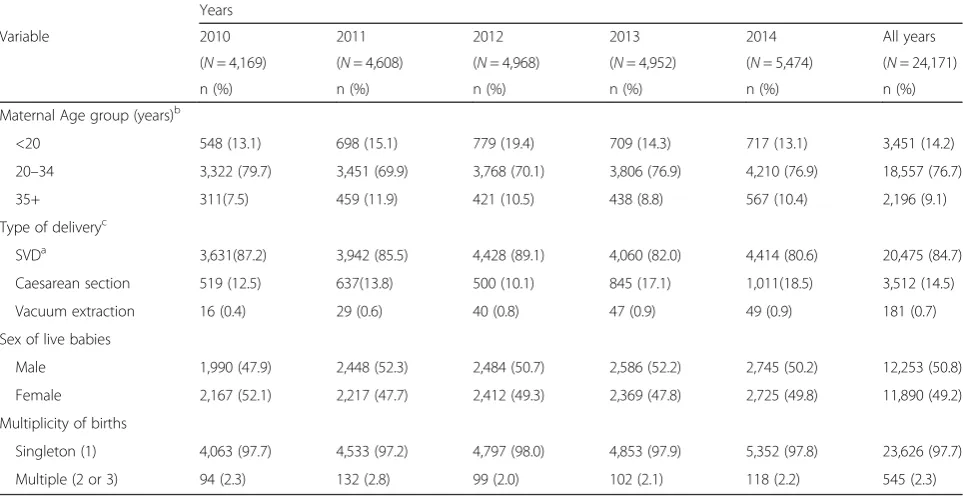
There were 24,171 health facility deliveries during the study period with an average annual and monthly deliv-ery of 4834 and 413 respectively. Overall, 97.7 % were singleton deliveries and the remaining were multiple (two or three) deliveries as shown in Table 1. Most (76.7 %) of the mothers were between the ages of 20 and 34 years old, more than 14 % were teenagers and a fur-ther 9 % were above 35 years of age. The vast majority of deliveries (84.7 %) were spontaneous vaginal deliveries and the remaining (14.5 %) were by caesarean section and vacuum (0.7 %). About 51 % of the live births were males as shown in Table 1.
Trends of deliveries
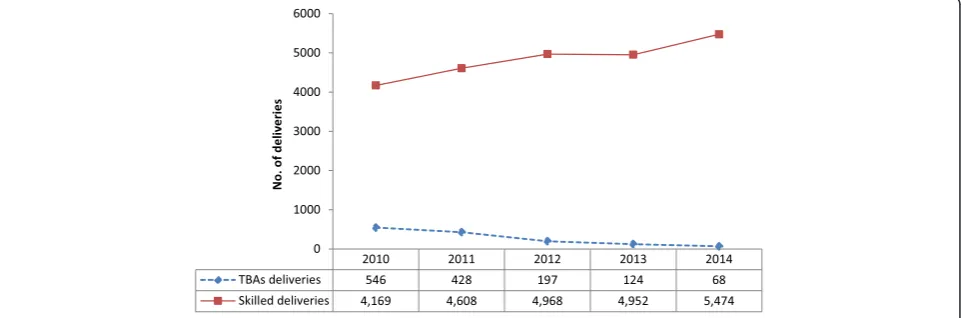
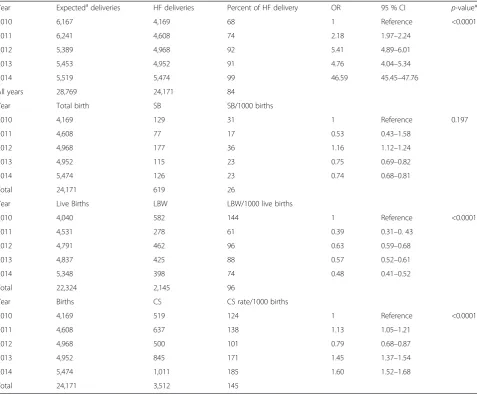
Overall, delivery in a health facility was 84 % (95 % CI: 83.6–84.4). There was a steady and substantial increase in the number of health facility deliveries in the study setting, from 4169 (68 %; 95 % CI: 60–76) (monthly average: 348; range: 245–535) in the year 2010 to 5474 (99 %; (95 % CI: 96–102) (monthly average: 456; range: 340–570) in 2014 (p< 0.0001) with an average annual percent increase of 10 %. This observed trend was how-ever, the opposite for TBA deliveries. During the study period, there were 1363 TBAs deliveries, which showed a progressive decline over the years from 546 in 2010 to
Table 1Obstetric characteristics of women who delivered at a health facility in Bolgatanga Municipality, Ghana, from 2010 to 2014
Years
Variable 2010 2011 2012 2013 2014 All years
(N= 4,169) (N= 4,608) (N= 4,968) (N= 4,952) (N= 5,474) (N= 24,171)
n (%) n (%) n (%) n (%) n (%) n (%)
Maternal Age group (years)b
<20 548 (13.1) 698 (15.1) 779 (19.4) 709 (14.3) 717 (13.1) 3,451 (14.2)
20–34 3,322 (79.7) 3,451 (69.9) 3,768 (70.1) 3,806 (76.9) 4,210 (76.9) 18,557 (76.7)
35+ 311(7.5) 459 (11.9) 421 (10.5) 438 (8.8) 567 (10.4) 2,196 (9.1)
Type of deliveryc
SVDa 3,631(87.2) 3,942 (85.5) 4,428 (89.1) 4,060 (82.0) 4,414 (80.6) 20,475 (84.7)
Caesarean section 519 (12.5) 637(13.8) 500 (10.1) 845 (17.1) 1,011(18.5) 3,512 (14.5)
Vacuum extraction 16 (0.4) 29 (0.6) 40 (0.8) 47 (0.9) 49 (0.9) 181 (0.7)
Sex of live babies
Male 1,990 (47.9) 2,448 (52.3) 2,484 (50.7) 2,586 (52.2) 2,745 (50.2) 12,253 (50.8)
Female 2,167 (52.1) 2,217 (47.7) 2,412 (49.3) 2,369 (47.8) 2,725 (49.8) 11,890 (49.2)
Multiplicity of births
Singleton (1) 4,063 (97.7) 4,533 (97.2) 4,797 (98.0) 4,853 (97.9) 5,352 (97.8) 23,626 (97.7)
Multiple (2 or 3) 94 (2.3) 132 (2.8) 99 (2.0) 102 (2.1) 118 (2.2) 545 (2.3)
a
68 in 2014 (p< 0.0001); a decline rate of 87.5 % from 2010 to 2014 (Fig. 1).
Seasonal pattern of births
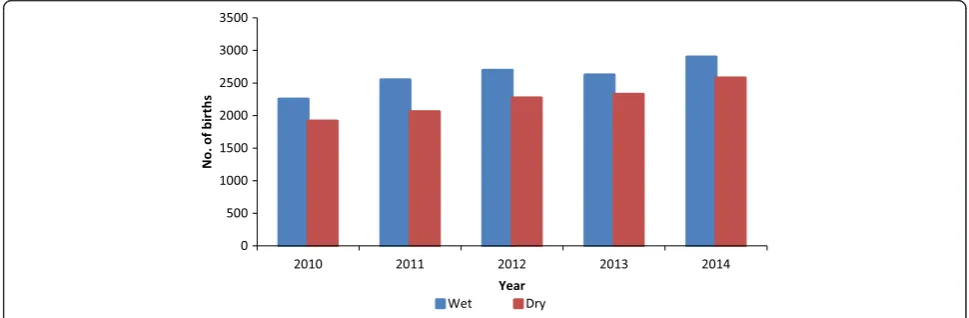
The average monthly distribution of health facility deliv-eries showed a slightly periodic pattern, the peak span-ning during the months of May, September and October in all of the five calendar years. On the contrary, nadir was noticed twice: during the months of February, and thereafter in July (Table 2 and Fig. 2). Seasonal distribu-tions throughout the period under review showed higher birth rates in the rainy season as compared to the dry season (Fig. 3).
Trends of perinatal outcomes
Caesarean Section rate (CS) showed a steady increase over the years from 124 per 1000 live births in 2010 (95 % CI: 113–135) to 185 per 1000 live births in 2014 (95 % CI: 74 %–196 %;p< 0.0001; Table 2). The overall CS rate for the study period was 14.6 % (95%CI: 14.1 %– 15.0 %). Stillbirth however, declined over the years from 31 per 1000 live births in 2010 (95 % CI: 26–37) to 23 per 1000 live births in 2014 (95 % CI: 19–27) (p= 0.197). On the other hand, Low birthweight rate significantly declined from 144 per 1000 live births in 2010 (95 % CI: 134–155) to 74 per 1000 live births in 2014 (95 % CI: 68–82) (p< 0.0001) as shown in Table 3. The overall prevalence of Low birthweight and stillbirths were 10 % (95%CI: 9 %–10 %) and 3 % (95%CI: 2 %–3 %) respect-ively. Nearly four in ten stillbirths were fresh stillbirths.
Discussion
Delivery trends
The single most essential intervention for reducing mor-bidity and mortality is to ensure that a health worker with midwifery skills is present at every child birth [21]. Con-sidering this fact, the proportion of births attended by a skilled health personnel is used as one of the major
indicators to monitor progress towards the achievement of the Millennium Development Goal of reducing mater-nal mortality ratio [22, 23]. We found in this study that there was a persistent increase in the proportion of births attended by skilled personnel in a health facility, ranging from 68 % in 2010 to 99 % in 2014 with the overall preva-lence of 84 % during the 5 year time frame. This result corroborates with what is contained in the 2014 Ghana demographic and health survey (GDHS) report, where the proportion of births occurring in a health facility increased progressively from 42 % in 1988 to 73.1 % in 2014. In the Upper East Region, 84.1 % of births occurred in a health facility [24]. The closeness of the results lends credibility to our study findings. Dzakpasu et al., also reported a sig-nificant increase in health facility delivery over time in the Brong Ahafo Region, Ghana [25].
Our finding, however, is in contrast to findings ob-served in other African studies. Gitimu and colleagues
Fig. 1Annual trends of deliveries in Bolgatanga Municipality
Table 2Average number of births per month, 2010–2014
Month aAvg. No, of births Percentage Odds ratio 95 % CI
January 310 6.5 1 reference
February 336 7.0 1.09 0.98–1.17
March 371 7.8 1.21 1.14–1.30
April 420 8.8 1.39 1.24–1.48
May 435 9.1 1.44 1.36–1.49
June 389 8.2 1.23 1.18–1.29
July 351 7.4 1.14 1.06–1.21
August 376 7.9 1.23 1.16–1.29
September 504 10.6 1.70 1.59–1.78
October 493 10.3 1.66 1.58–1.72
November 421 8.8 1.49 1.38–1.57
December 360 7.6 1.25 1.19–1.32
Total 4,766 100.0
χ2
for trend: 33.3;p-value: <0.0001;a
[26] reported in a study in Kenya that only 40.3 % of births were attended by skilled personnel. Meselech et al. found in a qualitative study in South Central Ethiopia that majority of women gave birth at home and home delivery is taken as a common practice [27]. This differ-ence could be attributed to the differdiffer-ences in financial access to maternal health services. In an attempt to in-crease skilled birth attendance and reduce inequality in use of services, the Government of Ghana in September 2003, introduced a policy exempting women in its four poorest regions including the region of the study site from paying for delivery services. Subsequently, in July 2008, the government introduced a policy exempting pregnant women from paying the National Health Insur-ance Scheme (NHIS) registration and premium fees when funding for the delivery fee exemption policy was running out [28]. These policies may have accounted for the high utilization of health facility deliveries. On the contrary, births conducted by TBAs expectedly reduced substantially from 546 births in 2010 to 68 births in 2014 representing about 87 % reduction. This downward trend observed in the TBAs deliveries could be as a re-sult of Ghana Health Services decision of fading away
TBAs deliveries due to the risk it places on the lives of both mother and child as a result of poor delivery condi-tions. For this reason TBAs are encourage and are given incentives to refer all labouring women to the nearest health facility and therefore the trends of deliveries con-ducted by them are expected to decline [17]. Meselech et al., however concluded in their study that women lied on Traditional Birth Attendants for delivery as a re-sult of varying reasons including cost of service [27].
Seasonal patterns of births
Using birth data from January 2010 to December 2014, this study was able to identify a strong birth peak in May, September and October and a nadir in January, February and July. Also, this study observed significant variations in average monthly frequency of births and this is in agreement with reports from other parts of the world. In India, the maximum number of births oc-curred in August to October and minimum in the month of January [3, 29]. Odegard observed a September peak in Norway and hypothesised that this could be due to maximum conception during the traditional mid-winter festivities [30]. Eriksson et al. [31] reported two
Fig. 2Monthly distribution of births by year in Bolgatanga Municipality
peaks of birth in March/April and another in September/ October in their record based study in Finland for the period 1650 to 1950. The National vital statistics report of the United States, indicates that births peak generally in August and reach a minimum in February [32]. However, the findings of this study contradict what was observed in other African countries. In rural Senegal, spikes of birth were observed for the month of February through May [33]. Another recent Nigerian hospital based study showed slightly sinusoidal pattern of birth with two peaks: a major peak spanning through April and May and an-other in October. Minimum number of births occurred in the months of July, August and December [34].
The pattern of birth seasonality exhibited by human populations around the world possibly stems from sev-eral factors, with the most important factors varying be-tween populations and through time. Three groups of
these factors have been proposed as playing important roles. These are, social factors affecting the frequency of intercourse; climatological factors affecting fecundity; and energetic factors principally affecting female ovarian function [14]. The seasonal variation in births observed in our study suggests that the women in the study site were more likely to get pregnant in the months of De-cember/January (dry season) with births occurring in September/October (rainy season) and less likely to get pregnant in the months of April/May (rainy season) with births occurring in January/February (dry season).
Environmental conditions such as temperature, sun-light and humidity have been associated with birthing and birth outcomes [35, 36]. The dry season also re-ferred to as the hot season in Ghana is characterised by high temperature, increased duration of sunlight and low humidity. The present study reports low birthing in
Table 3Annual trends of health facility delivery and perinatal outcomes in Bolgatanga Municipality, Ghana from 2010 to 2014
Year Expectedadeliveries HF deliveries Percent of HF delivery OR 95 % CI p-value*
2010 6,167 4,169 68 1 Reference <0.0001
2011 6,241 4,608 74 2.18 1.97–2.24
2012 5,389 4,968 92 5.41 4.89–6.01
2013 5,453 4,952 91 4.76 4.04–5.34
2014 5,519 5,474 99 46.59 45.45–47.76
All years 28,769 24,171 84
Year Total birth SB SB/1000 births
2010 4,169 129 31 1 Reference 0.197
2011 4,608 77 17 0.53 0.43–1.58
2012 4,968 177 36 1.16 1.12–1.24
2013 4,952 115 23 0.75 0.69–0.82
2014 5,474 126 23 0.74 0.68–0.81
Total 24,171 619 26
Year Live Births LBW LBW/1000 live births
2010 4,040 582 144 1 Reference <0.0001
2011 4,531 278 61 0.39 0.31–0. 43
2012 4,791 462 96 0.63 0.59–0.68
2013 4,837 425 88 0.57 0.52–0.61
2014 5,348 398 74 0.48 0.41–0.52
Total 22,324 2,145 96
Year Births CS CS rate/1000 births
2010 4,169 519 124 1 Reference <0.0001
2011 4,608 637 138 1.13 1.05–1.21
2012 4,968 500 101 0.79 0.68–0.87
2013 4,952 845 171 1.45 1.37–1.54
2014 5,474 1,011 185 1.60 1.52–1.68
Total 24,171 3,512 145
the dry season as compared to the wet season. This may relate to the proportion of women birthing in healthcare facilities during the dry season. Access to healthcare fa-cilities in the dry season may be affected by high temperature and increased duration of sunlight. In northern Ghana, women have to travel long distances (about 8 km) in order to access healthcare facilities. The heat and stress of walking long distances in the sun may encourage the patronage of substandard health services such as the Traditional birth attendance (TBA) which are within close radius to the women.
Additionally, prolonged exposures to high ambient temperatures may induce dehydration which has impli-cations for poor pregnancy outcomes. Data from Nepal showed that the highest preterm birthing corresponded to high temperature exposures [37], possibly due to greater risk of labour induction as a result of decreased uterine blood flow when dehydration sets in [38]. On the other hand, the low birthing during the dry season can be attributed to increased risk of infection such as malaria during the rainy season. During the raining sea-son, pregnant women in malaria endemic areas like Ghana become at higher risk of contracting malaria in-fection that leading to poor pregnancy outcomes such as foetal loss [36].
The seasonality patterns examined in this study may improve our understanding of the environmental factors associated with birthing and birth outcomes. The vari-ation in the monthly frequency of births described may also have implications for public health policies and pro-grammes on the optimal timing of interventions in the Northern part of the country aimed at improving birth outcomes and child health. A surge in a local infant population is likely to subtly influence the pattern of outbreaks of childhood diseases. When many babies are born around the same time, they become susceptible to a disease simultaneously and might thus transmit the disease more readily. Health managers may use this knowledge to plan targeted interventions to stop any possible disease outbreak.
Trends of perinatal outcomes
According to the World Health Organization (WHO), it is unjustified to have CS rate above 15 % [39]. The ob-served overall CS rate for the study period was 14.6 %, close to the upper limit of the WHO’s recommended rate. The 2007 Ghana Maternal Health Survey reported CS rate of 12 % in the country and 5.1 % in the Upper East Region where this study was located. The Regional hospital being the only referral centre in the Upper East Region where this study was located receives high risk ob-stetric referrals from across the region and beyond, which inevitably led to increased caesarean deliveries, thus explaining our much higher proportion of caesarean
sections compared to the regional estimate. Our finding is however, lower than several other studies [40–42].
The overall prevalence of stillbirths observed in this study was 26 per 1000 births, which compares favourably with reported rates in other hospital-based studies in Ghana [43–45] and other Sub-Saharan African studies [46–49]. The previous Ghanaian studies were conducted in two tertiary hospitals (Korle-Bu and Okomfo Anokye Teaching Hospitals), and being the major referral centres in the country, the hospitals receive high risk obstetric re-ferrals which predictably result in increased adverse preg-nancy outcomes, thus explaining the discrepancies in still birth rates reported in the aforementioned studies in Ghana and in this present study. The still birth prevalence reported here is consistent with the national estimate of 21 per 1000 births [50]. About 40 % of the observed still-births were fresh, an indication that a number of these cases could likely have been prevented [51].
According to the World Health Organization (WHO), any baby with a birth weight below 2500 g is considered to have low birthweight [52]. This study also demon-strated that LBW among live babies decreased signifi-cantly between 2010 and 2014. The decline was more pronounced from 2010 to 2011. The overall prevalence of LBW in this study was 10 %. This is slightly lower than LBW estimates from Ethiopia (11.2 %) [47]. Simi-larly, this finding is far lower than reports from other Ethiopian studies [53, 54]. This high discrepancy could mainly be due to methodological variations. The afore-mentioned studies were limited to tertiary hospital data. However, data from this present study were aggregated mainly from secondary hospitals, health centres and clinics where relatively most normal deliveries take place.
One limitation of this study is that it is hospital-based, and therefore, failed to capture all the births in the com-munity. Thus results should be taken with some caution. Nevertheless, this is unlikely to influence the outcome of this study as over 80 % of deliveries were hospital-based.
Conclusion
Health facility delivery is persistently high in the Bolga-tanga Municipality and the birth seasonality peaked in May, September and October. Despite the rising rate of caesarean section, stillbirth rate did not significantly im-proved over the years. A prospective study may reveal the reasons for the increasing caesarean section rate. Moreover, understanding the factors that affect the de-creasing trends of low birthweight in the municipality is crucial to public health policy makers in Ghana. Improv-ing quality of obstetric care durImprov-ing labour and delivery can further reduce these adverse birth outcomes.
Competing interest
Authors’contributions
EO conceived the study and carried out initial data analysis. EO and IA carried out the final data analysis. EO wrote the first draft of the manuscript. EO and IA wrote the subsequent drafts. IA, GKD, and FNB critically reviewed the first draft and the subsequent versions of the manuscript. All authors read and approved the final manuscript.
Acknowledgement
We are grateful to the management of Bolgatanga Municipal Health Directorate for granting us the permission to publish this data. We appreciate the role played by Ms Wasila Tiabu in providing us with additional information for better understanding of the data.
Author details
1Department of Population and Behavioural Sciences, School of Public Health, University of Health and Allied Sciences, Ho, Volta Region, Ghana. 2
Department of Family and Community Health, School of Public Health, University of Health and Allied Sciences, Ho, Volta Region, Ghana. 3Department of Epidemiology and Biostatistics, School of Public Health, University of Health and Allied Sciences, Ho, Volta Region, Ghana. 4
Chancellery, University of Health and Allied Sciences, Ho, Volta Region, Ghana.5School of Public Health, University of Health and Allied Sciences, PMB 31, Ho, Volta Region, Ghana.
Received: 24 September 2015 Accepted: 3 March 2016
References
1. Amariei A-M, Elisabeta J. Birth Seasonality - A comparison between five countries from 2004 to 2013. Macrotheme Rev. 2015;4:3.
2. Enabudoso EJ, Okpighe AC, Okpere EE. Delivery rate in Benin city, are there seasonal variation. Niger Clin Pr. 2011;14:129–31.
3. Sandeep S, Ruchi S, Smiti N. Monthly pattern and distribution of births in a teaching institution of Northern India. J Basic Clin Reprod Sci. 2014;3:2. 4. Cowgill U. Season of birth in man. Ecol Soc Am. 1966;47(6):14–23. 5. Daminda PW, MacIntyre CR. Seasonality of births and abortions in New
South Wales, Australia. Med Sci Monit. 2003;9:12.
6. Lam D, Miron J. Seasonality of birth in human populations. Soc Biol. 1991; 38:51–78.
7. Seiver D. Seasonality of fertility: new evidence. Popul Envir. 1989;10:245–57. 8. Lam D, Miron J. The effects of temperature on human fertility. Demography.
1996;33:291–305.
9. Ramon C, Jesus M, Andres L, Julio A. Decline and loss of birth seasonality in Spain: analysis of 33,421,731 births over 60 years. Epid Comm Health. 2007;61:713–18.
10. Mathers C, Harris R. Seasonal distribution of births in Australia. Int J Epidemiol. 1983;12(3):326–31.
11. Leslie P, Fry H. Extreme seasonality of births among nomadic Turkana pastoralists. Am J Phys Anthr. 1989;79(1):103–15.
12. Bantje H. Seasonality of births and birthweights in Tanzania. Soc Sci Med. 1987;24(9):733–9.
13. Bailey R, Jenike M, Ellison P, Bentley G, Harrigan A, Peacock N. The ecology of birth seasonality among agriculturalists in central Africa. J Biosoc Sci. 1992;24(3):393–412.
14. Peter TE, Claudia RV, Diana S.“Human birth seasonality”, in Seasonality in primates: studies of living and extinct human and non-human primates. Cambridge: University Press; 2005.
15. Saigal S, Doyle L. An overview of mortality and sequelae of preterm birth from infancy to adulthood. Lancet. 2008;371:261–9.
16. Ghana Statsitical Services. 2010 population and housing census. 2012. 17. Bolga MHD. Annual performance report, Bolgatanga Municipal Health
Directorate. Bolgatanga: Ghana Health Services; 2014.
18. Ministry of Health, Ghana,“Ghana National Newborn Health Strategy and Action Plan 2014–2018.”Jul-2014.
19. World Health Organization. Classifying health workers. Geneva: WHO; 2010. 20. WHO, ICM, and FIGO. Making pregnancy safer: the critical role of the skilled
attendant: a joint statement. Geneva: World Health Organization; 2004. 21. WHO. The WHO and the millennium development goals. Geneva: World
Health Organization; 2005. Fact sheet.
22. Hogan M, Foreman K, Naghavi M, Ahn S, Wang M, Makela S, et al. Maternal mortality for 181 countries, 1980–2008: a systematic analysis of progress towards millennium development goal 5. Lancet. 2010;375(9726):1609–23. 23. Ronsmans C, Graham W. Maternal mortality: who, when, where, and why.
Lancet. 2006;368(9542):1189–200.
24. Ghana Statistical Service and Ghana Health Service. Ghana Demographic and Health Survey 2014: Key Indicators. Accra, Ghana: 2015. Retrived at http://www.statsghana.gov.gh/docfiles/hdhs2014. Accessed 20 Oct 2015. 25. Dzakpasu S, Soremekun S, Manu A, ten Asbroek G, Tawiah C, Hurt L, et al.
Impact of free delivery care on health facility delivery and insurance coverage in Ghana’s Brong Ahafo region. 2012.
26. Gitimu A, Herr C, Oruko H, Karijo E, Gichuki R, Ofware P, et al. Determinants of use of skilled birth attendant at delivery in Makueni, Kenya: a cross sectional study. BMC Pregnancy Childbirth. 2015;15:9.
27. Meselech AR, Emebet MH, Alemayehu ML, Seifu HG, Mesganaw FA. Why do women not deliver in health facilities: a qualitative study of the community perspectives in south central Ethiopia. BMC Res. 2014;7:556. Notes 2014 7556.
28. Witter S, Arhinful DK, Kusi A, Zakariah-Akoto S. The experience of Ghana in implementing a user fee exemption policy to provide free delivery care. Reprod Health Matters. 2007;15(30):61–71.
29. Rajir M, Sunita S, Richa K, Vijayata S, Ritika K, Pooja G. Pattern of delivery during three calendar years in rural India. El Med J. 2014;2:2.
30. Odegard O et al. Season of birth in the population of Norway, with particular reference to the September birth maximum. Br J Psychiatry. 1977;131(4):339–44. 31. Eriksson A, Fellman J, Jorde L, Pitkänen K. Temporal, seasonal, and regional
differences in births and deaths in Åland (Finland). Hum Biol. 2008;80:125–40. 32. J. A. Martin, B. E. Hamilton, P. D. Sutton, S. J. Ventura, F. Menacker, S.
Kimeyer, and M. S. Mathews,“Births: Final data for 2006. National vital statistics reports. vol. 57, no 7,”Hyattsville MD Natl. Cent. Health Stat., 2009 33. Pitt MM, Sigle W. Seasonality, weather shocks and the timing of births and
child mortality in Senegal. Brown University, Population Studies and Training Centre, 1998. Available from http://www.pstc.brown.edu/2mp/ paper/methoda.pdf. Accessed 21 Oct 2015.
34. Enabudoso EJ, Okpighe AC, Gharoro EP, Okpere EE. Delivery rate in Benin City, Nigeria: are there seasonal variations? Niger J Clin Pract. 2011;14(2): 129–31.
35. Lawlor D, Leon D, Smith G. The association of ambient outdoor temperature throughout pregnancy and offspring birth weight: findings from the Aberdeen Children of the 1950s cohort. BJOG. 2005;112:647–57. 36. Torche F, Corvalan A. Seasonality of birth weight in Chile: environmental
and socioeconomic factors. Ann Epidemiol. 2010;20:818–26.
37. Michelle M, Hughes M, Joanne Katz J, Mullany L, Khatry S, LeClerq S, et al. Seasonality of birth outcomes in rural Sarlahi District, Nepal: a population-based prospective cohort. BMC Pregnancy Childbirth. 2014;14:310–9. 38. Stan C, Boulvain M, Pfister R, Hirsbrunner-Almagbaly P. Hydration for treatment of preterm labour. Cochrane Database Syst Rev. 2013;11: CD003096.
39. World Health Organization,“Joint Interregional Conference on Appropriate Technology for Birth. Fortaleza,”Brazil, 1985. Australian Collage of Midwives Incorporated Journal, 1888;1(2):18-19
40. Oladapo O, Sotunsu J, Sule-Odu A. The rise in Caesarean birth in Sagamu, Nigeria: reflection of change in obstetrics practice. J Obstet Gynecol. 2004; 24:377–81.
41. Aisien A, Lawson J, Adebayo A. A five year appraisal of caesarean section in a Northern Nigerial University Teaching Hospital. Niger Postgrad Med J. 2002;9:146–50.
42. Dobson R. Caesarean section rate in England and Wales hits 21. BMJ. 2001; 323(7319):951.
43. Abdallah I, Anne MO. Do Infant birth outcomes vary among mothers with and without health insurance coverage in sub-saharan africa? findings from the national health insurance and cash and carry Eras in Ghana, West Africa. Int J MCH AIDS. 2014;2(2):200–8.
44. Dassah ET, Odoi AT, Opoku BK. Stillbirths and very low Apgar scores among vaginal births in a tertiary hospital in Ghana: a retrospective cross-sectional analysis. BMC Pregnancy Childbirth. 2014;14:1.
45. Anyebuno M. Perinatal mortality in Korle Bu teaching hospital, Accra. Ghana Med J. 1996;30:710–4.
47. Akilew AA, Tadesse AA, Leta GA, Bikes DB, Berihun MZ. Adverse birth outcomes among deliveries at Gondar University Hospital, Northwest Ethiopia. BMC Pregnancy Childbirth. 2014;14:90.
48. Kuti O, Orji EO, Ogunlola IO. Analysis of perinatal mortality in a Nigerian teaching hospital. J Obstet Gynecol. 2003;23(5):512–4.
49. Fawole AO, Shah A, Tongo O, Dara K, El-Ladan AM, Umezulike AC, et al. Determinants of perinatal mortality in Nigeria. Int J Gynecol Obstet. 2011; 114(1):37–42.
50. Ghana Statistical Service, Ghana Health Service, and Macro International. Ghana maternal health survey 2007. Calverton: GSS, GHS and Macro International; 2009.
51. Feresu SA, Harlow SD, Welch K, Gillespie BW. Incidence of and socio-demographic risk factors for stillbirth, preterm birth and low birthweight among Zimbabwean women. Paediatr Perinat Epidemiol. 2004;18(2):154–63. 52. World Health Organization. International statistical classification of diseases
and related health problems, tenth revision. Geneva: World Health Organization; 1992.
53. Zeleke BM, Zelalem M, Mohammed N. Incidence and correlates of low birth weight at a referral hospital in Northwest Ethiopia. Pan Afr Med J. 2012;12(1). 54. Tema T. Prevalence and determinants of low birth weight in Jimma Zone,
Southwest Ethiopia. East Afr Med J. 2006;83(7):366.
• We accept pre-submission inquiries
• Our selector tool helps you to find the most relevant journal
• We provide round the clock customer support
• Convenient online submission
• Thorough peer review
• Inclusion in PubMed and all major indexing services • Maximum visibility for your research
Submit your manuscript at www.biomedcentral.com/submit