R E S E A R C H
Open Access
Color interpolation algorithm for an RWB
color filter array including double-exposed
white channel
Ki Sun Song, Chul Hee Park, Jonghyun Kim and Moon Gi Kang
*Abstract
In this paper, we propose a color interpolation algorithm for a red-white-blue (RWB) color filter array (CFA) that uses a double exposed white channel instead of a single exposed green (G) channel. The double-exposed RWB CFA pattern, which captures two white channels at different exposure times simultaneously, improves the sensitivity and provides a solution for the rapid saturation problem of W channel although spatial resolution is degraded due to the lack of a suitable color interpolation algorithm. The proposed algorithm is designed and optimized for the double-exposed RWB CFA pattern. Two white channels are interpolated by using directional color difference information. The red and blue channels are interpolated by applying a guided filter that uses the interpolated white channel as a guided value. The proposed method resolves spatial resolution degradation, particularly in the horizontal direction, which is a challenging problem in the double-exposed RWB CFA pattern. Experimental results demonstrate that the proposed algorithm outperforms other color interpolation methods in terms of both objective and subjective criteria.
Keywords: Color interpolation, Double-exposed white channel, Directional color difference, Guided filter
1 Introduction
Most digital imaging devices use a color filter array (CFA) to reduce the cost and size of equipment instead of using three sensors and optical beam splitters. The Bayer CFA, which consists of primary colors such as red, green, and blue (R, G, and B) is a widely used CFA pattern [1]. Recently, methods using a new CFA have been stud-ied to overcome the limited sensitivity of the Bayer CFA under low-light conditions. The reason for this is that the amount of absorbed light decreases due to the RGB color filters. When white (panchromatic) pixels (W) are used, sensors can absorb more light, thereby providing an advantage in terms of sensitivity [2–7]. Despite of the sen-sitivity improvement, various RGBW CFA patterns suffer from spatial resolution degradation. The reason for this degradation is that the sensor is composed of more color components than the Bayer CFA pattern. In spite of this drawback, some industries have developed image sensors using the RGBW CFA pattern to improve sensitivity [2, 7].
*Correspondence: [email protected]
School of Electrical and Electronic Engineering, Yonsei University, 50 Yonsei-Ro, Seodaemun-Gu, 03722 Seoul, Republic of Korea
They have attempted to overcome the degradation of the spatial resolution by using new CI algorithms especially designed for their RGBW CFA pattern.
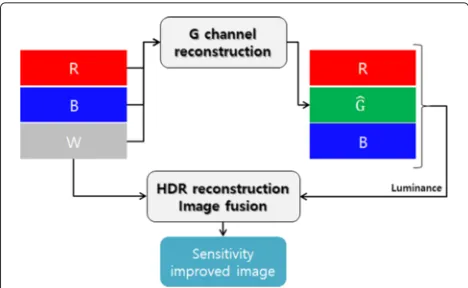
In order to overcome the problem of degradation in RGBW CFA, a pattern of RWB CFA that does not absorb G is proposed [8, 9]. The spatial resolution of this RWB CFA is similar to that of the Bayer CFA because the pat-tern of this RWB CFA is identical to the patpat-tern of the Bayer CFA. Although spatial resolution is improved when RWB CFA uses W rather than G, however, it is impossible to guarantee color fidelity. The reason is that correct color information cannot be produced due to the lack of G. To maximize the advantage of this CFA without color degra-dation, two techniques are required. First, accurate G should be reconstructed based on the correlation among W, R, and B. Second, the image should be fused, for which a high dynamic range (HDR) reconstruction technique that combines highly sensitive W information with RGB information is needed, as shown in Fig. 1. If the above techniques are applied to images obtained through the RWB CFA (ideal HDR and G value reconstruction algo-rithms are applied), images without color degradation can be obtained while the spatial resolution is improved as
Fig. 1Image processing module of the RWB CFA
compared with images obtained through the RGBW CFA. The sensitivity is also significantly improved in compari-son to images obtained from the existing Bayer CFA, as shown in Fig. 2.
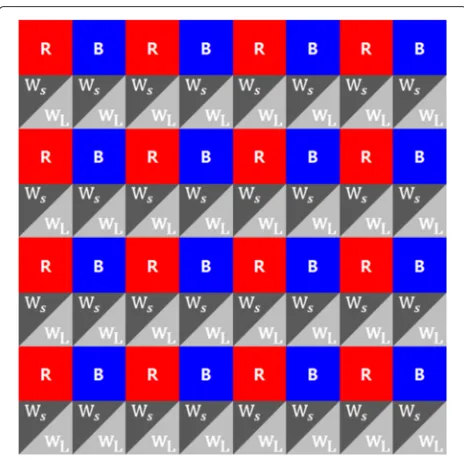
However, there is a problem in obtaining W. W chan-nel saturates at a lower light level than the R, G, and B channels. That is, W is saturated faster than R, G, and B since W absorbs more light compared to R,G, and B. In the RGBW CFA, the saturation problem can be handled by using the HDR reconstruction scheme that combines W with luminance of RGB. On the contrary, the rapid sat-uration of W is a important problem in the RWB CFA. As shown in Fig. 3, rapid saturation of W occurs when obtaining W with R and B as is the case with the existing Bayer CFA. If W is saturated, G cannot be estimated accu-rately. In order to prevent the saturation of W, the image is captured with a shorter exposure time. Unfortunately, this leads to another problem, i.e., reduced signal-to-noise ratio (SNR) for R and B. To solve this issue, a new pattern of the RWB CFA that obtains two W values at differ-ent exposure times has been proposed [10]. The pattern of this CFA is designed as shown in Fig. 4. In spite of
the degradation of spatial resolution along the horizontal direction, R and B are placed in odd rows and W is placed in even rows to consider a readout method of complemen-tary metal oxide semi-conductor (CMOS) image sensor and apply a dual sampling approach to the even rows. The dual sampling approach is the method of improving the sensitivity by adding a second column signal process-ing chain circuit and a capacitor bank to a conventional architecture of CMOS image sensor without modifying the data readout method [11]. In the CMOS image sensor, the sensor data is acquired by reading each row. Consider-ing the row-readout process and usConsider-ing the dual samplConsider-ing approach, it is possible to resolve the saturation problem of W and improve the sensitivity by using two W values at the same time. As well as the high SNR for R and B can be obtained. However, conventional color interpolation (CI) algorithms cannot be applied since the pattern of this RWB CFA is different from that of the widely used Bayer CFA. Consequently, the spatial resolution is degraded par-ticularly in the horizontal direction as compared to the conventional RWB CFA pattern. In this paper, we pro-pose a CI algorithm that improves the spatial resolution of images for this RWB CFA pattern. In the proposed algo-rithm, two sampled W channels captured with different exposure times are reconstructed as high resolution W channels using directional color difference information, and the sampled R and B are interpolated using a guided filter.
The rest of the paper is organized as follows. Section 2 provides the analysis of various CFA patterns. Section 3 describes the proposed algorithm in detail. Section 4 presents the experimental results, and Section 5 concludes the paper.
2 Analysis of CFA patterns
In 1976, Bayer proposed a CFA pattern to capture an image by using one sensor [1]. The Bayer pattern consists of 2×2 unit blocks that include two sampled G channels
Fig. 3Two problems when using W channel rather than G channel
diagonally, one sampled R channel, and one sampled B channel, as shown in Fig. 5a. The reason for this is as fol-lows. Human eye is most sensitive to G and the luminance signal of the incident image is represented by G. In order to reconstruct full color channels from the sampled chan-nels, many color interpolation (demosaicking) methods have been studied [12–18].
In order to overcome the limited sensitivity of the Bayer CFA pattern, new CFA patterns using W have been pro-posed in a number of patents and publications [2–6].
Fig. 4RWB CFA pattern acquiring W at two exposure times [10]
Yamagami et al. were granted a patent for a new CFA pattern comprising RGB and W, as shown in Fig. 5b [2]. They acknowledged the abovementioned rapid saturation problem of W, and dealt with the problem by using CMY filters rather than RGB filters or a neutral den-sity filter on the W. The drawback of this CFA is spatial resolution degradation caused by small proportions of R and B channels which occupy one-eighth of the sensor, respectively [19].
Gindele et al. granted a patent for a new CFA pattern using W with RGB in 2×2 unit blocks, as shown in Fig. 5c [3]. Sampling resolution of all the channels in this pat-tern are equal as a quarter of the sensor. It is possible to improve the spatial resolution as compared to the CFA of Yamagami et al. due to the increment of the sampling res-olution for R and B. At the same time, improvement of the spatial resolution is limited because of the lack of a high-density channel. In comparison with other CFAs, G in the Bayer CFA and W in the CFA proposed by Yamagami et al. are high-density channels that occupy half of the sensor.
Fig. 5Various CFA patterns proposed byaBayer [1],bYamagami et al. [2],cGindele et al. [3],dKomatsu et al. [8, 9], andePark et al. [10]
correction matrix. The drawback of this CFA pattern is that it cannot cope with the above mentioned rapid satu-ration problem of W. If satusatu-ration occurs at W, the accu-racy of the estimated G decreases considerably because the estimation process is conducted two times. Since the real W value cannot be obtained, first, the real value of the saturated W which is larger than the maximum value is estimated. Then, the color correction matrix is used to estimate G. The results by ‘two times’ estimation have a larger error than the results by “one time” estimation because the relationship among R, G, B, and W are not accurately modeled.
Park et al. proposed an RWB CFA pattern using R, B, and double-exposed W instead of a single exposed W to solve the rapid saturation problem [10]. Two W values are obtained at different exposure times, and then fused to prevent saturation. This approach is similar to the HDR reconstruction algorithm. The pattern of this RWB CFA pattern is shown in Fig. 5e. R and B are placed sequen-tially one after the other in odd rows, and W is placed in even rows to consider the data readout method of the CMOS image sensor and apply the the dual sampling approach to W. Using the dual sampling approach, two values with different exposure times can be obtained with-out modifying the readwith-out method in which the sensor data is acquired by scanning each row [11]. Applying the dual sampling approach to the even rows, double-exposed W are obtained to cope with the rapid saturation prob-lem and improve the sensitivity. The obtained R and B show the high SNR since they are captured with opti-mal exposure time. The disadvantage of this CFA is the degradation of the spatial resolution along the horizon-tal direction than other CFAs. Since there are no W in
the odd rows, W located in vertical or diagonal directions except the horizontal direction are unavoidably referred for interpolating the missing W.
In this paper, we adopt the double exposed RWB CFA pattern proposed in [10]. Although this CFA pattern is disadvantageous with respect to the spatial resolution along the horizontal direction, we focus on the improve-ment of sensitivity and color fidelity by resolving the rapid saturation problem. In order to overcome the drawback of this CFA pattern, we propose a color interpolation method that reconstructs the four high resolution chan-nels (long exposed W, short exposed W, R, and B) from the sampled low resolution channels. As a result, the images are improved in terms of spatial resolution, sensitivity, and color fidelity simultaneously compared with the results of other CFAs.
3 Proposed color interpolation algorithm
In this section, we describe the proposed method in detail. First, the missing W values are interpolated by calculat-ing the color difference values for each direction, and then the estimated W values are updated to improve the spatial resolution by using subdivided directional color difference values. Second, the R and B values are estimated by using a guided filter that uses the interpolated W channel as a guided image. Then, the estimated R and B values are modified to obtain accurately estimated values by using an edge directional residual compensation method.
3.1 Two W channels interpolation
according to the edge direction in order to interpolate the missing pixels. The existing method considers both verti-cal and horizontal directions. In the proposed method, the color difference for the vertical and diagonal directions are calculated as
D1,D2denote the vertical and diagonal color difference
values between the white and red channels, respectively. The direction ofD1is from the upper right to the lower
left and the direction ofD2is from the upper left to the
lower right.W andRrepresent the temporary estimated values of each channel according to the direction. They are calculated as
RD2. The reason for considering these directions rather
than the horizontal direction is that it is impossible to cal-culate the color difference in the horizontal direction with this CFA pattern, whereas the calculation is possible in the diagonal direction.
In order to apply the dual sampling approach without modifying the readout method of CMOS image sensor, R and B are placed sequentially in odd rows and W is placed in even rows. However, this CFA pattern results in a zipper artifact at the horizontal edge owing to the energy difference between R and B. To remove this, the color difference value is modified by considering both R and B,
whereBV represents the temporary estimated value of
B channel. After calculating the color difference values for each direction i.e.,V,D1,D2, andH, the initial
interpolated result is obtained by combining color differ-ence values according to the edge direction. In horizontal edge regions,Rhor which considers the energy difference between R and B is used instead ofRto prevent the zipper artifact, values for each direction. When calculating the horizontal direction ofWini, Rhor +H should be used instead of
R+ H because H is calculated using Rhor and Bhor.
Since the scaling of each direction is matched, there are no artifacts in the interpolated image. d4 represents the directional averaging values of the directional color difference values,
The directional weight values wd4 in Eq. (5) for each direction are calculated as
wV =
whereIrepresents the input patterned image.
In order to further improve the resolution, the ini-tial result is updated similar to [16]. After further subdividing the edge direction, the color difference values are calculated in eight directions i.e., d8 =
{N,NE,E,SE,S,SW,W,NW}. The obtained values are again combined according to the edge direction to obtain the final interpolated result,
4 represents the updated W values for eachd4 direction. They are calculated by arbitrating the direc-tional color difference value (d4) with updated direc-tional color difference value (upd
4) as
wherewupis the weight value which determines the ratio
of the directional color difference value to the updated
directional color difference value. This weight value is set to 0.7 in our experiments. The updated directional color difference values are calculated considering the subdi-vided directions (d8) as
The double-exposed RWB CFA used in this paper obtains twoW values that have different exposure times. Although the proposed interpolation algorithm can be applied to short exposedW, it cannot be applied to long exposedW. This is because the color difference value can-not be calculated due to the saturation. In the proposed method, the edge directional weighted summation of the temporary estimated W is set as the final interpolated value for long exposed W. The temporary estimatedW for the vertical direction and both diagonal directions are obtained by using Eq. (2). In horizontal edge regions, spa-tial resolution is more improved when using WV than
usingWD1or WD2becauseW values are not located in
the temporaryW values for the horizontal edge (WH) by
The weighted values used in the edge directional weighted summation are identical to the weighted values used for short exposed W because they are determined for the same area,
With the above mentioned interpolation method, the missingWvalues located at the sampled R pixels are cal-culated. The remaining missingW values located at the sampled B pixels are estimated in a similar manner.
3.2 R and B channels interpolation
The proposed method interpolates the sampled R and B channels into high resolution channels through a guided filter that uses the interpolated W channel as a guided value. The guided filter conducts the image filtering considering the guided value. If the image filtering is conducted using the guided filter approach, the filtered image has the characteristics of the guided image. There-fore, the guided filter approach demonstrates high per-formance particularly in edge-aware smoothing. Further, this approach is utilized in many image processing areas including detail enhancement, HDR compression, image matting/feathering, dehazing, and joint upsampling, [21]. In the proposed algorithm, the property of the guided filter, which conducts filtering by reflecting the character-istics of the guided value, is used. Since the interpolated W channel is a high resolution image, the sampled R and B channels can be efficiently interpolated by reflect-ing the characteristic of the W channel in terms of high resolution,
mask are the mean and standard
devi-ation values of the estimated W or sampled R channels. Nmaskis the number of pixels in then×mmask. The size of the mask is set as 7×7 in our experiment, and the reg-ularization parameterεis set as 0.001. The real value of R is required for estimating the coefficients used in the guided filter. The input patterned image contains the sam-pled real value of R, allowing for an accurate estimation of the coefficient values. There is a difference between the initial estimated R values that are obtained by substituting the estimated coefficients into Eq. (15) and the real values of R at the location of sampled pixels,
λi,j=Ri,j−Ri,j, (17) whereR is the initial estimated value ofR. λ represent the residual values which are calculated by the difference between the realRvalues and the initial interpolated R values. Such residuals occur also at the location of miss-ing pixel. Thus, the initial interpolatedRvalues should be compensated considering these residuals to improve the accuracy of the estimatedRvalues [18]. In the proposed method, the final interpolated result ofR(R) is obtained by using an edge directional residual compensation method as
Ri,j=Ri,j+λi,j, (18)
whereλ represents the edge directional residual values by considering the residual values at the surrounding sampled pixels. Because the pixels with real values neigh-boring a missing pixel are exclusively located in a diagonal direction, the diagonal residual value is first calculated as
λi,j=wNEλi−1,j+1+wSEλi+1,j+1
where the weight values for each direction are calculated by using Eq. (12). The remaining missing pixels are inter-polated by combining the vertical and horizontal residual values,
The B channel is interpolated similarly by using the guided filter with the reconstructedWvalue as the guid-ance value.
4 Experimental results
experimental equipment for obtaining R, G, B, W, and double-exposed W in high resolution images, and then sampled these using each CFA pattern to obtain patterned images. All images were captured in our test room where the outside light could be blocked. Since other commercial products did not support this pattern, we built an imag-ing system usimag-ing a simag-ingle monochrome sensor and rotatimag-ing filter wheel system including red, green, blue, and white (luminance) filters. Using this rotating filter wheel, cap-turing the high resolution image of each channel was pos-sible. In our experiments, two W channels (WLandWs)
were captured with different exposure times when using the W filter. The exposure time of each channel was deter-mined as follows. First, the proper exposure time of R and B channels(tRB)was set to prevent the saturation of those
channels. Then, the exposure times of the long exposed WtWL
and short exposed WtWs
were set as 56tRBand
1
6tRB, respectively. The ratio of exposure time between
WL and Ws was experimentally determined considering
the sensitivity difference of each channel. Note that, the saturated region never occurs in the short exposed W (Ws). In the long exposed W (WL), the generation of
the saturated regions is not a concern. The brightness of the dark regions is important. The brighter the dark region, the higher SNR for the final resulting image. If object moving or handshaking occurs, long exposed W and short exposed W could capture different images. The problem of the moving object in the double exposed W mentioned previously was also problem in the R and B channels. In the images of the R and B channels, the object was captured with motion blur. The research regarding color interpolation including moving objects is beyond the scope of this paper. In our experiment, we assumed that the object did not move when capturing the images withtRB.
In order to reconstruct the full color images, CI algo-rithms suitable for each CFA pattern were applied. In our experiments, multiscale gradients (MSG) based CI algo-rithm [16] was used for the patterns shown in Fig. 5a, d. For patterns shown in Fig. 5b, c, e, edge directional inter-polation was utilized to generate the intermediate images with quincuncial patterns [22], and then a full color image was obtained by applying the MSG based CI algorithm. Then, G was estimated by using a color correction matrix in case of the RWB CFA, and the HDR reconstruction algorithm was applied if the image contained W.
In our experiments, the color correction matrix was used to estimate G from R, B, and W [9]. The matrix form of the method to estimate G is presented as
X=TY, (21)
where X = {R,G,B}T and Y = {R,W,B}T. is the color correction matrix whose components are deter-mined by considering the correlation among R, G, B, and
W. These components were changed in accordance with the color temperature and brightness. In our experiments, we experimentally determined the values of these compo-nents considering the correlation among R, G, B, and W for each experimental condition (brightness and kind of illumination). By using these values, the same color can be obtained regardless of the experimental conditions.
Exposure fusion method was used for the HDR recon-struction [23]. The weight values that determine the best parts in each image were calculated by multiplication of a set of quality measures. The final HDR image (Lhdr) was
obtained by fusing the best parts of each image. The three images (interpolated short exposed W channel, interpo-lated long exposed W channel, and luminance image from RGB values) were used to improve the sensitivity.
Lhdr=whdrs
i,j Wupi,j+whdrL i,j WLi,j
+whdrlumii,jLi,j, (22)
where whdrs , whdrL , and whdrlumi represent the normalized HDR weight values for interpolated short exposed W (Wup), interpolated long exposed W (WL), and luminance
(L) value from RGB values, respectively. These values are calculated as
whdrs i,j=
s
whdrs i,j −1
whdrs i,j, (23)
wheres= Wup,WL,L . The HDR weight values for each
imagewhdr
s are calculated as
whdrs i,j=Csα×Sβs ×Esγ, (24)
whereCs,Ss, andEsrepresent the values of quality mea-sures for contrast, saturation, and well-exposure, respec-tively.α,β, andγ are the weight values of each measure. The detailed description for these quality measures are presented in [23].
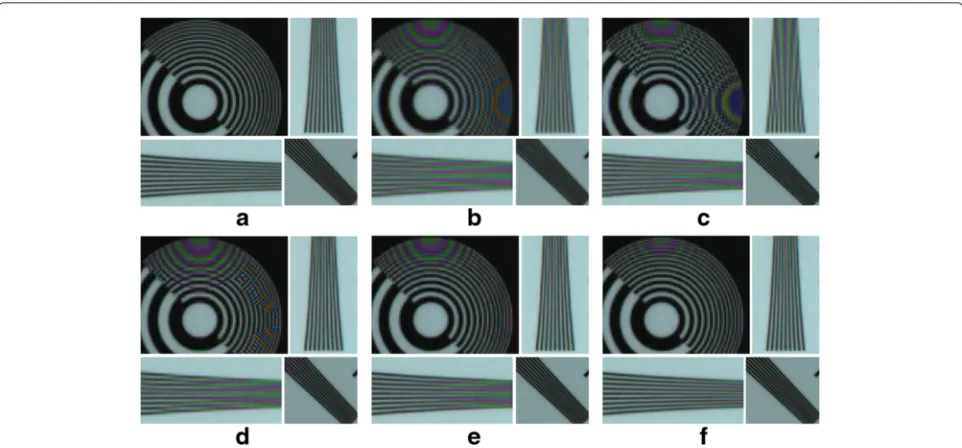
Figure 6 shows the comparison results for a test image captured using each CFA pattern. The test image simul-taneously includes a bright region (left side) and a dark region (right side). The processed results show that the sensitivity is improved whenW is obtained. In Fig. 6b–f, the color checker board located on the right side was clearly visible. The average brightness of Fig. 6e was lower than that of the other results because of the shorter expo-sure time to prevent the saturation ofW. IfWis saturated, incorrect color information is produced due to the inac-curate estimation ofG, as shown in Fig. 6d.
Fig. 6Comparison of CI and HDR reconstruction results and the enlarged parts obtained by usingaBayer CFA,bRGBW CFA [2],cRGBW CFA [3], dRWB CFA with saturatedW[8, 9],eRWB CFA with unsaturated W [8, 9], andfdouble-exposed RWB CFA [10]
lower spatial resolution due to the weakness of the CFA patterns. Figure 6f shows better spatial resolution than Fig. 6b, c. Although the double exposed CFA pattern may suffer from low resolution along horizontal direction due to the weakness of CFA pattern, the spatial resolution of this CFA pattern is not the worst. If an effective CI algorithm is applied, it is possible to improve the spatial resolution.
In Table 1, the performance of each CFA pattern is compared by using objective metrics for the test images captured by our experimental equipment. The color peak signal-to-noise ratio (CPSNR), brightness of each region (bright and dark regions), and angular error are used to measure the spatial resolution, sensitivity, and color fidelity, respectively. Comparing the CPSNR metric, the double-exposed RWB CFA pattern recorded a larger value than the RGBW CFA patterns. It should be improved fur-ther, since the Bayer CFA pattern provides a larger CPSNR value. In terms of the brightness values of bright and dark
Table 1Performance comparison of various CFA patterns
Spatial resolution Sensitivity Color fidelity
(CPSNR) (Brightness) (Angular error)
Bayer CFA [1] 35.27 62.22, 5.20 1.03
RGBW CFA [2] 19.93 94.65, 28.29 1.68
RGBW CFA [3] 20.65 94.67, 28.47 1.54
RWB CFA with 17.50 80.92, 28.55 8.73 saturated W [8, 9]
RWB CFA with 27.60 45.38, 8.34 2.55 unsaturated W [8, 9]
RWB CFA with 23.49 91.67, 27.87 2.42 double exposed W [10]
regions, the CFA patterns with W recorded larger val-ues compared with those of the Bayer CFA pattern. For the RWB CFA pattern with unsaturated W, however, the brightness value is smaller than that of other CFA pat-terns including W because of the shorter exposure time to avoid the saturation of W. By comparing the angular error values, it is shown that satisfactory color fidelity is obtained when using the double-exposed RWB CFA although the Bayer CFA pattern and RGBW CFA patterns provide smaller angular error than the double exposed RWB CFA pattern. If an accurate G estimation method is developed, the double exposed RWB CFA pattern will provide improved color fidelity compared with the results estimated by using a color correction matrix.
From above analysis, we adopted the double-exposed CFA pattern and proposed the CI algorithm to improve the spatial resolution. Despite spatial resolution degrada-tion, the color fidelity was satisfactory and the sensitivity was greatly improved in comparison with the Bayer CFA pattern. If the spatial resolution is improved, it is possi-ble to capture high-resolution and noise-free images in low light conditions because the sensitivity is significantly improved without color degradation.
Fig. 7Comparison of the various CI algorithms for color images including short exposed W:aoriginal image,bCM1,cCM2,dCM3,eCM4, andfPM
intermediate quincuncial patterns (CM2) [16, 22]; an intra field deinterlacing algorithm (CM3) [24], which uses the characteristic of this CFA pattern with sampled W only in the even row; and a method (CM4) that modifies the algo-rithm for the existing Bayer CFA such that it is compatible with the double exposed RWB CFA pattern [17].
Figure 7 shows the result images which compare the original image with the reconstructed images by using the PM and CMs. Figure 7a shows the enlarged parts of the original image. Figure 7b shows the results when using CM1. It is clear that CM1 does not consider the edge direction at all. The ability of CM1 to improve the spatial resolution was very poor. In Fig. 7c, improvement of the spatial resolution is shown as compared with CM1 since
the edge directional interpolation for obtaining quincun-cial patterns is used. Figure 7d shows the results when using CM3, where there is an obvious improvement to the spatial resolution compared with CM1, but is similar to CM2. This is because CM3 interpolated the W chan-nel by estimating the edge direction. When estimating the edge direction, however, CM3 relied exclusively on pixel information corresponding to an even row. Consequently, the edge direction was falsely estimated in some areas, leading to incorrect interpolation results. With CM4, an interpolation kernel was applied for missing pixels consid-ering the edge direction, the results for which are shown in Fig. 7e. Since the interpolation kernel was applied con-sidering R and B, as well as W, the image was interpolated
while preserving the edge better than other methods. The biggest disadvantage of this method is poor resolution and zipper artifacts in the horizontal edge regions. Figure 7f presents the result of the PM. It is confirmed that the spa-tial resolution was further improved than when using the CMs. In particular, the spatial resolution is significantly improved near the horizontal edge.
The interpolation results for the long exposed W are shown in Fig. 8. Similar to Fig. 7, the result of the PM also shows higher resolution than when using the CMs. In par-ticular, the spatial resolution of the diagonal direction was greatly improved and zipper artifacts located at regions near the horizontal edge were removed as compared with the results of the CMs. The reason is that the CMs inter-polate the missing pixels without considering the pixels in the diagonal directions and the energy difference between R and B.
The performance of the PM and CMs was evaluated on a Kodak test set and the five test images captured in our
Table 2Comparison of objective evaluation: CPSNR
Image No. CM1 CM2 CM3 CM4 PM
Captured img 1 33.714 35.178 36.533 38.175 40.375
2 32.685 34.580 35.064 37.491 40.175
3 35.769 37.226 37.502 39.528 41.016
4 29.218 31.417 32.153 37.481 37.414
5 33.483 34.825 35.265 37.959 40.684
Kodak test img 1 29.936 31.758 32.808 35.700 38.715
2 36.032 36.771 38.724 40.522 41.661
3 36.642 37.908 38.047 40.004 40.191
4 36.779 37.630 39.276 40.312 42.234
5 30.500 33.030 33.986 35.877 38.737
6 31.111 33.064 33.448 35.060 38.433
7 36.151 37.751 39.922 40.267 42.658
8 27.638 29.162 31.956 34.783 36.001
9 35.915 37.036 37.353 39.148 41.917
10 35.887 37.129 39.419 40.565 42.869
11 32.835 34.784 35.867 36.112 39.333
12 35.843 36.909 38.766 41.579 43.724
13 27.956 30.616 29.897 32.328 35.165
14 32.743 34.529 35.092 36.485 39.065
15 34.754 35.374 37.196 39.085 41.519
16 34.109 35.893 35.877 38.302 40.759
17 35.312 37.017 38.819 40.377 43.665
18 32.058 34.472 34.606 37.232 40.675
19 31.790 32.910 34.650 37.244 40.070
20 34.083 36.609 36.251 39.276 42.327
Avg. 33.318 34.943 35.939 38.032 40.335
Boldface indicates the best results in each metric among PM and CMs
laboratory. Because Kodak test images lack W channels, both exposures of W (Wsgen and WLgen) were generated
artificially for the test,
Wsgen
i,j= R
i,j+Gi,j+Bi,j
3 ×0.5,
WLgen i,j= R
i,j+Gi,j+Bi,j
3 ×1.5. (25)
The difference between the original and interpolated images was determined by using two metrics: color peak signal-to-noise ratio (CPSNR) and S-CIELAB color differ-ence (E) formula [12, 25]. Generally, when calculating the CPSNR, three channels (R, G, and B) are used. In our experiments, this three-channel equation is modified to a four-channel equation since our results have four chan-nels (R, B, long exposed W, and short exposed W). The S-CIELAB E was calculated by averaging theE val-ues of two color images using long exposed W and short
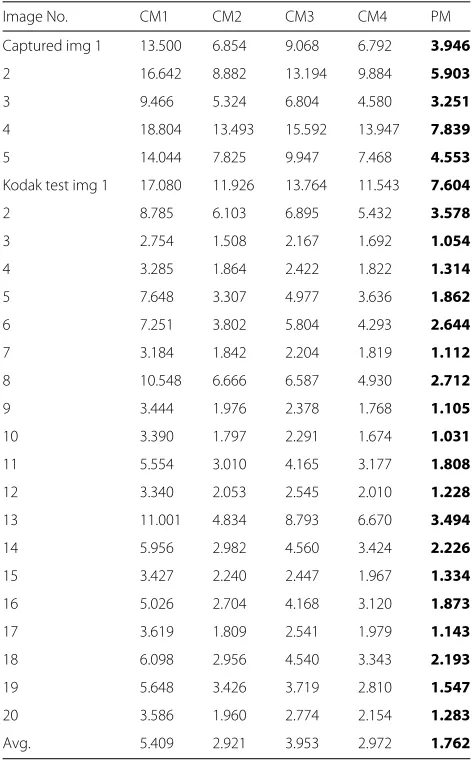
Table 3Comparison of objective evaluation: S-CIELABE
Image No. CM1 CM2 CM3 CM4 PM
Captured img 1 13.500 6.854 9.068 6.792 3.946
2 16.642 8.882 13.194 9.884 5.903
3 9.466 5.324 6.804 4.580 3.251
4 18.804 13.493 15.592 13.947 7.839
5 14.044 7.825 9.947 7.468 4.553
Kodak test img 1 17.080 11.926 13.764 11.543 7.604
2 8.785 6.103 6.895 5.432 3.578
3 2.754 1.508 2.167 1.692 1.054
4 3.285 1.864 2.422 1.822 1.314
5 7.648 3.307 4.977 3.636 1.862
6 7.251 3.802 5.804 4.293 2.644
7 3.184 1.842 2.204 1.819 1.112
8 10.548 6.666 6.587 4.930 2.712
9 3.444 1.976 2.378 1.768 1.105
10 3.390 1.797 2.291 1.674 1.031
11 5.554 3.010 4.165 3.177 1.808
12 3.340 2.053 2.545 2.010 1.228
13 11.001 4.834 8.793 6.670 3.494
14 5.956 2.982 4.560 3.424 2.226
15 3.427 2.240 2.447 1.967 1.334
16 5.026 2.704 4.168 3.120 1.873
17 3.619 1.809 2.541 1.979 1.143
18 6.098 2.956 4.540 3.343 2.193
19 5.648 3.426 3.719 2.810 1.547
20 3.586 1.960 2.774 2.154 1.283
Avg. 5.409 2.921 3.953 2.972 1.762
exposed W rather than G. Table 2 shows the CPSNR com-parison. The PM outperformed the other methods for 24 of the 25 test images. Likewise, the S-CIELABEresults demonstrate that the PM had the best performance for all test images. The S-CIELABEvalues of each result are compared in Table 3.
5 Conclusions
In this paper, we proposed a color interpolation algorithm for the RWB CFA pattern that acquires W at different exposure times. The proposed algorithm interpolates two W channels by using directional color difference infor-mation, and then reconstructs R and B channels with a guided filter. The proposed method outperformed con-ventional methods, which was confirmed with objective metrics and a comparison using actual images. In future research, we intend to study G channel estimations and image fusion based on HDR reconstruction algorithms, and apply these methods to high resolution R,W, and B channels generated by using the proposed algorithm. Through these methods, an image with highly improved sensitivity compared to the existing Bayer patterned image can be obtained.
Competing interests
The authors declare that they have no competing interests.
Acknowledgements
This research was supported by the Basic Science Research Program through the National Research Foundation of Korea(NRF) funded by the Ministry of Science, ICT and future Planning(No. 2015R1A2A1A14000912).
Received: 12 January 2016 Accepted: 2 May 2016
References
1. BE Bayer, Color imaging array. Jul. 20. U.S. Patent 3,971,065 (1976) 2. T Yamagami, T Sasaki, A Suga, Image signal processing apparatus having
a color filter with offset luminance filter elements. Jun. 21. U.S. Patent 5,323,233 (1994)
3. EB Gindele, AC Gallagher, Sparsely sampled image sensing device with color and luminance photosites. Nov. 5. U.S. Patent 6,476,865 (2002) 4. M Kumar, EO Morales, JE Adams, W Hao, inImage Processing (ICIP), 2009
16th IEEE International Conference On. New , digital camera sensor architecture for low light imaging (IEEE, Cairo, Egypt, 2009), pp. 2681–2684 5. J Wang, C Zhang, P Hao, inImage Processing (ICIP), 2011 18th IEEE
International Conference On. New color filter arrays of high light sensitivity and high demosaicking performance (IEEE, Brussels, Belgium, 2011), pp. 3153–3156
6. JT Compton, JF Hamilton, Image sensor with improved light sensitivity. Mar. 20. U.S. Patent 8,139,130 (2012)
7. ON Semiconductor. TRUESENSE Sparse ColorFilter Pattern. Application Notes (AND9180/D), Sep. (2014). http://www.onsemi.com/pub_link/ Collateral/AND9180-D.PDF
8. T Komatsu, T Saito, inProc. SPIE, Sensors and Camera Systems for Scientific, Industrial, and Digital Photography Applications IV. Color image acquisition method using color filter arrays occupying overlapped color spaces, vol. 5017 (SPIE, Santa Clara, CA, USA, 2003), pp. 274–285
9. M Mlinar, B Keelan, Imaging systems with clear filter pixels. Sep. 19. U.S. Patent App. 13/736,768 (2013)
10. J Park, K Choe, J Cheon, G Han, A pseudo multiple capture cmos image sensor with rwb color filter array. J. Semicond. Technol. Sci.6, 270–274 (2006)
11. O Yadid-Pecht, ER Fossum, Wide intrascene dynamic range cmos aps using dual sampling. Electron Devices IEEE Trans.44(10), 1721–1723 (1997)
12. W Lu, Y-P Tan, Color filter array demosaicking: new method and performance measures. Image Process. IEEE Trans.12(10), 1194–1210 (2003)
13. BK Gunturk, J Glotzbach, Y Altunbasak, RW Schafer, RM Mersereau, Demosaicking: color filter array interpolation. Signal Process. Mag. IEEE. 22(1), 44–54 (2005)
14. X Li, B Gunturk, L Zhang, inProc. SPIE, Visual Communications and Image Processing 2008. Image demosaicing: a systematic survey, vol. 6822 (SPIE, San Jose, CA, USA, 2008), pp. 68221–6822115
15. D Menon, G Calvagno, Color image demosaicking: An overview. Image Commun.26(8-9), 518–533 (2011)
16. I Pekkucuksen, Y Altunbasak, Multiscale gradients-based color filter array interpolation. Image Process. IEEE Trans.22(1), 157–165 (2013) 17. S-L Chen, E-D Ma, Vlsi implementation of an adaptive edge-enhanced
color interpolation processor for real-time video applications. Circ. Syst. Video Technol. IEEE Trans.24(11), 1982–1991 (2014)
18. L Wang, G Jeon, Bayer pattern cfa demosaicking based on
multi-directional weighted interpolation and guided filter. Signal Process. Lett. IEEE.22(11), 2083–2087 (2015)
19. Y Li, P Hao, Z Lin, Color Filter Arrays: A Design Methodology. Research report (RR-08-03), Dept of Computer Science, Queen Mary, University of London (2008). https://core.ac.uk/download/files/145/21174373.pdf 20. Image Sensors World. Samsung Announces 8MP RWB ISOCELL Sensor
(2015). http://image-sensors-world.blogspot.kr/2015/03/samsung-announces-8mp-rwb-isocell-sensor.html
21. K He, J Sun, X Tang, Guided image filtering. Pattern Anal. Mach. Intell. IEEE Trans.35(6), 1397–1409 (2013)
22. SW Park, MG Kang, Channel correlated refinement for color interpolation with quincuncial patterns containing the white channel. Digital Signal Process.23(5), 1363–1389 (2013)
23. T Mertens, J Kautz, F Van Reeth, inComputer Graphics and Applications, 2007. PG ’07. 15th Pacific Conference On. Exposure fusion (IEEE, Maui, Hawaii, USA, 2007), pp. 382–390
24. MK Park, MG Kang, K Nam, SG Oh, New edge dependent deinterlacing algorithm based on horizontal edge pattern. Consum. Electron. IEEE Trans.49(4), 1508–1512 (2003)
25. RWG Hunt, MR Pointer,Measuring Colour (4th Edition). (John Wiley Sons, Ltd, Chichester, UK, 2011)
Submit your manuscript to a
journal and benefi t from:
7Convenient online submission 7Rigorous peer review
7Immediate publication on acceptance 7Open access: articles freely available online 7High visibility within the fi eld
7Retaining the copyright to your article
![Fig. 5 Various CFA patterns proposed by a Bayer [1], b Yamagami et al. [2], c Gindele et al](https://thumb-us.123doks.com/thumbv2/123dok_us/885785.1106456/4.595.59.539.87.298/fig-various-cfa-patterns-proposed-bayer-yamagami-gindele.webp)
![Fig. 6 Comparison of CI and HDR reconstruction results and the enlarged parts obtained by using a Bayer CFA, b RGBW CFA [2], c RGBW CFA [3],d RWB CFA with saturated W [8, 9], e RWB CFA with unsaturated W [8, 9], and f double-exposed RWB CFA [10]](https://thumb-us.123doks.com/thumbv2/123dok_us/885785.1106456/9.595.59.540.85.271/comparison-reconstruction-results-enlarged-obtained-saturated-unsaturated-exposed.webp)