Spatial distribution of atypical aftershocks of the 1995 Hyogo-ken Nanbu
earthquake
Hiroshi Yamanaka1, Yoshihiro Hiramatsu1, and Hiroshi Katao2
1Department of Earth Sciences, Faculty of Science, Kanazawa University, Ishikawa 920-1192, Japan
2Research Center for Earthquake Prediction, Disaster Prevention Research Institute, Kyoto University, Kyoto 611-0011, Japan
(Received December 21, 2000; Revised September 24, 2002; Accepted September 26, 2002)
The 1995 Hyogo-ken Nanbu earthquake (MJMA7.3) occurred on January 17, 1995. To reveal the detailed stress
field after the mainshock, we relocate hypocenters of aftershocks (M≥2.3) and determine their focal mechanisms using seismic records obtained by GROUPS-95, a temporary dense seismic network in and around the aftershock region. Along the mainshock rupture zone, some aftershocks are nearly N-S compression or normal fault type events, which is inconsistent with the regional stress field of approximately horizontal E-W compression. We call these aftershocks atypical, defined as events which have focal mechanisms with P-axis directions more than 45◦ from the regional stress field. The atypical aftershocks amount to about 17% of the total. No temporal variations in aftershock mechanism are found in the analysis period. Their spatial distribution is compared with the slip and stress distribution of the mainshock, as well as the P- and S-wave velocity structure. Most of them are located at the upper boundary between the slipped and unslipped zones of the mainshock. We suggest that the atypical aftershocks are caused by the disturbance of the local tectonic stress field due to the heterogeneous coseismic slip.
1.
Introduction
The 1995 Hyogo-ken Nanbu earthquake occurred on Jan-uary 17, 1995 with a magnitude of 7.3 determined by the Japan Meteorological Agency. The hypocenter of the main-shock was located beneath the Akashi Strait in the Kinki Dis-trict, Japan (Fig. 1). There was severe damage in a wide area, including Kobe city, and more than 6,000 people were killed. Many aftershocks occurred on the Rokko Fault System, located on the northeastern side of the Akashi Strait, and in the northeastern part of Awaji Island located on the south-western side of the Akashi Strait, as shown in Fig. 2. The aftershock region extends about 70 km from northeast to southwest (Hirataet al., 1996; Kataoet al., 1997). The sur-face rupture caused by the mainshock was observed along the Nojima Fault which is located on the northwestern coast of Awaji Island (Nakata et al., 1995; Awata et al., 1996). The observation of microearthquake activity for the past 30 years clearly shows that the seismicity along the main-shock rupture zone was low on the southern side of the Arima-Takatsuki Tectonic Line (ATTL) before the main-shock, while the seismicity has been high in the Tamba Plateau on the northern side of ATTL (Kataoet al., 1997; Hiramatsuet al., 2000).
The 1995 Hyogo-ken Nanbu earthquake presents many seismologically interesting aspects, including the feature of the aftershock distribution (Hirata et al., 1996; Nakamura and Ando, 1996; Katao et al., 1997), the discrepancy in the fault configuration beneath Akashi Strait (Nakamura and Ando, 1996; Takahashiet al., 1996), the regional stress field after the mainshock (Kataoet al., 1997), the slip distribution
Copy right cThe Society of Geomagnetism and Earth, Planetary and Space Sciences (SGEPSS); The Seismological Society of Japan; The Volcanological Society of Japan; The Geodetic Society of Japan; The Japanese Society for Planetary Sciences.
of the mainshock (Bouchon et al., 1998; Ide and Takeo, 1997), the stress distribution on the rupture fault before and after the mainshock (Bouchon et al., 1998), the P- and S-wave velocity structure (Zhao and Negishi, 1998), and the S-wave splitting in the aftershock region (Tadokoro et al., 1999).
Comparisons of aftershock distribution with coseismic slip distribution have been done for numerous earthquakes. Mendoza and Hartzell (1988) showed that aftershocks fol-lowing a large earthquake occur mostly outside of or near the edges of the area of the maximum slip (e.g. 1986 North Palm Springs earthquake, 1983 Borah Peak earthquake). They suggested that slips are continued the outer region of the mainshock rupture area or subsidiary faults are activated.
To investigate the stress field after the Hyogo-ken Nanbu earthquake in and around the mainshock rupture zone, Katao et al. (1997) determined the focal mechanisms of aftershocks using permanent seismic networks, and compared them with those of the microearthquakes before the mainshock reported by Iio (1996). Kataoet al. (1997) reported that some after-shocks showed nearly horizontal N-S or vertical compres-sion axes. Their mechanisms were not consistent with the regional stress field of approximately horizontal E-W com-pression. Because the stations of the permanent seismic net-works were not distributed uniformly over the mainshock rupture, the accuracy of these mechanisms determined was limited.
The Geophysical Research Group Organized by the Uni-versities for Prediction Seismology in 1995 (GROUPS-95) installed 27 temporary seismic stations in and around the aftershock region a week after the mainshock (Hirata et al., 1996) (Fig. 3). Using the seismic records obtained by GROUPS-95, we relocate aftershock hypocenters (M≥2.3),
Fig. 1. Distribution of active faults. The Rokko Fault System consists of seven major active faults; (A) Rokko Fault, (B) Ashiya Fault, (C) Gosukebashi Fault, (D) Ohtsuki Fault, (E) Suwayama Fault, (F) Nunobiki Fault and (G) Suma Fault. Line X-Y shows the orientation of the cross section in Figs. 8–11. Star shows the epicenter of the mainshock.
Fig. 2. Distribution of the aftershocks of the 1995 Hyogo-ken Nanbu earthquake. Small dots show the original aftershock locations determined by the GROUPS-95, while solid circles show those (M≥2.3) relocated in this study.
and determine their focal mechanisms using P-wave initials. This dense seismic network enables us to determine the loca-tions and focal mechanisms of the aftershocks with a high ac-curacy. We can also infer the post-seismic stress distribution along the mainshock rupture from these focal mechanisms.
A primary objective of this paper is to describe the char-acteristics of the spatial distribution of the aftershocks and their focal mechanisms. We compare our results with
vari-Fig. 3. Distribution of the seismic stations used in this study. Solid circles are the temporary stations deployed by GROUPS-95 after the Hyogo-ken Nanbu earthquake. Gray symbols represent the permanent seismic net-works: triangles are the Abuyama, Tottori and Tokushima networks oper-ated by DPRI, Kyoto University, and squares are the Wakayama network operated by ERI, the University of Tokyo. Star shows the epicenter of the mainshock.
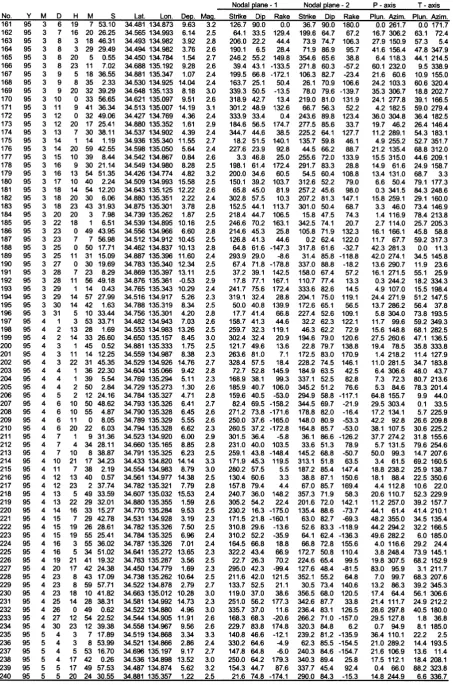
Table 1. (continued).
Table 2. Focal mechanism solutions of the aftershocks (M>2.3) in the 2nd observation period.
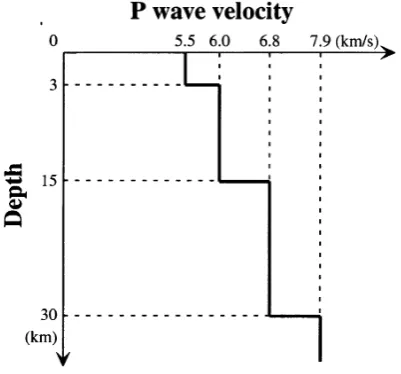
Fig. 4. P-wave velocity structure used for hypocenter determination.
2.
Data and Method
We relocate the aftershocks with magnitudes greater than 2.3 and determine their focal mechanisms using the data ob-tained by GROUPS-95. It is hard to determine focal mecha-nisms of smaller events due to the small number of recorded seismograms and unclear initial motions of P-waves.
large errors, in paticular, for those stations far away from the aftershock area, because a large amount of data was pro-cessed quickly in a short time. We therefore reexamined all the P-wave arrival times and polarities for the aftershocks (M
≥2.3) manually using the WIN system (Urabe and Tsukada, 1991). The hypocenters are determined from those re-picked arrival times by using the software HYPOMH (Hirata and Matsu’ura, 1987). The P-wave velocity structure used for the hypocenter determination is shown in Fig. 4. To improve the accuracy of the hypocenter determination, we did not use the data at the stations with epicentral distances greater than 50 km. Further, we discarded data with unclear and/or weak onsets of P-waves due to a low signal-to-noise ratio. From the P-wave polarities rechecked in this study, we determined the focal mechanisms for all the aftershocks with M≥2.3, using the scheme of Maeda (1992). Finally, we obtained the focal mechanisms of 244 and 34 events along the mainshock rupture zone for the first and second periods, respectively. The 95% confidence limits for the obtained P- and T-axis di-rections are typically±5◦for azimuth and±15◦for plunge.
3.
Result
Figures 5, 6 and 7 show the locations, focal mechanisms and directions of P-axes of the aftershocks analyzed in this study. Fault parameters of these aftershocks are listed in Table 1 (1st period) and Table 2 (2nd period). Following Kataoet al. (1997), we classify the focal mechanisms into four types: normal fault with a plunge of the P-axis>60◦; reverse fault with a plunge of the T-axis >60◦; strike-slip fault with a plunge of the Null-axis>45◦; and intermediate type otherwise.
On the basis of the rupture propagation of the mainshock (Ide and Takeo, 1997; Bouchonet al., 1998) and the after-shock activity (Kataoet al., 1997), we divide the aftershock zone into three regions: the Kobe region (from the Akashi Strait to the Arima-Takatsuki Tectonic Line), the Awaji re-gion in the northern part of Awaji Island, and the Akashi Strait region where the occurrence of aftershocks was less frequent than in the other two regions. We define a cluster of aftershocks based on the spatial concentration of their loca-tions and common P-axis orientaloca-tions.
3.1 Kobe region
In the Kobe region (Fig. 5), many aftershocks are observed along the Rokko Fault System (Fig. 1). There are three clus-ters of afclus-tershocks with strike-slip focal mechanisms near the northeastern end of the Rokko Fault, the Gosukebashi Fault and the Ashiya Fault (area a in Fig. 5). P-axis directions of these aftershocks are approximately horizontal in an ESE-WNW direction.
A cluster of reverse fault type aftershocks exists near the southern end of the Gosukebashi Fault and the Otsuki Fault (area b in Fig. 5). They also have P-axes in approximately horizontal E-W or ESE-WNW directions. The focal depths of these aftershocks are 2–7 km. In contrast, most of strike-slip type in the Kobe region are located deeper than 6–8 km. In the area from the Suwayama Fault and the Nunobiki Fault to the Suma Fault, aftershocks are mainly of strike-slip type. The majority of the P-axes of these events is in an E-W or ESE-E-WNE-W direction. However, those of reverse fault type, located in a cluster along the Suma Fault at depths of
about 12 km, have P-axes in a SE-NW direction, which is almost perpendicular to the strike of the mainshock rupture, as shown in area c of Fig. 5. Most of these events occurred in the second observation period.
3.2 Awaji region
The occurrence of aftershocks is high in the northern half of Awaji Island (Fig. 6). Although surface rupture was ob-served on the Nojima Fault in the northwestern part of Awaji Island (Nakata et al., 1995; Awata et al., 1996), most of the aftershocks did not occur directly beneath the Nojima Fault, but along the Higashiura Fault and the Kariya Fault, and around the southern end of the Nojima Fault.
We recognize an aggregation of aftershocks around the southern end of the Nojima Fault (area a in Fig. 6). The azimuths of P-axes of these events are approximately in an E-W or ESE-WNW direction, which are the same as those for most aftershocks in the Kobe region. However, the after-shocks in this area are distributed in a wide range of depths, locations, and are of various focal mechanism types. We con-sider that this aggregation of aftershocks can not be defined as cluster.
There are many aftershocks in the northeastern part of Awaji Island. These events are not in clusters like those in the Kobe region. Their directions of P-axes are also highly variable. Synthetic tests show that this is not caused by the uncertainty of focal mechanism determination. Many reverse fault type events occurred here, compared to those in the Kobe region. Mechanism types of aftershocks do not show any coherent patterns in a small area.
3.3 Akashi Strait
The aftershocks activity in the Akashi Strait (Fig. 7) is extremely low, as reported by Hirata et al. (1996) and Nakamura and Ando (1996). Four foreshocks occurred in this area, together with the mainshock. We find two small clusters in this area. One is located at a depth of about 15 km beneath the central part of the Akashi Strait (area a in Fig. 7). The aftershocks in this cluster are mainly of strike-slip type with P-axes rotated clockwise about 10◦ relative to those of the mainshock and the two foreshocks determined by Katao et al. (1997).
The other cluster is located at a depth of about 6 km beneath the eastern part of the Akashi Strait (area b in Fig. 7). Most of the events in this cluster are of reverse fault type. P-axes of these aftershocks are oriented approximately in N-S, in contrast with the regional compressional direction of E-W to ESE-WNW.
3.4 Temporal variation in aftershock mechanisms
The temporal variation in P-axes directions related to a large earthquake was studied by Zhao et al. (1997). They reported that the average direction of P-axes in the epicentral area of the 1994 Northridge earthquake changed from N30◦E to N13◦E before and after the mainshock, suggesting the coseismic stress rotation. Furthermore, they showed that the stress orientation rotated back to its original orientation (N34◦E) during the two years following the mainshock.
sep-Fig. 5. Type of focal mechanisms of aftershocks in the Kobe region. Diamonds represent strike-slip type, triangles for reverse-fault type and squares for normal-fault type. Circles show intermediate types. Solid and open symbols represent the aftershocks observed in the 1st (from Jan. 26 to May 12, 1995) and 2nd observation periods (from Oct. 1, 1995 to Jan. 12, 1996), respectively. Short bars attached to epicenter circles represent the horizontal projections of P-axes. Star shows the hypocenter of the mainshock.
Fig. 7. Type of focal mechanisms of aftershocks in Akashi Strait. All symbols are the same as those in Fig. 5.
arately for each cluster that we identified. We use the fo-cal mechanism solutions from January 17, 1995 to January 28, 1995 determined by Kataoet al. (1997), in addition to those determined in this study. Within the accuracy of the present data set, we observe no temporal changes in focal mechanism orientations in area c in Fig. 5 from the first to the second period of observation (Fig. 8).
4.
Discussion
Most aftershocks (M ≥ 2.3) have strike-slip or reverse fault mechanisms with P-axes approximately in an E-W or ESE-WNW direction (Fig. 5, 6, and 7). Kataoet al. (1997) reported that P-axes of many aftershocks are approximately in an E-W direction. They compared their results with the regional stress field in the Kinki District: the E-W compres-sion before the Hyogo-ken Nanbu earthquake reported by Iio (1996). They suggested that the mainshock rupture zone was still controlled by the regional stress field of E-W compres-sion even after the large mainshock. In this study, events with P-axes in E-W directions are observed along the main-shock rupture zone for aftermain-shocks within the clusters of the strike-slip events close to the Rokko Fault and the northern end of the Gosukebashi Fault (area a in Fig. 5), the cluster of reverse fault events near the southern end of the Gosuke-bashi Fault (area b in Fig. 5) and the aggregation of after-shocks near the southern edge of the Nojima Fault (area a in Fig. 6). We consider that these regions are controlled by the regional stress field of approximately E-W compression after the mainshock.
On the other hand, we observe many aftershocks whose P-axes are inconsistent with the regional stress. A small num-ber of normal mechanism events occurred along the main-shock rupture zone, as Kataoet al. (1997) pointed out. The aftershocks along the Suma Fault show mainly reverse mech-anism solutions with P-axes in a SE-NW direction (area c in Fig. 5). In the eastern part of the Akashi Strait (area b in Fig. 7), the aftershocks with N-S compressional focal mech-anism form a cluster. We further detect a large scatter of P-axis directions for the aftershocks in the northeastern part of Awaji Island (Fig. 6). Such a complex pattern of aftershock focal mechanisms was also observed in the case of the 1989
Fig. 8. Temporal variations in P-axis directions for the cluster of after-shocks along the Suma Fault (area c shown in Fig. 5). Solid and open circles represent the P-axis direction of those observed in the 1st and 2nd observation periods, respectively. Solid squares for the first 10 days af-ter the mainshock are data deaf-termined by Kataoet al. (1997). Error bars indicate a range of possible focal solutions.
Loma Prieta earthquake (Michaelet al., 1990; Oppenheimer, 1990).
In this study, we call aftershocks that are inconsistent with the regional stress field “atypical.” That is, atypical af-tershocks are defined as those with a P-axis oriented more than 45◦ from the E-W direction or with a P-axis plunge of more than 45◦. The 48 atypical aftershocks identified in the present data set correspond to about 17% of the total. We compare the spatial distribution of the aftershocks, especially the atypical aftershocks (Fig. 9), with the inverted slip and stress distributions for the mainshock and other parameters to clarify the cause of the occurrence of the atypical after-shocks. The Coulomb stress change by the mainshock was calculated and compared with the induced seismicity rate change in the surrounding areas (Hashimoto, 1997; Todaet al. 1998). However, the aftershocks discussed in this study occurred on the mainshock slip plane or very close to it. Be-cause the present precision of hypocenter determination and slip models are not enough to determine whether each af-tershock occurs on the hangingwall or footwall side of the mainshock slip plane. It is difficult to explain the atypical focal mechanisms using the Coulomb stress change.
Fig. 9. Distribution of atypical aftershocks with the direction of P-axis inconsistent with the regional stress. All symbols are the same as those in Fig. 5.
Figure 11 shows the locations of the atypical aftershocks and the distribution of the final stress. In the Kobe region, there are atypical aftershocks around the Suwayama Fault and along the Suma Fault (Fig. 9). The atypical aftershocks are located at the boundary between the areas of higher and lower final stress. The locations of the atypical aftershocks are compared with the distribution of the slip for the main-shock shown in Fig. 12. In the Kobe region, the slip of the mainshock is the greatest below about 10 km. For the atypical aftershocks around the Suwayama Fault, especially the events of normal or close to normal fault type near the boundary between the Suwayama Fault and the Suma Fault, we suppose that they are caused by the local stress field per-turbed by the difference of displacements at the depth of 10 km. From the comparison with the stress and the slip dis-tributions for the cluster of mainly reverse fault type events observed along the Suma Fault, we can see that these are located on the edge of high stress or large slip area. The focal mechanisms of aftershocks in this cluster are similar to each other (there are two types, reverse and intermedi-ate types, because of the classification of mechanisms), and they are aligned parallel to the active fault at almost the same depths. These are different from other atypical aftershocks distributed in the shallower part of the cluster of strike-slip events in the Kobe region. P-axis directions of these af-tershocks are perpendicular to the strike of the active fault (Fig. 9). We consider two possible explanations for this clus-ter of the atypical afclus-tershocks of mainly reverse fault type
along the Suma Fault. One explanation is that the events are caused by the local stress field disturbed by the hetero-geneous displacement near the boundaries of the mainshock rupture. The other is that the shear stress from the regional stress field was adequately canceled by the mainshock slip. Along the San Andreas fault system in central California show the NE-SW compression that is nearly perpendicular to the strike of the fault (Zobacket al., 1987). In the case of this study, however, the regional stress field of E-W compression was obsereved in a wide area around the rupture faults be-fore/after the mainshock. We consider that the anomalous P-axis directions nearly perpendicular to the strike of the fault are caused by the heterogeneous coseismic slip.
atyp-Fig. 10. Cross section of the hypocenter distribution of the aftershocks with the final stress on the mainshock faults of Bouchonet al. (1998), along the X-Y line of Fig. 1. All symbols are the same as those in Fig. 5. The contour interval of final stress is 1.0 Mpa.
Fig. 11. Cross section of the locations of the atypical aftershocks with the final stress on the mainshock faults of Bouchonet al. (1998), along the X-Y line of Fig. 1. All symbols are the same as those in Fig. 5. The contour interval of final stress is 1.0 MPa.
Fig. 12. Cross section of the locations of the atypical aftershocks with the coseismic slip distribution of Bouchonet al. (1998), along the X-Y line of Fig. 1. All symbols are the same as those in Fig. 5. The contour interval of slip is 0.1 m.
ical aftershocks occurred are closer than those in the Kobe region, as shown in Fig. 12. That is, the heterogeneity of the mainshock slip is greater on Awaji Island, and the stress field is disturbed to a higher degree, causing atypical aftershocks there.
Tadokoroet al. (1999) analyzed S-wave splitting in and around the aftershock region. They showed that the polar-ization directions of the faster shear wave (ψ) in the north-ern part of Awaji Island were various to strikes of the known active faults. Their results seem to agree with the P-axis directions of the aftershocks determined in this study. For the region whereψis not consistent with the regional stress field, the inconsistency appears to be caused by its
compli-cated geology in the northeastern part of Awaji Island. These observations may be partly originated from complicated rup-ture of the mainshock.
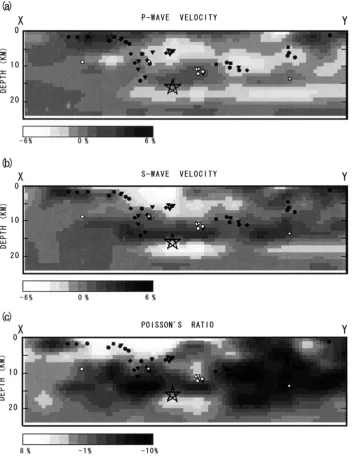
Fig. 13. Cross section of the locations of the atypical aftershocks in comparison with the (A) P-wave velocity, (B) S-wave velocity and (C) Poisson’s ratio from Zhao and Negishi (1998), along the X-Y line of Fig. 1. All symbols are the same as those in Fig. 5.
at which S-wave velocity changes rapidly. From the veloc-ity structure of the crust only, however, we cannot surmise the cause of the atypical aftershocks with P-axes in a N-S direction, which is perpendicular to the regional stress field. We cannot detect any obvious corresponding anomaly in P-wave velocity structure. A possible cause of the occurrence of these aftershocks is the geometrical gap in the fault seg-ment beneath the Akashi Strait (Nakamura and Ando, 1996; Takahashiet al., 1996), and the resulting perturbation of the stress field.
5.
Conclusions
We relocate the hypocenters of the aftershocks of the 1995 Hyogo-ken Nanbu earthquake and determine their focal mechanisms using seismic records obtained by GROUPS-95. The focal mechanisms of the aftershocks are mainly consistent with the regional stress field, which shows E-W
Acknowledgments. We thank Dapeng Zhao and Hiroaki Negishi for providing their diagram of seismic wave velocity structure. We thank Keiichi Tadokoro for his help to obtain the aftershock data. All participants in GROUPS-95 enable us to do this study. We are grateful to Prof. James Mori and Dr. Peiliang Xu for their careful reading and correction of our manuscript. Comments of Dr. Shigeki Horiuchi, Dr. Kiyoshi Yomogida and an anonymous reviewer are useful to improve our manuscript.
References
Aki, K. and P. G. Richards,Quantitative Seismology, Vol. 1, W. H. Freeman and Company, New York, 1980.
Awata, Y., K. Mizuno, Y. Sugiyama, R. Imura, K. Shimokawa, K. Okumura, E. Tsukuda, and K. Kimura, Surface fault ruptures on the northwest coast of Awaji Island associated with the Hyogo-ken Nanbu earthquake of 1995, Japan,J. Seismol. Soc. Jpn. 2,49, 113–124, 1996 (in Japanese with English abstract).
Bouchon, M., H. Sekiguchi, K. Irikura, and T. Iwata, Some characteristics of the stress field of the 1995 Hyogo-ken Nanbu (Kobe) earthquake,J. Geophys. Res.,103(B10), 24271–24282, 1998.
Hashimoto, M., Correction to “Static stress changes Associated with the Kobe Earthquake: Calculation of changes in Coulomb failure function and comparison with seismicity change”,J. Seismol. Soc. Jpn. 2,50, 21–27, 1997 (in Japanese with English abstract).
Hiramatsu, Y., N. Hayashi, M. Furumoto, and H. Katao, Temporal changes in coda Q−1andbvalue due to the static stress change associated with the 1995 Hyogo-ken Nanbu earthquake,J. Geophys. Res.,105(B3), 6141– 6151, 2000.
Hirata, N. and M. Matsu’ura, Maximum-likelihood estimation of hypocen-ter with origin time eliminated usuing nonlinear inversion technique,
Phys. Earth Planet. Inter.,47, 50–61, 1987.
Hirata, N., S. Ohmi, S. Sakai, K. Katsumata, S. Matsumoto, T. Takanami, A. Yamamoto, T. Iidaka, T. Urabe, M. Sekine, T. Ooida, F. Yamazaki, H. Katao, Y. Umeda, M. Nakamura, N. Seto, T. Matsushima, H. Shimizu, and Japanese University Group of the Urgent Joint Observation for the 1995 Hyogo-ken Nanbu Earthquake, Urgent joint observation of after-shocks of the 1995 Hyogo-ken Nanbu earthquake,J. Phys. Earth,44, 317–328, 1996.
Ide, S. and M. Takeo, Determination of constitutive relations of fault slip based on seismic wave analysis,J. Geophys. Res.,102(B12), 27379– 27391, 1997.
Iio, Y., Depth-dependent change in the focal mechanism of shallow earth-quakes: Implications for brittle-plastic transition in a seismogenic region,
J. Geophys. Res.,101(B5), 11209–11216, 1996.
Katao, H., N. Maeda, Y. Hiramatsu, Y. Iio, and S. Nakao, Detailed mapping of focal mechanisms in/around the 1995 Hyogo-ken Nanbu earthquake rupture zone,J. Phys. Earth,45, 105–119, 1997.
Maeda, N., A method of determining focal mechanisms and quantifying the uncertainty of the determining focal mechanisms for microearthquakes,
Bull. Seismol. Soc. Am.,82, 2410–2429, 1992.
Mendoza, C. and S. H. Hartzell, Aftershock patterns and main shock fault-ing,Bull. Seismol. Soc. Am.,78, 1438–1449, 1988.
Michael, A. J., W. L. Ellsworth, and D. H. Oppenheimer, Coseismic stress changes induced by the 1989 LomaPrieta, California earthquake, Geo-phys. Res. Lett.,17, 1441–1444, 1990.
Nakamura, M. and M. Ando, Aftershock distribution of the January 17, 1995 Hyogo-ken Nanbu earthquake determined by the JHD method,J. Phys. Earth,44, 329–335, 1996.
Nakata, T., K. Yomogida, J. Odaka, T. Sakamoto, K. Asahi, and N. Chida, Surface fault ruptures associated with the 1995 Hyogo-ken Nanbu earth-quake,J. Geogr.,104, 127–142, 1995 (in Japanese with English abstract). Oppenheimer, D. H., Aftershock slip behavior of the 1989 Loma Prieta,
California Earthquake,Geophys. Res. Lett.,17, 1441–1444, 1990. Tadokoro, K., M. Ando, and Y. Umeda, S wave splitting in the
after-shock region of the 1995 Hyogo-ken Nanbu earthquake,J. Geophys. Res., 104(B1), 981–991, 1999.
Takahashi, N., K. Suyehiro, M. Shinohara, A. Kubo, A. Nishizawa, and H. Matsuoka, Aftershocks and faults of the Hyogo-ken Nanbu earthquake beneath Akashi Strait,J. Phys. Earth,44, 337–347, 1996.
Toda, S., R. S. Stein, P. A. Reasenberg, J. H. Dieterich, and A. Toshida, Stress transferred by the 1995 Mw=3.9 Kobe, Japan, shock: Effect on aftershocks and future earthquake probabilities, J. Geophys. Res., 103(B10), 24543–24565, 1998.
Urabe, T. and S. Tsukada, A workstation-assisted processing system for waveform data from microearthquake networks, Abstracts of Spring Meeting of Seismological Society of Japan, 70, 1991 (in Japanese). Zhao, D. and H. Negishi, The 1995 Kobe earthquake: Seismic image of the
source zone and its implications for the rupture nucleation,J. Geophys. Res.,103(B5), 9967–9986, 1998.
Zhao, D., H. Kanamori, and D. Wiens, State of stress before and after the 1994 Northridge earthquake,Geophys. Res. Lett.,24, 519–522, 1997. Zoback, M. D, M. L. Zoback, V. S. Mount, J. Suppe, J. P. Eaton, J. H. Healy,
D. Oppenheimer, P. Reasenberg, L. Jones, C. B. Raleigh, I. G. Wong, O. Scotti, and C. Wentworth, New evidence on the state of stress of the San Andreas fault system,Science,238, 1105–1111, 1987.