THE GENETIC VARIANCE FOR VIABILITY AND ITS COMPONENTS IN A LOCAL POPULATION OF DROSOPHZLA MELANOGASTERI
TERUMI MUKAI, RICARDO A. CARDELLINO, TAKA0 K. WATANABE2 AND JAMES F. CROW
Deprrrtment of Genetics, North Carolina State University Raleigh, North Carolina 27607
and
University of Wisconsin, Madison, Wisconsin 53706
Manuscript received August 20, 1973 Revised copy received June 14, 1974
ABSTRACT
Two hundred and ninety second chromosomes extracted from a natural population of Drosophila melanogaster were analyzed to estimate the genetic variance of viability and its components by means of a partial diallel cross (Design I1 of COMSTOCK and ROBINSON 1952). The additive and dominance variances are estimated to be 0.009 and 0.0012. Using the dominance variance and the inbreeding depression, the effective number of overdominant loci con- tributing to the variance in viability is estimated to be very small, a dozen or less. Either the actual number of loci is small, or the distribution of viabilities is strongly skewed with a large majority of very weakly selected loci. The additive variance in viability appears to be too large to be accounted for by recurrent harmful mutants or by overdominant loci at equilibrium with various genetic parameters estimated independently. The excess might be due to frequency-dependent selection, to negative correlations between viability and fertility, or possibly to the presence of a mutator. The selection f o r via- bility and fertility, o r possibly to the presence of a mutator. The selection for viability at the average polymorphic locus must be very slight, of the order
of 10-3 or less.
W E present here the results of a partitioning of the genetic variance for viability into additive and dominance components and an attempt to deter- mine the relative contributions of different kinds of genes to these components. The discovery of numerous polymorphisms for isozymes and other proteins (LEWONTIN and
HUBBY
1966) has added to the interest in ways by which the population variability is maintained. MUKAI and MARUYAMA (1971) have sug- gested that these polymorphisms are mainly neutral, or nearly so, because in simulation studies based on empirically estimated population parameters they could account for the homozygous genetic load in D. melanogaster by assuming only ten to twenty heterozygous loci per second chromosome. In this paper we Paper Number 4146 of the Journal S e n e of the North CamIina State University Agncultural Evpenment Statim, Raleigh, North Carolma, and Paper Number 1861 f" the Laboratory of Genetics, University of Wisconsm, MadlsonTh-s investigation was supported by NIH Research Grant Numbers GM 11546 and GM 15422 from the National Institute of General M e d m l Sciences The computing was supported by Public Health Service Grant FR GQOll
Present address National Institute of Genetics, Rhshima, Japan
1196 T. MUKAI et al.
give evidence that the dominance variance in viability, insofar as this is caused by overdominant genes, is either due to a very small number of loci, or the average effect on viability per locus is very small. The data also suggest that the additive variance is too large to be accounted for by recurring harmful mutants or overdominant loci at equilibrium.
EXPERIMENTAL PROCEDURES
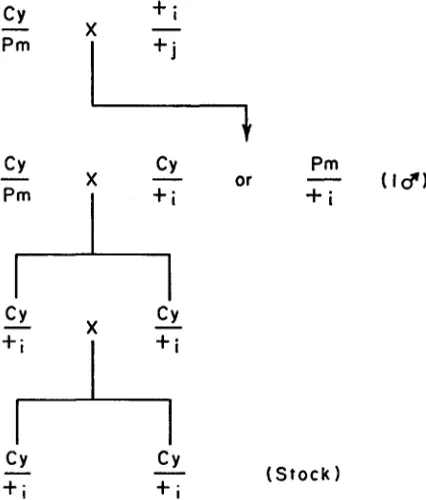
The chromosomes used in the experiments were descended from 691 second chromosomes extracted from a population of Drosophila melanogaster in Reedy Creek State Park near Raleigh, North Carolina. The method of isolating chromo- somes and maintaining them in stock cultures is shown in Figure 1. Each chro- mosome was maintained in a stock heterozygous with the second-chromosome balancer S M I . This chromosome can be identified by the dominant curly wing phenotype, abbreviated Cy. C y / C y homozygotes are lethal. The salivary gland chromosomes of each line were examined by MR. OSAMU YAMAGUCHI; 130 of the 691 were found to carry inversions.
Experimerzt 1: 154 chromosome lines were randomly chosen and divided into 11 groups of 14 lines each. Each group was divided into t w o equal subgroups, and each line of the first subgroup was mated with each of the second to constitute
a 7 x 7 partial diallel arrangement with 7 rows and columns. From the ith line (row) 5 Cy/+, females were mated to 5 C y / f j males from the jth line (column)
CY
+ i
-
-
( S t o c k )+ i
VIABILITY V A R I A N C E I N DROSOPHILA 1197
in two replicates. Reciprocal crosses, Cy/+j females
x
Cy/+, males, were also made, again in two replicates. The design is equivalent to DesignI1
of COMSTOCK and ROBINSON (1952) with reciprocal matings.Four days after crosses were made, the flies were transferred to a second vial, and after four more days all the parents were discarded. The offspring counts were continued until the eighteenth day after the matings (or transfers) were made. The counts from the original and transfer vial were pooled. The analysis was d m e in two ways. In the first, the viability was expressed as a ratio, (Number of wild-type flies)/(Number of Cy
+
l ) , the 1 being to correct a bias from averaging ratios (HALDANE 1956). Later, each viability ratio was standardized by the average viability of the group. Thus the average viability ratio of the population is necessarily 1.00. I n the second analysis that relative viability was expressed as the logarithm of the ratio of wild-type to Curly flies. In group 10 one line was missing by accident. The number of matings was therefore [ 10 (7 X7)
4-
( 7 X 6) ] X 2 reciprocal crosses X 2 replicates ~ 2 1 2 8 , or 4256 vials counted. Of the 153 chromosomes tested, 19 carried inversions.Experiment 2: This was done exactly the same as Experiment 1, except that none of the chromosomes had an inversion. One hundred and forty chromosomes, different from those of Experiment 1, were chosen at: random. Three were lost in the course of the Experiment. The total number of matings was 1876, or 3752 vials counted. However, one cross (in group 8) was lethal due to allelism of lethal genes carried by the parental chromosomes. Thus, the total number of matings available was 1872 or 3744 vials counted.
Experiment 1 was begun approximately 2 months after the flies were captured. Experiment 2 was begun approximately a year later. Except during the experi- ments, the flies were kept at 19".
ANALYSIS O F VARIANCE
The total sum of squares in each group was partitioned into ROWS, Columns, Row X Column Interaction, and Error, considering reciprocal crosses as addi- tional replicates (see DATA AND ANALYSIS below). The sums of squares of all the groups were pooled and the variance components were estimated fro" the pooled data.
The variance components were estimated as follows:
Source of Degrees Mean Expectation of
variation of freedom squares mean squares
9n
Females (Rows) .Z (ai - 1) MSE V E
+
n V R x C+
k,VR1 = 1
m
Males (Columns) i=1
z
( b i
- 1) MSc V E+
n V R x C+
k2Vc mInteraction
,x
(ai - 1) (bi-
1) MSRxC V ,f
nVRxC1 =1
1198 T. MUKAI et al.
where ai is the number of female parents in group
i
( i
= 1,. . .
,m), b, is the number of male parents, m is the number of groups, and IZ is the number ofreplicates per cell. When there were no missing cells,
k,
was calculated by Xnb,(a, - l)/X(ai - 1 ) andk,
by Znaz ( b , - I)/z( b i
- 1). When there were missing cells, quantities corresponding to nai or nbi were calculated by the least- squares method (cf. SCHAFFER andUSANIS
1969),
and after that the same pro- cedure as above was used. Except when a line was missing, ai = bi = 7, and n = 4 for all cells, andk,
=k,
= 28.For the groups having missing cells (about which detailed description will be given later), the computer program written by
SCHAFFER
andUSANIS
(1969)was employed for the analysis of variance.
Since Vc and V R are expected to be the same, their pooled estimate
(Op)
was obtained for the estimation of the additive variance.MSRz(a,
-
1)+
MScz(bi-
1)- MSRXC ___-___
z(a, - 1 )
+
Z ( b i - 1)8,
=klZ(a, - 1)
+
k,Z(bi-
1 ) __--z ( a ,
-
1 )+
X(bi-
1)The same Cy chromosome was used for all matings. The progeny within a
cell are full sibs as regards the second chromosome and, therefore, all the wild- type progeny have identical second chromosomes. This means that the variance of the standardized viability ratios among cells is the total genetic variance, which is V ,
+
VD+
V,,4-
V A D+
VnD plus higher order epistatic terms, whereVA
is the additive (genic) variance, V D is the dominance variance, and the double subscripts indicate epistatic combinations of these(KEMPTHORNE
1957). Within a row or column the progenies in different cells are half-sibs with respect to the second chromosomes. Since the parents in a line have identical second chromo- somes, the half-sib covariance of the viability ratios is equivalent to that from homozygous parents, or 1/2 V ,+
1/4
VAA. The total variance among cells (matings) is VR4-
Vc+
VRxc. Since VR = Vc = 1/2 V A+
1/4 V,, and VR+
V C -I- VR~C = V ,+
V D+
V A A+
VAD+
V D D , we have the estimating equationsv,
+
1/2v,,
= 2vp = VR+
v c (1)V D
+
1/2v,,
+
VAD f VDD = VRxC.
( 2 ) The other chromosomes,X , Y ,
ZZZ, and ZV, are not controlled i n these experi- ments. Variance components from these sources will affect the results only if they differentially influence the viability of wild-type and Curly flies. However, interchromosomal epistasis is probably small for chromosomes of near normal viability, so this source of variability has been ignored. W e shall also ignore intra-chromosome epistasis in the subsequent analysis.VIABILITY VARIANCE I N DROSOPHILA 1199
enough for our purpose. Let s, be the additive deviation of genes on the ith chro- mosomes, sc the deviation of the C y chromosome, dij be the dominance deviation of genes in the +i/+j heterozygote, and d,, be the dominance deviation of genes in the Cy/+, heterozygote (these are all assumed to be small quantities with mean 0 ) . Recall that the mean ratio of
+/+
to Cy/+ flies has been standardized to equal one. Then the expected standardized ratio of wild-type to Curly flies in the progeny of the Cy/+ix
Cy/+, mating, which consist of +i/+j, Cy/+,, and Cy/+, genotypes, is,1 +si
+
s j+
dij1/(1 +si
+
S,+
dlc)+
1/2(1+
S,+
S,+
dj,) ’If the s and d values are small, this is approximately equal to 1
+
(1/2>
(si + s i )-
1 / 2 ( d i c+
d j c )-
s c+
dijIf all epistasis is ignored, the variance of the row effects plus that of the column effects is
v,
+
v c =v,
+
1/2
v,
.
There is no variance contribution from s, since all Curly chromosomes are the same. The interaction variance is
V R X C = V D 7
again ignoring epistasis.
The equations for estimating V , and V , become
and
v,
=4
( V ,
+
v c - 1/2 V R X C )V D = V R x O .
(3)
(4)
DATA A N D ANALYSIS
An analysis showed no significant differences between reciprocal crosses in Experiment 1
(F532,1064
= 1.028). However, significant reciprocal differences were detected in Experiment 2 (F463.926 = 1.28, P<
O.Ol), but these differences1200 T. MUKAI et a2.
TABLE 1
Analysis of variance of viability data
Experiment 1. 153 chromos9mes of which 19 carried inversions
Source D.F. M . S . F
Parents (R
+
C )Interaction (R x C)
Error Total
131 0.065034 2.75' * * 390 0.023663 1.24* * 1596 0.019072
2117
ExDenment 2. 137 chromosomes. all inversion-free
Source D.F. M . S . F
Parents ( R
+
C)Interaction (R x C )
Error Total
117 0.060083 2.79** * 330 0.02542% 1.18* 1371 0.021542
1818
*** P
<
0.001. * * P<
0.01.* P
<
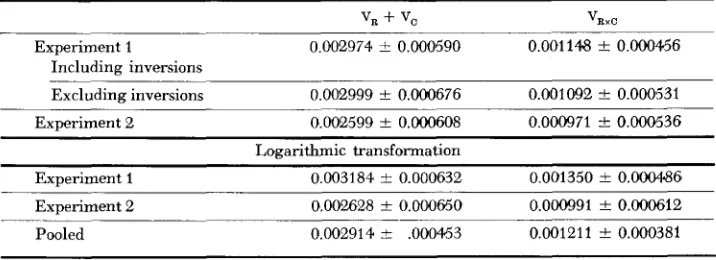
0.05.The overall analysis of variance for the two experiments is shown in Table 1. The sums of squares for rows and columns are combined, as are their degrees of freedom. From the values in Table 1 the components of genetic variance and their standard errors were computed from Equations 1 and 2 (see TALLIS 1959). These are shown in Table 2. As can be seen, there is no appreciable difference when the 19 chromosomes carrying inversions are omitted, so there is no evidence from these experiments that the inversions have important effects on the genetic variance for viability and its components. Furthermore, there is very little difference in Experiments 1 and 2 despite the stocks in Experiment 2 having been kept one year at 19" before the experiments was done.
At the bottom of Table 2 is the second analysis, based on the logarithm of the ratio of wild-type to Curly flies in each culture. The final pooled estimate was
TABLE 2
Estimated variance components for viability
'R + 'C 'RxC
Experiment 1 O.OC2974 5 O.OOC590 0.001148 f 0.000456 Including inversions
Excluding inversions 0.002999 f 0.000676 0.001092
*
0.000531 Experiment 2 0.002599 & 0.000608 0.000971 z!z 0.000536Logarithmic transformation
VIABILITY V A R I A N C E I N DROSOPHILA 1201
crrived at by weighting the two experiments inversely by their error variances.
Va as estimated from Equation 3 is 0.00923 for the pooled, logarithmically transformed data, as compared to 0.00291 for V R
4-
V , i n Table 2. For the untransformed ratios, the estimate of V , is .00960.WALLACE
and DOBZHANSKY (1962) have reported that the Curly chromosomei s almost completely dominant to its homolog. In that case V , should be estimated simply by V R
4-
Vc,
rather than by Equation 3. The estimate of 0.009 may then be too high. It is unlikely, however, that a particular chromosome can influence the genetic variance among all the genes on its homologs. Furthermore, recent experiments ( MUKAI, unpublished) show normal variance among the chromo- somes heterozygous with Cy. W e therefore think that Equation 3 provides the best estimate for the additive variance.INTERPRETATION O F VARIANCE COMPONENTS
The parameters for a locus with two alleles in Hardy-Weinberg proportions are as follows:
Genotype A A Aa aa
Frequency
P2
2Pq q2( 5 )
Relative viability 1 1 - h s l - s
With this model, the total genetic variance for a single locus ( V , ) , the additive (genic) component (V,), and the dominance component (V,) are given by: ( 6 ) ( 7 ) (8)
From the relations
( 5 )
the mean viability, E, of a randomly mating population is 1-
2pqhs - q2s and that of a completely inbred population is 1 - qs. There- fore, the inbreeding decline from F = 0 to F = 1 isVt =pqs2[2(1 - 2 p q ) h 2
-
4q2h+
q ( 1 + q ) ]V ,
= 2 ~ 4 s ' [ ( p - 4 ) h+
41Va= p2q2s2(1 - 2h)'
.
1 = ( q s - 2pqhs - 9's)
/W
= [ p q s ( l - 2 h ) ] / W
.
(9)This is the inbred load for viability, with the convention that the inbred viability is measured as a deviation from a randomly mating population, rather than from the most viable genotype as conventional load theory prescribes (e.g., MORTON, CROW and MULLER 1956; CROW 1970). Note that Va = l2 when
W
= 1.Assuming that the effects at individual loci on the chromosome are small enough and/or nearly enough to being independent to be additive, the inbreeding decline f o r the whole chromosome is
L =
X I =
n7
( 1 0 ) where n is the number of loci. Likewise under the same assumptions the domi- nance variance for the whole chromosome is1202 T. MUKAI et al.
Our viability ratios are standardized to a mean value of 1, which means that s
(12) in Equations (6)-(8) is equivalent to s/E in (9). Therefore V d =
12,
andv,
= 2 1 2 = n(12+
V , ).
Therefore, the ratio L2/VD provides a minimum estimate of the number of rele- vant loci.
Note that the foregoing equations require no assumption that the gene fre- quencies are at equilibrium. DR. JOSEPH FELSENSTEIN (personal communication) noted earlier that for an overdominant locus with two alleles at gene frequency equilibrium the square of the inbreeding decline is equal to the genetic variance, and that this might be used as a way of estimating the gene number associated with a quantitative trait. We now see that his relationship is a consequence of (12), because at equilibrium with overdominance all the variance is in the dominance component.
The additional quantities needed to interpret these variance components come from other studies. The total viability load due to new mutations, Zuisi, is esti- mated to be 0.0040
*
0.0002 (MUKAI 1964; MUKAI et al. 1972). This may be written nu?, where n is the number of loci, 6 = ( z u ) / n is the average mutation rate per locus, and ? = ( Z U S ) / Z U is the average effect of a mutant on viabilityweighted by its mutation rate. The number of loci is taken as 2500. This is based on the number of salivary chromosome bands, an assumption made plausible by the correspondence between the number of bands and the number of comple- mentation units in an intensively studied region of the Drosophila X chromosome
(JUDD,
SHEN and KAUFMAN 1972). xu was estimated as greater than 0.17 and Sas less than 0.023, but it should be realized that the product of these two quanti- ties, .0040, is known with much more precision than either factor (see MUKAI
et al. 1972).
The average dominance of newly arisen viability mutants is estimated to be about 0.4 (MUKAI 1969), and for those in a natural population about half this value, 0.2. Finally, the homozygous detrimental load (GREENBERG and CROW
1960), expressed as a deviation from the average viability of a randomly mating population, is estimated to be 0.33 in this population (MUKAI and YAMAGUCHI 1974).
In the following calculations we shall take the basic parameters to be: Load due to new mutations:
Additive variance: Dominance variance:
Average homozygous selective disadvantage: Mutation rate per locus:
Homozygous detrimental load:
Average dominance of mildly deleterious mutants in equilibrium population: Number of loci per second chromosome:
zus = nuS = 0.004
v,
= 0.009v,
= 0.0012S = 0.02
U = 0.00008
L = 0.3
h = 0.2
VIABILITY VARIANCE I N DROSOPHILA 1203
THE EFFECTIVE NUMBER O F LOCI CONTRIBUTING T O THE DOMINANCE VARIANCE
W e emphasize that Equations 6-12 do not require any assumption that the gene frequencies are in equilibrium. We shall use Equations 10 and 12 to estimate the number of loci contributing to the dominance variance. W e define ne as the effective number of loci. This will be the actual number when l is the same for each locus; otherwise it is a minimum estimate. If
Vl
is taken as zero, the effec- tive number of loci is estimated byL2/VD.
Taking the values above, the effective number of loci contributing to the dominance variance is (0.3)2/0.0012 = 75. Of course, if the loci contribute very unequally to the variance the actual number may be much larger.
Further analysis requires assumptions about equilibrium gene frequencies.
RECESSIVE MUTANTS
Letting h = 0, the equilibrium frequency of the recessive mutant gene is
q = u/sc
where c is a quantity introduced to relate selection on total fitness to that on viability alone. Presumably, c
>
1.Substituting (13) into (8) and (11) and neglecting terms of order q3
-
VD
=
z ( u s / c ) =(+)
zusif c and us are independent. If zus = .004 and the observed value of
Vo
is .0012,this implies that c is 3.33; that is to say, selection on total fitness is about 3 times as great as that on viability alone.
If
c is variable, as it surely must be, the smaller values of c are most influential, since it is the harmonic mean that is relevant.c = 3.3, and n = 2500, the expected value of
L,
from (13), (9), and (IO) is 1.7. The observed inbred load,L,
is 0.3 and this surely includes effects other than recessive genes. W e conclude, in agreement with other studies (e.g. MUKAI et al. 1972), that most viability mutants are not fully recessive. Consequently, we suspect that, although there may well be completely recessive mutants in the population, they do not account for all the dominance variance.On the other hand, i f s = .02, U = 8
x
PARTIALLY D O M I N A N T MUTANTS
If there is partial dominance (0
<
h<
1 ) the equilibrium gene frequency isq
=
u/chs (15)where U is the mutation rate from A to a. We assume that h2
>>
u/cs and cs >> U. Then, substituting (15) into (7) and (8), we obtainV , 2uhs/c
1204 T. MUKAI et al. Their ratio is
V d ~ ( l -215)~
R = - z
V , 2h3cs
This ratio decreases as h increases toward 1/2 variance is additive.
(18)
and for this value all the
If u = 8
x
s = .02, and h = .4, R = .0013 if c = 1 and is less if c>
1. If h = .2,R
= .09 if c = 1 and is less if c>
1. Since the observed value of V D is.0012 and V A is .009, these calculations show that the dominance variance is too large relative to the additive variance to be accounted for by mutants with h
>
.2. We cannot be sure of this argument, though, because the quantities in (18) are certainly not constant. R is likely to be increased if h is variable because of the influence of small values of h entering as h3 in the denominator. Furthermore,U may be underestimated. So, although the high observed values of h in other
experiments argue that V D is not entirely accounted for by partially dominant loci, we cannot rule out this possibility from our data.
On the other hand, the inbreeding decline, L, is easily accounted for by par- tially dominant mutants.
L
= nu( 1 -2h)/ch. If u = 8 x10⁻⁵, n = 2500, c = 2, and h = 0.2, then L agrees with the observed value, 0.3.O V E R D O M I N A N T LOCI
I n view of the analysis above it is likely, although by no means proven, that not all the dominance variance is caused by recessive and partially dominant mutants. An obvious candidate for the remaining variance is overdominant loci. We consider a somewhat restricted model in which all heterozygotes are of
equal viability (say, 1)
,
but homozygotes may differ. The homozygote AiAi has viability 1 - sz. We are assuming that mutation is small enough to play no significant role in determination of equilibrium frequencies and that all selection is on viability.The mean viability at equilibrium is
(19)
s
k
= 1 -
zsip;
= 1 - p ' s ' 2 2= 1 - -where S is the harmonic mean of the si's and k is the number of segregating alleles at this locus (see CROW and KIMURA 1970, pp. 304-308). The mean via- bility of homozygotes is l - S. Measured from the population mean, the inbred viability load is
(20)
j - k - 1
k
k .L = j - - = j J .
The variance, which at equilibrium is all dominance variance, is
Summing over loci
VIABILITY VARIANCE I N DROSOPHILA
V D =
W ( k j
- l)/k5 = n [ P ( k - l)/k2].
We can then estimate the effective numbser of loci by1205
(23)
where ne is a correct estimate of n if all loci act equally, but is an underestimate otherwise. The observed dominance variance is 0.0012. Suppose that 0.001 is the contribution from overdominant loci. The inbred load from overdominance is not likely to be greater than 0.1 ; the maximum possible, if the entire inbred load has this cause, is 0.33. Here are a few representative numbers:
VLI
L
k
ne.001 .3 2 90
.1 2 10
.3 4 30
.I 4 3 .
The situation is more complicated if the genes that affect viability also have effects on other aspects of fitness, such as fertility. However, the equilibrium frequency of the alleles depends only on their relative homozygous disadvan- tages, not their absolute values. If the decrease in fitness of a homozygote is pro- portional to the decrease in viability, Equations 19-24 are still correct for
viability.
This is a dubious assumption, however. The calculations in the paragraph above for
k
= 2 do not depend on gene frequency equilibrium, as mentioned earlier. W e suspect, but cannot prove, that whenk
>
2 the effective number of loci becomes smaller for nonequilibrium conditions as it does f o r our equilibrium model.It thus appears that if the typical segregating overdominant locus has more than two alleles, the effective number of such loci must be quite small-a dozen or less per chromosome, in agreement with the analysis of MUKAI and MARU- YAMA (1971 )
.
Of course, if the loci differ greatly in the magnitude of their effects the actual number may be much larger than the effective number. I n particular, this analysis doles not rule out a small number of loci with relatively large effects and a much larger number with near-zero effect on viability.1206 T. MUKAI et al. THE ADDITIVE VARIANCE
There remains the question of what accounts for the additive variance for
For recessive mutants with the parameters that we have been using ( U == 8 x
s = .02, h = 0, c = 2, and n = 2500), the additive variance for viability from (13) and (7) is roughly much smaller than the observed value. For partially dominant loci, the situation is about the same. Even if h is as high as 0.4, the expected additive variance from (16) is about 0.0016, again too small for the observed value. It is possible that u and s are incorrectly estimated, but the experimental procedures (MUKAI et al. 1972) are such that the product us is estimated much more accurately than either component; these two terms enter together in (16). So it would appear that recessive and partially recessive via- bility mutants are not sufficient to account for the observed additive variance. Neither are overdominant loci if the population is at equilibrium, for the additive variance should be zero.
What accounts f o r the large additive variance for viability? One possibility is a mutator gene. It is known that chromosomal aberrations and associated lethal mutations occur at a high frequency in this population (CARDELLINO and MUKAI, 1975; YAMAGUCHI, CARDELLINO and MUKAI, in preparation). However, there is no evidence as yet that the mutator produces polygenic mutations. Any effect on the additive variance would have to be mainly through the heterozygous effects of lethals and chromosome aberrations.
A second possibility is that the genes are not at the same equilibrium values as if these were determined solely by viability differences. Total fitness also includes components not measured in our experiments, in particular fertility. There is evidence for negative correlations between viability and fertility for high viability chromosomes (cf. HIRAIZUMI 1961). This could lead to a high additive variance for viability even though the variance for total fitness is restricted.
A
third possibility is frequency-dependent selection.If
there are a number of viability genes with intermediate heterozygotes ( h 0.5), but which are fre- quency-dependenty they might make a substantial contribution to the additive variance in these experiments. Each gene in these experiments has a frequency 1 or 1/3, which is probably not its equilibrium value in nature.viability, estimated as 0.009.
DISCUSSION
All our calculations have assumed that the population is at or very near equilibrium. There are several reasons f o r thinking that this is a reasonable assumption. One is that the parameters of this population resemble very closely a large population cage that has been maintained in the laboratory for many years. Furthermore, these parameters (lethal frequency, inbred load, allelism of
VIABILITY VARIANCE I N DROSOPHILA 1207
W e have also not taken epistasis into account. Studies of chromosomes taken from natural populations and made homozygous (TEMIN et al. 1969) and of newly accumulated viability mutants (MUKAI 1969) both show evidence of slight synergism for mildly deleterious effects on viability. However, the magni- tude of this epistasis is small, especially in high viability chromosomes. These experiments do not, however, rule out the possibility of positive and negative epistasis that are approximately canceling as regards mean effects, but which can still contribute to the variance.
I n addition to the assumptions regarding equilibrium and non-epistasis, there is the problem that laboratory experiments cannot duplicate the complexity and diversity of natural habitats, which may greatly enhance the expression of genetic variability. Our actual measurements are on viability rather than total fitness.
The two experimentally determined quantities measured from chromosomes extracted from natural populations are the inbreeding decline and the genetic variance, the latter divided into additive and dominance components. Although, for the reasons given above, we cannot regard our conclusions as proven, the inbreeding decline in viability is easily accounted for by recessive or partially dominant mutants occurring at rates consistent with laboratory data. On the other hand, the genetic variance of the population appears to be too large to be accounted for by such mutants and therefore, we believe, is caused by loci with some form of balancing selection, such as overdominant or frequency-dependent selection, by negative correlations between viability and fertility, and possibly by the effects of a mutator.
LITERATURE CITED
CARDELLINO, R. A. and T. MUKAI, 1975 Mutator factors and genetic variance components for
viability in Drosophila melanogaster. Genetics (in press).
516. In: Heterosis. Edited by J. W. GOWEN. Iowa State College Press, Ames.
Dominance and overdominance. pp. 282-297. In: Heterosis. Edited by J. W.
GOWEN. Iowa State College Press, Ames. -, 1970 Genetic loads and the cost of natural selection. pp. 128-1 77. In: Mathematical Topics in Population Genetics. Edited by
K. KOJIMA. Springer-Verlag, New York-Heidelberg-Berlin.
CROW, J. F. and M. KIMURA, 1970 An Introduction to Population Genetics Theory. Harper and
GREENBERG, R. and J. F. CROW, 1960 A comparison of the effect of lethal and detrimental
HALDANE, J. B. S., 1956
HIRAIZUMI, Y., 1961
COMSTOCK, R. E. and H. F. ROBINSON, 1952 Estimation of average dominance of genes. pp. 4.94-
CROW, J. F., 1952
ROW, New York.
chromosomes from Drosophila populations. Genetics 45 : 1154-1 168. Estimation of viabilities. J. Genetirs 54: 294-296.
Negative correlation between rate of development and female fertility in
Drosophila melanogaster. Genetics 46 : 61 5-624.
of the X chromosome of Drosophila melanogasfer. Genetics 71: 139-156. JUDD, B. H., M. W. SHEN and T. C. KAUFMAN, 1972
KEMPTHORNE, O., 1957
The anatomy and function of a segment
1208 T. MUKAT et al.
LEWONTIN, R. C. and J. L. HUBBY, 1966 A molecular approach to the study of genic hetero- zygosity in natural populations. 11: Amount of variation and degree of heterozygosity in natural populations of Drosophila pseudoobscura. Genetics 54: 595-609.
An estimate of the mutational damage MORTON, N. E., J. F. CROW and H. J. MULLER, 1956
in man from data consanguineous marriages. Proc. Natl. Acad. Sci. U S . 42: 855-863. The genetic structure of natural populations of Drosophila melanogaster. I .
Spontaneous mutation rate of polygenes controlling viability. Genetics 50 : 1-19. -, 1969 The genetic structure of natural populations of Drosophila melanogaster. VII. Syner- gistic interaction of spontaneous mutant polygenes controlling viability. Genetics 61 : 749- 761. ---, 1969 The genetic structure of natural populations of Drosophila melano- gaster. VIII. Natural selection on the degree of dominance of viability polygenes. Genetics 63: 467-478.
The genetic structure of natural populations o f Dro-
sophila melanogaster. IX. A prediction of genetic equilibrium. Genetics 68: 105-126.
The genetic structure of natural populations of Drosophila
melanogaster. XI. Genetic variability in a local population. Genetics 76: 339-366.
Mutation rate and dominance of genes affecting viability in Drosophila melanogaster. Genetics 72: 335-355.
An analysis of gene-enzyme variability in natural populations of Drosophila melanogaster and D. simulans. Am. Naturalist 103: 97-1 13.
General least squares analysis of diallel experiments. A computer program-DIALL. Genetics Department Research Report Number 1. North
Carolina State University, Raleigh.
TALLIS, G. M., 1959 Sampling errors of genetic correlation coefficients calculated from analysis of variance and covariance. Australian J. Stat. 1 : 35-43.
TEMIN, R. G., H. U. MEYER, P. S . DAWSON and J. F. CROW, 1969 The influence of epistasis on homozygous viability depression in Drosophila melanogaster. Genetics 61 : 47-51 9. WALLACE, B. and TH. DOBZHANSKY, 1962 Experimental proof of balanced genetic loads in
Drosophila. Genetics 47: 1027-1042.
Corresponding editor: T. PROUT
MUKAI, T., 1964
MUKAI, T. and T. MARUYAMA, 1971
MUKAI, T. and 0. YAMAGUCHI, 1974
MUKAI, T., S. I. CHIGUSA, L. E. METTLER and J. F. CROW, 1972
OBRIEN; S. J. and R. J. MACINTYRE, 1969