• No results found

Using Climate and Genetic Diversity Data to Prioritize Conservation Seed Banking for Imperiled Hemlock Species.

N/A
N/A
Protected

Academic year: 2020

Share "Using Climate and Genetic Diversity Data to Prioritize Conservation Seed Banking for Imperiled Hemlock Species."

Copied!
85
0
0

Loading.... (view fulltext now)

Full text

(1)

HASTINGS, JOHN MICHAEL. Using Climate and Genetic Diversity Data to Prioritize Conservation Seed Banking for Imperiled Hemlock Species (Under the direction of Dr. Robert Jetton and Dr. Kevin Potter)

Hemlock woolly adelgid (Adelges tsugae Annand) (HWA) is an invasive forest insect sweeping across the native range of eastern (Tsuga canadensis [L.] Carr.) and Carolina hemlocks (Tsuga caroliniana Engelm.), threatening to severely reduce eastern hemlock extent and pushing Carolina hemlock to extirpation. Now infesting 19 states and over 400 counties, HWA poses a significant threat to these eastern US natives. The current biological and chemical methods for protecting these keystone species are expensive, time-consuming, and short-lived. For the long-term preservation of the species, ex situ genetic conservation efforts such as seed collection, storage, and adelgid-resistant hemlock breeding may be the best solutions. Because it is logistically impossible to collect genetic diversity data from all hemlock populations, it is important to prioritize populations within the species’ native ranges for seed collection efforts. Using a geographic information systems (GIS) technique called multi-criteria evaluation in concert with four genetic diversity parameters, areas of significant eastern and Carolina hemlock genetic diversity were located and threats to those areas were identified. Using the Multivariate Adaptive Constructed Analogs (MACA) statistical downscaling method, climate projections averaged over twenty global climate models were analyzed to display a minimum temperature threshold below which significant HWA mortality occurs. The genetic diversity parameters were then weighted and combined with the minimum temperature threshold.

(2)
(3)
(4)

by

John Michael Hastings

A thesis submitted to the Graduate Faculty of North Carolina State University

in partial fulfillment of the requirements for the degree of

Master’s of Science

Forestry and Environmental Resources

Raleigh, North Carolina 2016

APPROVED BY:

_______________________________ _______________________________

Robert M. Jetton Kevin M. Potter

Committee Co-Chair Committee Co-Chair

_______________________________ _______________________________

(5)

BIOGRAPHY

I was born in Gainesville, Florida. Home of the University of Florida, Gainesville defines a high quality of life through friendship, a rich food culture, and a love for the outdoors. I decided to stay in Gainesville and attend UF where I received a degree in Geography with a focus in GIS. I immediately took a position as the GIS Analyst for

Cumberland Gap National Historical Park, where I was a part of a team motivated to mitigate climate impacts on a small scale. When my time with the National Park Service ended I returned to Gainesville for two years where I worked as a GIS and naturalist intern for a local non-profit springs conservation effort called the Florida Springs Institute, while exploring and applying to graduate schools.

Over the past two years of my graduate education I have developed a preference for climate modeling and landowner outreach. In the future, I hope to leverage my GIS

knowledge with the skillsets of others to provide sustainable and long-term management ideas in a changing climate. I also hope to use GIS techniques and modeling for applications beyond their current scope to answer complex questions. In this way, I can use technology to find real world solutions in a coherent format.

(6)

ACKNOWLEDGMENTS

(7)

TABLE OF CONTENTS

LIST OF FIGURES...vi

CHAPTER 1: A Literature Review of Eastern and Carolina Hemlock as well as the Hemlock Woolly Adelgid and its Ability to Tolerate Low Temperatures ...1

Eastern Hemlock Distribution and Habitat...1

Carolina Hemlock Distribution and Habitat...2

Hemlock Woolly Adelgid Lifecycle...3

Hemlock Woolly Adelgid Cold Tolerance and Range Limits...4

Hemlock Woolly Adelgid Management...7

Genetic Conservation...8

Distribution of Genetic Variation in Hemlock...10

Climate Change Modeling...13

Multi-Criteria Evaluation using GIS...16

Project Objectives...18

References...20

CHAPTER 2: Using Climate and Genetic Diversity Data to Prioritize Conservation Seed Banking for Imperiled Hemlock Species...28

Introduction...29

Data Requirements & Methodology...34

Results...39

(8)
(9)

LIST OF FIGURES

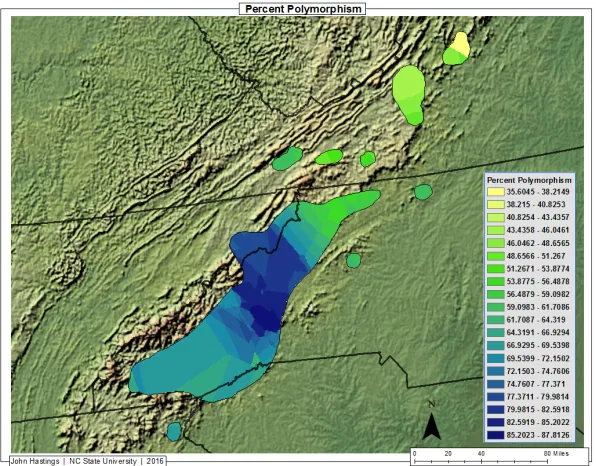
Figure 1.1. Eastern hemlock seed collection locations as sampled by Potter et al. (2012). Low sampling distribution in the northern and western sectors contribute to high prioritization in those areas...56 Figure 1.2. Carolina hemlock seed collection locations as sampled by Campbell (2014). Aside from the modeled parameters, low sampling distribution in the southwestern sector should contribute to at least one sampling location in the area. ...56 Figure 2. New counties infested with hemlock woolly adelgid for each decade through the year 2014. Much of eastern hemlock’s range and the entirety of Carolina hemlock’s range is infested by HWA. ...57 Figure 3.1. Counties infested with hemlock woolly adelgid in each USDA plant hardiness zone. These zones are recreated using the MACA statistical downscaling method from UofIdaho METDATA. This and all figures are made using ArcGIS 10.3...58 Figure 3.2. Projected USDA plant hardiness zones for the years 2020 – 2039 under RCP 8.5. These zones are recreated using the MACA statistical downscaling method from UofIdaho METDATA. ...58 Figure 4.1. Eastern hemlock populations prioritized based on the combination of weighted climatic and genetic parameters. Many populations of highest priority are not yet infested by hemlock woolly adelgid. Highest priority areas also see relatively low sampling density...59 Figure 4.2. Carolina hemlock populations prioritized based on the combination of weighted climatic and genetic parameters. Many populations of highest priority are currently infested by hemlock woolly adelgid. Highest priority areas have the highest sampling density and are centrally located in the main-body range. ...59 Figure 5.1. Interpolation of inbreeding results across the eastern hemlock range shows high levels of inbreeding across the range with added emphasis given to the few areas with comparatively low levels. According to the sensitivity analysis, this parameter has the

(10)

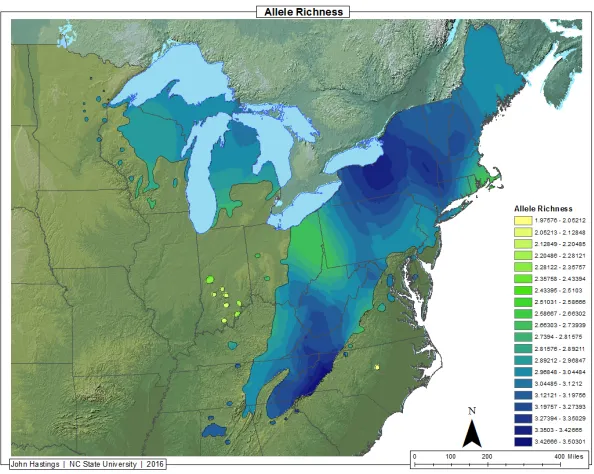
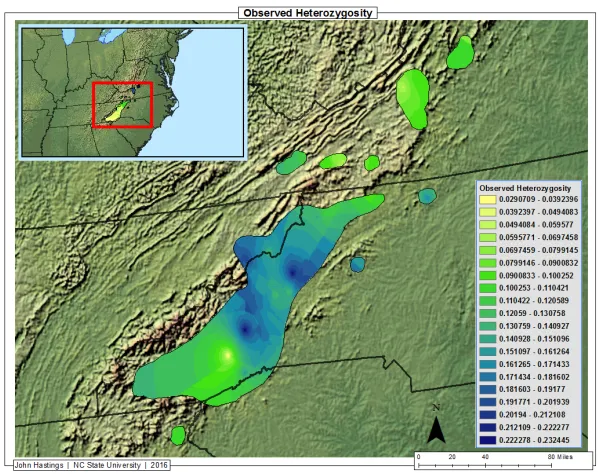
Figure 6.1. Percentage of polymorphic loci per sampled populations across the native range of eastern hemlock shows high percentages range-wide. This parameter does as much to reduce the priority of lower percentages than to prioritize populations...61 Figure 6.2. Percentage of polymorphic loci per sampled populations across the native range of Carolina hemlock shows high percentages range-wide with a cluster of high percentages in the central sector...61 Figure 7.1. Interpolation of allelic richness across the native eastern hemlock range show the highest levels in the southern sector, specifically east of the Appalachian Mountains. Also noteworthy are three sampling locations in New York with high allelic richness...62 Figure 7.2. Interpolation of allelic richness across the native Carolina hemlock range shows the highest levels in the central sector, specifically east of the Appalachian Mountains...62 Figure 8.1. Observed heterozygosity across the native range of eastern hemlock gives

(11)

Figure 11.2. The sensitivity analysis omitting the inbreeding parameter in Carolina hemlock shows comparatively high values across the main range, especially in the southern sector. This parameter is deemed to be the most impactful on the model...69 Figure 12.1. The sensitivity analysis omitting percent polymorphism shows low impact across the range of eastern hemlock, meaning the model is not as sensitive to percent polymorphism as other parameters including minimum temperature difference and

inbreeding...70 Figure 12.2. The sensitivity analysis omitting percent polymorphism shows low impact across the range of Carolina hemlock, meaning the model is not as sensitive to percent polymorphism as other parameters including minimum temperature difference and

inbreeding...70 Figure 13.1. The sensitivity analysis omitting allele richness shows low impact across the range of eastern hemlock, meaning the model is not as sensitive to allele richness as other parameters including minimum temperature difference and inbreeding...71 Figure 13.2. The sensitivity analysis omitting allelic richness in the Carolina hemlock

analysis shows a higher impact on the model than percent polymorphism and observed heterozygosity but less of an impact then inbreeding or minimum temperature difference....71 Figure 14.1. The sensitivity analysis omitting observed heterozygosity shows low levels of impact compared to minimum temperature difference and inbreeding but higher impact than allele richness or percent polymorphism...72 Figure 14.2. The sensitivity analysis omitting observed heterozygosity shows low impact across the range of Carolina hemlock, meaning the model is not as sensitive to observed heterozygosity as other parameters including minimum temperature difference and

(12)

Using Climate and Genetic Diversity Data to Prioritize Conservation Seed

(13)

CHAPTER 1

A Literature Review of Eastern and Carolina Hemlock as well as the Hemlock Woolly

Adelgid and its Ability to Tolerate Low Temperatures

Eastern Hemlock Distribution and Habitat

Eastern hemlock (Tsuga canadensis [L.] Carr.) is a slow-growing coniferous tree species endemic to the eastern United States that takes 20 – 30 years to reach reproductive maturity (Godman and Lancaster, 1990). Eastern hemlock inhabits a vast range from

northern Georgia and Alabama to southeast Nova Scotia and as far west as eastern Minnesota (Figure 1.1). Additionally, there are several smaller disjunct populations to the east and west of the main range. Eastern hemlock is one of the most shade tolerant tree species, requiring only 5% sunlight for survival. Though not preferring them, some individuals are capable of tolerating such conditions for roughly 400 years (Godman and Lancaster, 1990). Eastern hemlock thrives in cool, humid climates and has shown mid-canopy dominance in forests from near sea level to 1500 meters (Farjon, 2013). Because relatively few large tree species prefer these ecological conditions and because of characteristics of the tree itself, stands of eastern hemlock create a unique microclimate that plays host to ninety-six bird and forty-seven mammal species in New England alone. Eight of these bird species and ten mammal species exhibit strong association with hemlock habitat (Yamasaki et al. 1999).

(14)

(Tsuga caroliniana Engelm.) have been in rapid decline since the introduction of an invasive forest insect called the hemlock woolly adelgid (Adelges tsugae Annand), and both are now listed under the “Near Threatened” category of the IUCN Red List of Threatened Species (Farjon, 2013).

Carolina Hemlock Distribution and Habitat

Carolina hemlock prefers small isolated pockets typically located on mountain bluffs and dry ridges through North Carolina, South Carolina, Georgia, Tennessee, and Virginia (Humphrey et al. 1989; Rentch et al. 2000; Jetton et al. 2008). Carolina hemlock’s range is entirely encompassed by that of eastern hemlock; however, Carolina hemlock is more closely related to the Asian hemlock species and does not exhibit natural hybridization with eastern hemlock (Havill et al. 2008; Campbell, 2014). One explanation of the biological differences and overlapping geographic range of eastern and Carolina hemlock suggests that Carolina hemlock evolved and migrated into the region millions of years before eastern hemlock and all that remains is a relic of a once more widely populous species (LePage, 2003; Jetton et al. 2008). The current expanse may be determined by high summertime temperatures of more southern latitudes, frequency of fire and precipitation events, and the presence of rocky outcrops upon which Carolina hemlock may be able to outcompete other species (Jetton et al. 2008).

(15)

slow rates of nitrogen cycling (Galatowitsch, 2009). The removal of hemlock from the landscape in some areas has already resulted in forest structure homogenization and will likely have widespread effects on hydrological patterns and the distributions of dependent plant and animal populations (Ellison et al. 2005).

Hemlock Woolly Adelgid Lifecycle

Hemlock woolly adelgid (HWA) is a piercing-sucking aphid-like insect, which can kill hemlock trees in as little as 2 – 4 years (McClure et al. 2003). HWA was introduced from Japan to the eastern United States, and was first identified in Richmond, Virginia in 1951 (McClure, 1989; Souto et al. 1996). HWA has now infested over 400 counties and 19 states across the native range of eastern hemlock (USFS, 2012) including the entire range of Carolina hemlock.

(16)

the process again (McClure, 1989). Each individual female produces roughly 70 eggs per year and up to 300 eggs per lifetime (McClure 1989; Trotter et al. 2009), making the spread quick and efficient. Furthermore, it is easily transported by humans, bird, deer, and the wind often via manmade landscape corridors (Koch, et al. 2006).

Hemlock Woolly Adelgid Cold Tolerance and Range Limits

The adelgid lifecycle exposes the insect to the most severe period of winter

conditions (Butin et al. 2005). Exposure to extreme cold temperatures causes mortality in the adelgid as shown in several field and laboratory studies (Dukes et al. 2009). As a result, the northward spread of the species may be limited by its ability to survive average annual minimum temperatures below –15 ºC to – 30 ºC. Additionally, geographic location and the time of year that threshold is reached may play a role in limiting HWA range expansion (Parker et al. 1999).

In an experiment by Hansen et al. (1991) testing the cold-hardiness of HWA populations from Massachusetts, a low percentage of adelgids collected from January to February survived exposure to -25ºC for 24 hours. Populations that were exposed to the same temperature for 24 hours during the month of March saw 100% mortality. This -25ºC

(17)

complete mortality did not occur in January and February suggests that HWA may be able to continue to expand its range into areas with colder winters (Preisser et al. 2014).

Additionally, the survival of some individuals may allow for surviving cold-tolerant genotypes to be favored through natural selection.

Skinner et al. (2003) found that adelgid populations from the far northern reaches of the range had developed greater tolerances to cold shock than southern populations. Butin et al. (2005) reinforced this conclusion further with laboratory tests indicating that

cold-tolerance in the HWA has evolved adaptively in just over 100 generations.

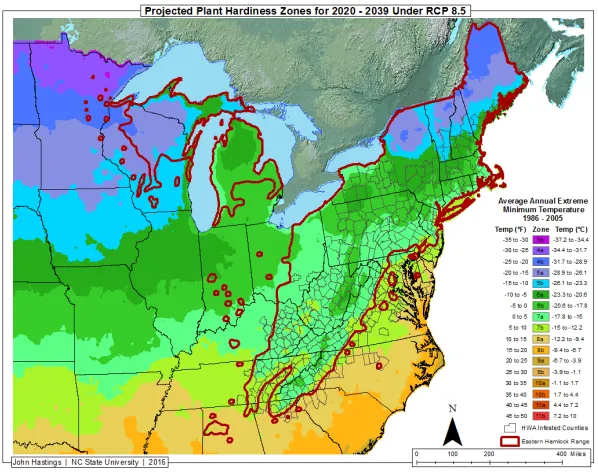
United States Department of Agriculture plant hardiness zone maps are typically referenced to compare experimental data on HWA mortality to climatic conditions within a region. As evident in Figure 3.1, HWA is already established in zones 5a and 5b, and experimental results suggest survival may be possible in zone 4b and potentially zone 4a. Survival in zone 3 seems unlikely (Costa et al. 2004). However, using plant hardiness zones alone does not take into account the effects of duration and timing of cold exposure, changes in food availability, or HWA adaptive capacity. There is likely some combination of these factors at play but deciding which ones, and how they interact, may be extremely

challenging. Minimum temperature data may aid in predicting geographical range limits of HWA, but it does not account for microclimate impacts on the species. For example, Costa et al. (2004) found that daily maximum temperature was typically higher in the hemlock

(18)

Additionally, in a study of adelgid sistens mortality during the winter of 2013 – 2014, McAvoy et al. (2015) found that in the coldest area of the study, the Northern Catskill

Mountains (-31ºC), HWA mortality was only 82% where in many areas further south with temperatures near -20ºC the mortality was 100%. McAvoy et al. (2015) attributed this to higher adapted cold tolerance in the more northern reaches of the range.

Paradis et al. (2008) estimated the amount of overwintering mortality necessary to keep the adelgid population from expanding to be 91%, requiring a mean winter temperature of −5°C, an absolute minimum winter temperature of −35°C, or a period when there are at least 79 days in which the average daily minimum temperature is below −10°C. Using three general circulation models (GCMs) NOAA/GFDL CM2.1, UKMO HadCM3, and

DOE/NCAR PCM, Paradis et al. (2008) projected average winter temperatures warming 1.5– 2°C by 2010–2039. By mid-century, a warming of 2–3°C is expected under the IPCC B2 scenario and a warming of 3–4°C is expected by the end of the century (2070 – 2099). Under the IPCC A1 emissions scenario, a warming of 3-4ºC is expected by mid-century with a 4-6ºC warming by the end of the century. These temperature increase projections may seem minimal but in the northern part of the range, HWA expansion is directly influenced by temperature. Under the high emission scenario, the adelgid is expected to infest the entire northeast region of the eastern hemlock range. Under the low emission scenario, only 50% invasion is expected (Paradis et al. 2008).

(19)

under colder conditions (Gillooly et al. 2001; Clarke and Fraser 2004). This could lead to more consumption of available food under projected climate warming. It could also affect movement and dispersal of HWA in search of food (Bale et al. 2002). Quality of hemlock stands may also play a role in HWA cold-tolerance as HWA populations are more robust and demonstrate a higher rate of reproduction on healthy than on declining trees (McClure, 1991). The consensus view of many studies assessing cold tolerance of HWA is that because of experimental limitations and external factors including genetic adaptation and geographic region, it may be difficult to make conclusions about how long and at what temperature a population of HWA must be exposed to extreme cold to achieve a certain percentage of mortality.

Hemlock Woolly Adelgid Management

(20)

insecticide, imidacloprid requires water solubility to be absorbed by fine roots. This same process could cause groundwater leaching when applied in riparian zones (Cowles 2009). Biological control is currently considered the most promising long-term solution to adelgid management (Cheah et al. 2004). In the first-ever eastern U.S. Laricobius nigrinus Fender predatory beetle field release, an estimated 10,344 eggs were laid and caged on adelgid infested branches (Lamb et al. 2011). Caged branches exhibited lower densities of HWA than branches without L. nigrinus. Other field and laboratory studies conducted in British

Columbia revealed that L. nigrinus possesses qualities considered desirable in successful biological control agents (Huffaker and Kennett 1969; Lamb et al. 2011), demonstrating strong host specificity and a lifecycle that is synchronous with that of HWA. Though

effective at reducing HWA numbers, the beetles take time to become established and must do so with sufficiently large populations. As non-native species to the eastern United States, and because of the distinct climatic differences across the range these insects may not be suitable in every location. Other species such as Laricobius osakensis (Coleoptera: Derodontidae) and

Sasajiscymnus tsugae (Coleoptera: Coccinellidae) may be needed to regionally complement

L. nigrinus in the range-level fight against the adelgid (Campbell, 2014).

Genetic Conservation

(21)

diversity can lead to lowered heterozygosity and more inbreeding. Inbreeding can cause significant problems in small and isolated populations of tree species. It is also associated with genetic drift (Jaramillo-Correa et al. 2009), and this is expected to lessen fitness and adaptive capacity of hemlock to a changing climate (Potter et al. 2012).

Initiated in 2003, a collaborative gene conservation effort between Camcore (international tree breeding and conservation program in the Department of Forestry and Environmental Resources at North Carolina State University) and the United States

Department of Agriculture Forest Service involves the collection of seeds from populations of eastern and Carolina hemlock across their respective ranges for the long-term

establishment of ex situ seed banks. Simple enough in concept, one of the challenges associated with the species of interest is the pace of adelgid spread and the compounding effect of climate (Jetton et al. 2008). Utilizing this approach, some seeds are stored long-term while many are shipped to climatically and ecologically similar regions of the world, which lack the presence of HWA. Camcore seeds are sent to Chile, Brazil, and the Ozark Mountains of Arkansas where they are germinated and planted in genetically diverse seed orchards (Oten et al. 2014). The host-insect relationship between hemlocks and HWA and determining how this differs between resistant and susceptible hemlock genotypes has received much of the research attention thus far (Jetton et al. 2013). That being said, a great deal has been discovered about the genetic makeup of the species and the intricacies of resistance breeding. One of the long-term goals of the program involves breeding locally adapted

(22)

hemlock species from the Pacific Northwest US and Asia, and then backcrossing with the pure species (Jetton and Rhea 2010). A similar approach is currently being implemented with the American chestnut (Castanea dentate (Marsh.) Borkh.). Blight resistance is introduced to American chestnut through a cross with the blight-resistant Chinese chestnut, and American chestnut characteristics are recovered through a series of backcrosses that reduce the Chinese complement of alleles by an average value of one-half per generation (Diskin et al. 2005). The goal of this style of genetic conservation is to maintain high levels of genetic diversity and repopulate locally reduced populations should the need arise (Jetton et al. 2008; Potter et al. 2010; Jetton et al. 2013).

Distribution of Genetic Variation in Hemlock

One of the earliest studies of eastern hemlock genetic diversity by Zabinski (1992) used starch gel electrophoresis of needle tissue enzymes to conclude that the species exhibited low levels of heterozygosity, few unique alleles per population, and low differentiation. Additionally, of the populations studied, the smaller and more isolated populations contained more genetic diversity than those of the main body.

(23)

identify areas of high and low genetic variation in southeastern populations, assess regional differences to better understand the recent evolutionary history of the species, and compare genetic variation in populations currently threatened by HWA with those outside of HWA’s current range. Compared to the Zabinski (1992) study, Potter et al. (2008) found considerably higher levels of polymorphism, heterozygosity, and allelic richness in the Southeast, leading to the conclusion that the species, and much of its genetic diversity, weathered the last glacial maxima in the region, with a particular focus on the eastern side of the Appalachian

Mountains.

Lemieux et al. (2011) used chloroplast DNA (cpDNA) markers on 60 sampled eastern hemlock populations across the full native range. The study found low

differentiation among range-wide cpDNA markers but higher cpDNA differentiation and more distinct genetic diversity among southeastern populations, further backing the glacial refugia conclusion drawn by Potter et al. (2008).

(24)

suggests that the species was confined to three or four separate glacial refuges across the range and may have repopulated its current range from the refuges located in the vicinity of the Southern Appalachian Mountains. This made southern populations genetically distinct, while the fossil-pollen records (Williams et al. 2004) exhibit higher abundance in the northeastern part of the range, possibly the result of a strong repopulation event. Several of the disjunct populations studied were more genetically distinct than main-body populations, though generally less diverse. Furthermore, they may be necessary to conserve rare alleles and the most as risk in a changing climate, making them critically important in conservation efforts (Potter et al. 2012).

Potter et al. (2008, 2012) and Lemieux et al. (2011) both concluded that the refugial southern populations are of critical conservation importance for long-term collections of genetic diversity. Lemieux et al. (2011) also stressed the need for greater ex situ collection in the southern part of the range to preserve the richer genetic structure found in the region, especially with the impacts of climate change already being felt. Although different genetic diversity assessment techniques were used for each of the previous studies, all three

concluded that eastern hemlock has relatively low genetic diversity compared to other conifers.

(25)

populations which had the highest genetic diversity were contained in the southern and eastern parts of the range. The Potter et al. (2010) project set up a more recent Carolina hemlock gene conservation study by Campbell (2014). The study used microsatellite markers to assess genetic diversity of 29 populations across the range, making it the most

comprehensive genetic diversity study of Carolina hemlock to date. The study found high levels of inbreeding across all populations and generally lower than expected genetic diversity range-wide. As similarly observed by Potter et al. (2012) for eastern hemlock, Carolina hemlock exhibited genetic clustering. Possibly representative of glacial refugia, these clusters were located in the northern, southern, and southeast parts of the range (Campbell, 2014). High levels of inbreeding showcased by the comprehensive nuclear microsatellite marker studies of Potter et al. (2012) and Campbell (2014) further demonstrate the need for critical and immediate action to preserve the most genetically diverse

populations of both species.

Climate Change Modeling

Forest ecosystems carry a higher inherent risk in a changing climate as they lack the ability to readily move. Forest pests are a useful indicator of a changing climate as they respond in some fashion to the changes and are likely to have some impact on their host as a result of the response (Galatowitsch et al. 2009). Forest pests also respond to changing climate more or less immediately, or at least orders of magnitude faster than the

(26)

important in the case of the HWA because of the slow pace at which eastern and Carolina hemlocks grow and reach reproductive maturity. Projected rates of climate change are also expected to accelerate –so much so that in situ genetic adaptation of most tree populations to new climate conditions is unlikely (Jump and Penuelas, 2005; Heller and Zavaleta, 2009), nor is migration likely to be fast enough for many species (Davis and Shaw, 2001; Heller and Zavaleta, 2009). As a result, predicting climate change becomes increasingly difficult and increasingly important.

Derived from global climate models, climate change predictions carry varying levels of uncertainty when assessing the ecological response to the anticipated changes (Peterson et al. 2003; Brooke 2008; Galatowitsch, 2009). Evaluating climate change requires some

representation of the future climate and a myriad of general circulation models and emissions scenarios have been developed as a result. The usefulness of GCMs is limited, however, because the finest spatial resolutions used in GCMs are far too coarse for ecological process modeling of most forest species. The most promising solution for this problem is analysis via modeling, downscaling, and interpolation techniques that project GCM predictions to

ecologically meaningful spatial and temporal scales (Logan 2016), most often at the regional level.

(27)

1961–1990 (Dukes et al. 2009). Also according to Hayhoe et al. (2006) model estimates, temperatures across the region have warmed 0.25ºC per decade since 1970.

Galatowitsch et al. (2009) developed climate projections for Minnesota using downscaled climate projections derived from the World Climate Research Programme’s Coupled Model Intercomparison Project phase 3 (CMIP3) multi-model dataset. These simulations utilize GCMs produced for the Intergovernmental Panel on Climate Change (IPCC) Fourth Assessment Report (AR4), and are downscaled using bias-correction to eliminate discrepancies between the GCMs and historical observations. Interpolation was then used to merge coarse-resolution GCM values with observed spatial patterns at a finer resolution. This modeling technique produces a 16-model mean of changes in annual and summer temperature and precipitation for two time periods, 2030–2039, and 2060–2069, relative to a baseline period (1970– 1999), for the upper level emissions scenario. The

resulting average annual temperature and precipitation by 2069 suggest a shift in Minnesota’s regional climates equivalent to current conditions approximately 400–500 km

south-southwest. Average annual and summer temperatures are projected to increase 3ºC. Average annual precipitation is predicted to increase slightly (4.8–7.8%) over this interval, although average summer precipitation is expected to decrease up to 4%.

(28)

dominant component of forests in northern New England, the impact of HWA spread is likely to be even more severe than in the south (Paradis et al. 2008). Mean and minimum temperature data, such as were used here, are useful in making broad-scale projections about future potential ranges of species. However, different aspects of winter severity may be responsible for overwintering mortality in different years (Stenseth and Mysterud, 2005).

Multi-Criteria Evaluation using GIS

(29)

weighted linear combination, uses a numeric range to standardize attributes and then combine them using a user-defined weight for each (Jiang and Eastman 1999). The total score for each alternative is obtained by multiplying the importance weight assigned to each attribute by the standardized value for that attribute and then summing the products (Drobne and Lisec 2009).

The accepted approach to the weighted linear combination method is commonly broken down into a six-step process (Malczewski 2000): (1) Define the set of attribute map layers. Attributes represent a measure of performance regarding the objective. (2) Define feasible alternatives. An alternative is feasible if all attributes meet a user-defined constraint threshold. These thresholds are set by establishing exclusionary screening or target

constraints. Exclusionary screening requires the attributes to fall within a certain category. For example, a suitable habitat must fall within a specified land-use type. Target constraints must reach a target value; for example, suitable habitat requires a total value of 80% out of 100% when all attributes are combined. (3) Establish a common scale across all attributes. (4) Assign attribute weights. (5) Combine attribute maps and weighting via overlay

techniques, while considering preference independence. (6) Rank output alternatives by overall score.

(30)

informed judgment call. Therefore, sensitivity analysis is crucial to the validation of multi-criteria evaluation. Sensitivity analysis studies how the variation in the model output can be attributed to different sources, and how the given model depends upon the information fed into it (Crosetto et al. 1999). It is often used to check the robustness of the final outcome via slight changes in the input data (Chen et al. 2010). In sensitivity analysis a common approach is to change input factors one at a time. By changing one factor at a time, any change

observed in the output will unambiguously be due to the single factor changed. This increases the comparability of the results.

Project Objectives

Carolina hemlock is adapted to a high number of soil types and has moderate genetic diversity (Jetton et al. 2008). However, it has high levels of inbreeding (Campbell, 2014) and has been identified as a tree species most at risk in a changing climate (Erickson et al. 2012). These factors coupled with its small range makes collecting genetic diversity from a high number of populations both feasible and imperative.

Limited prior sampling in northeastern and northwestern parts of the eastern hemlock range, complemented by high allelic richness and genetically distinct disjunct populations to the east and west of the main range highlight genetic parameters of interest for population prioritization. Climate is also of consideration for eastern hemlock because the species spans a large altitudinal gradient and a variety of latitudes.

(31)
(32)

REFERENCES

Bale, J. S., Masters, G. J., Hodkinson, I. D., Awmack, C., Bezemer, T. M., Brown, V. K., … Whittaker, J. B. (2002). Herbivory in global climate change research: Direct effects of rising temperature on insect herbivores. Global Change Biology, 8(1), 1–16.

doi:10.1046/j.1365-2486.2002.00451.x

Baust, J. G., & Rojas, R. R. (1985). Review—Insect cold hardiness: Facts and fancy. Journal of Insect Physiology, 31(10), 755–759. doi:10.1016/0022-1910(85)90067-8

Brooke, C. (2008). Conservation and adaptation to climate change. Conservation Biology,

22(6), 1471–1476. doi:10.1111/j.1523-1739.2008.01031.x

Butin, E., Porter, A. H., & Elkinton, J. (2005). Adaptation during biological invasions and the case of Adelges tsugae. Evolutionary Ecology Research, 1–28.

Campbell, Angelia Rose. (2014). Assessing Carolina hemlock (Tsuga caroliniana Engelm.) population genetic structure and diversity in the southern Appalachians using

microsatellite markers. Manuscript 1-83.

Carver, S. J. (1991). Integrating multi-criteria evaluation with geographical

informationsystems. International Journal of Geographical Information Systems, 5(3), 321–339. doi:10.1080/02693799108927858

Cheah, C., M. E. Montgomery, S. Salom, B. L. Parker, S. Costa, and M. Skinner. (2004). Biological control of hemlock woolly adelgid. USDA Forest Service, FHTET-2004-04. Morgantown, WV. FHTET Technology Transer Series

Chen, Y., Yu, J., & Khan, S. (2010). Spatial sensitivity analysis of multi-criteria weights in GIS-based land suitability evaluation. Environmental Modelling and Software, 25(12), 1582–1591. doi:10.1016/j.envsoft.2010.06.001

Clarke, A., & Fraser, K. P. P. (2004). Why does metabolism scale with temperature?

Functional Ecology 2004 18: 243–251. doi:10.1111/j.0269-8463.2004.00841.x Costa, S. D., Skinner, M., & Parker, B. L. (2004). HWA cold-hardiness: Towards defining

(33)

Cowles, R. S. (2009). Optimizing dosage and preventing leaching of imidacloprid for management of hemlock woolly adelgid in forests. Forest Ecology and Management,

257(3), 1026–1033. doi:10.1016/j.foreco.2008.11.005

Cowles, R. S., and C. A. S. J. Cheah. (2002) Foliar sprays for control of hemlock woolly adelgid, 2001. Arthropod Management Tests 27.1 G48.

Crosetto, M., Tarantola, S., & Saltelli, A. (2000). Sensitivity and uncertainty analysis in spatial modelling based on GIS. Agriculture, Ecosystems & Environment, 81(1), 71–79. doi:10.1016/S0167-8809(00)00169-9

Davis, M. B., Shaw, R. G., & Peng, T. (2001). Range shifts and adaptive responses to quaternary climate change. Science, 292(5517), 673–679.

Diskin, M., Steiner, K. C., & Hebard, F. V. (2006). Recovery of American chestnut

characteristics following hybridization and backcross breeding to restore blight-ravaged

Castanea dentata. Forest Ecology and Management, 223(1-3), 439–447. doi:10.1016/j.foreco.2005.12.022

Drobne, S., & Lisec, A. (2009). Multi-attribute decision analysis in GIS: Weighted linear combination and ordered weighted averaging. Informatica, 33, 459–474.

Dukes, J. S., Pontius, J., Orwig, D., Garnas, J. R., Rodgers, V. L., Brazee, N., … Ayres, M. (2009). Responses of insect pests, pathogens, and invasive plant species to climate change in the forests of northeastern North America: What can we predict? This article is one of a selection of papers from NE Forests 2100: A Synthesis of Climate Change Impacts o. Canadian Journal of Forest Research, 39, 231–248. doi:10.1139/X08-171 Ellison, A. M., Bank, M. S., Clinton, B. D., Colburn, E. A., Ford, C. R., Foster, D. R., …

Webster, J. R. (2005). Loss of foundation species: Consequences for the structure and dynamics of forested ecosystems source. Frontiers in Ecology and the Environment 3, No. 9 pp. 479-486

Erickson, V., Aubry, C., Berrang, P., Blush, T., Bower, A., Crane, B., ... & Johnson, R. (2012). Genetic resource management and climate change: Genetic options for adapting national forests to climate change. USDA Forest Service, Forest Management,

Washington, DC, 19.

(34)

Galatowitsch, S., Frelich, L. E., & Phillips-Mao, L. (2009). Regional climate change adaptation strategies for biodiversity conservation in a midcontinental region of North America. Biological Conservation, 142(2009), 2012–2022.

doi:10.1016/j.biocon.2009.03.030

Gillooly, J. F., Brown, J. H., West, G. B., Savage, V. M., & Charnov, E. L. (2001). Effects of size and temperature on metabolic rate. Science, 293(5538), 2248–2251.

doi:10.1126/science.1061967

Godman, R. M., K. Lancaster. (1990). Eastern hemlock. Silvics of North America, USFS Handbook 654 1: 1018–1051.

Hansen, R. W. (1991). Cold-hardiness in the hemlock woolly adelgid. Final rep. USDA-APHIS, Otis Methods Development Center, Otis ANGB, MA.

Havill, N. P., & Foottit, R. G. (2007). Biology and evolution of Adelgidae. Annual Review of Entomology, 52, 325–349. doi:10.1146/annurev.ento.52.110405.091303

Hayhoe, K., Wake, C. P., Huntington, T. G., Luo, L., Schwartz, M. D., Sheffield, J., … Wolfe, D. (2007). Past and future changes in climate and hydrological indicators in the US Northeast. Climate Dynamics, 28(4), 381–407. doi:10.1007/s00382-006-0187-8 Heller, N., & Zavaleta, E. S. (2009). Biodiversity management in the face of climate change:

A review of 22 years of recommendations. Biological Conservation, 142, 14–32. doi:10.1016/j.biocon.2008.10.006

Huffaker, C. B., & Kennett, C. E. (1969). Some aspects of assessing efficiency of natural enemies. The Canadian Entomologist, 101, 425–447.

Humphrey, D. L. (1989). Life history traits of Tsuga caroliniana Engelm. (Carolina hemlock) and its role in community dynamics. Castanea 54: 172-190.

Jankowski, P. (1995) Integrating geographical information systems and multiple criteria decision-making methods. International Journal of Geographical Information Systems

9.3: 251–273.

Jaramillo-Correa, J. P., Beaulieu, J., Khasa, D. P., & Bousquet, J. (2009). Inferring the past from the present phylogeographic structure of North American forest trees: seeing the forest for the genes. Canadian Journal of Forest Research, 39(2), 286–307.

(35)

Jenkins, J. C., Aber, J. D., & Canham, C. D. (1999). Hemlock woolly adelgid impacts on community structure and N cycling rates in eastern hemlock forests. Canadian Journal of Forest Research, 29, 630–645. doi:10.1139/x99-034

Jetton, R. M., Dvorak, W. S., & Whittier, W. A. (2008). Ecological and genetic factors that define the natural distribution of Carolina hemlock in the southeastern United States and their role in ex situ conservation. Forest Ecology and Management, 255(8-9), 3212– 3221. doi:10.1016/j.foreco.2008.01.032

Jetton, R. M., Rhea, J. R. (2010). Framework for genetic conservation of eastern (Tsuga canadensis) and Carolina (T. caroliniana) hemlock. Proceedings of the Fifth Symposium on Hemlock Woolly Adelgid in the Eastern United States. 1-19

Jetton, R. M., Whittier, W. A., Dvorak, W. S., & Rhea, J. R. (2013). Conserved ex situ

genetic resources of eastern and Carolina hemlock: eastern North American conifers threatened by the hemlock woolly adelgid. Tree Planters’ Notes 70: 59–71.

Jiang, H., & Eastman, J. R. (2000). Application of fuzzy measures in multi-criteria evaluation in GIS. International Journal of Geographical Information Science, 14(2), 173–184. doi:10.1080/136588100240903

Jump, A. S., & Penuelas, J. (2005). Running to stand still: Adaptation and the response of plants to rapid climate change. Ecology Letters, 8(9), 1010–1020. doi:10.1111/j.1461-0248.2005.00796.x

Koch, F. H., Cheshire, H. M., & Devine, H. A. (2006). Landscape-scale prediction of hemlock woolly adelgid, Adelges tsugae (Homoptera: Adelgidae), infestation in the southern Appalachian Mountains. Environmental Entomology, 35(5), 1313–1323. doi:10.1603/0046-225X(2006)35[1313:LPOHWA]2.0.CO;2

Lamb, A. B., Salom, S. M., Kok, L. T., & Mausel, D. L. (2006). Confined field release of

Laricobius nigrinus (Coleoptera: Derodontidae), a predator of the hemlock woolly adelgid, Adelges tsugae (Hemiptera: Adelgidae), in Virginia. Canadian Journal of Forest Research, 36(2), 369–375. doi:10.1139/x05-190

Lemieux, M. J., Beaulieu, J., & Bousquet, J. (2011). Chloroplast DNA polymorphisms in eastern hemlock: Range-wide genogeographic analyses and implications for gene conservation. Canadian Journal of Forest Research, 41(5), 1047–1059.

(36)

LePage, B. A. (2003). A new species of tsuga (Pinaceae) from the middle eocene of axel Heiberg Island, Canada, and an assessment of the evolution and biogeographical history of the genus. Bot. J. Linn. Soc. 141, 257–296.

Logan, J. A., Régnière, J., Powell, J. A., Frontiers, S., Apr, N., & Logan, J. A. (2016). Assessing the impacts of global warming on forest pest dynamics. Ecological Society of America. 1(3), 130–137.

Malczewski, J. (2000). On the use of weighted linear combination method in GIS: Common and best practice approaches. Transactions in GIS, 4(1), 5–22. doi:10.1111/1467-9671.00035

McAvoy, T. J., E. A. Roberts, N. G. Johnson, T. McCoy, N. F. Schneeberger, and S. M Salom. (2015). Hemlock woolly adelgid sistens mortality during the winter of 2013 – 2014 and progrediens recovery. Report for Hemlock Woolly Adelgid Researchers and Managers in the Eastern U.S.

McClure, M. S. (1983). Population dynamics of a pernicious parasite: Density-dependent vitality of red pine scale. Ecology64: 710-718.

McClure, M. S. (1989). Evidence of a polymorphic life cycle in the hemlock woolly adelgid

Adelges tsugae (Homoptera: Adelgidae). Annals of the Entomological Society of America 82: 50–54.

McClure, M. S. (1991). Density-dependent feedback and population cycles in Adelges tsugae

(Homoptera: Adelgidae). Environmental Entomology: 36-43.

McClure, M. S., Salom, S. M., Shields, K. S. (2003). Hemlock woolly adelgid. USDA Forest Service, Morgantown, WV, 14 p., FHTET-2001–03.

Montgomery, M. E., Bentz, S. E., & Olsen, R. T. (2009). Evaluation of hemlock (Tsuga) species and hybrids for resistance to Adelges tsugae (Hemiptera: Adelgidae) using artificial infestation. Journal of Economic Entomology, 102(3), 1247–1254. doi:10.1603/029.102.0351

Oten, K. L. F., Merkle, S. A., Jetton, R. M., Smith, B. C., Talley, M. E., & Hain, F. P. (2014). Understanding and developing resistance in hemlocks to the hemlock woolly adelgid.

(37)

Paradis, A., Elkinton, J., Hayhoe, K., & Buonaccorsi, J. (2008). Role of winter temperature and climate change on the survival and future range expansion of the hemlock woolly adelgid (Adelges tsugae) in eastern North America. Mitigation and Adaptation

Strategies for Global Change, 13(5-6), 541–554. doi:10.1007/s11027-007-9127-0 Parker, B. L., M. Skinner, S. Gouli, T.Ashikaga and H. B. Teillon. (1999). Low lethal

temperature for hemlock woolly adelgid (Homoptera: Adelgidae). Environmental Entomology 28 1085-1091.

Parshall T. (2002). Late holocene stand-scale invasion by hemlock (Tsuga canadensis) at its western range limit. Ecology83:1386–1398

Peterson, G. D., Cumming, G. S., & Carpenter, S. R. (2003). Scenario planning: A tool for conservation in an uncertain world. Essay 358 Conservation Biology Conservation Biology, 17(2), 358–366. doi:10.1046/j.1523-1739.2003.01491.x

Potter, K., Dvorak, W., Crane, B., Hipkins, V., Jetton, R., Whittier, W., & Rhea, R. (2008). Allozyme variation and recent evolutionary history of eastern hemlock (Tsuga

canadensis) in the southeastern United States. New Forests, 35(2), 131–145. doi:10.1007/s11056-007-9067-2

Potter, K. M., Jetton, R. M., Dvorak, W. S., Frampton, J., Rhea, J. R. (2010). Ex situ seed collections represents genetic variation in natural stands of Carolina hemlock.

Proceedings of the Fifth Symposium on Hemlock Woolly Adelgid in the Eastern United States.

Potter, K. M., Jetton, R. M., Rhea, R., & Whittier, W. A. (2012). Widespread inbreeding and unexpected geographic patterns of genetic variation in eastern hemlock (Tsuga

canadensis), an imperiled North American conifer, Conservation Genetics 475–498. doi:10.1007/s10592-011-0301-2

Preisser, E. L., Oten, K. L. F., & Hain, F. P. (2014). Hemlock woolly adelgid in the eastern United States: What have we learned? Forest Impacts and Ecosystem Effects of the Hemlock Woolly Adelgid in the Eastern US Southeastern Naturalist 13(Special Issue 6):1–15.

Rentch, J. S., Adams, H. S., Coxe, R. B., & Stephenson, S. L. (2011). An ecological study of a Carolina hemlock (Tsuga caroliniana) community in southwestern Virginia.

(38)

Salom, S. M., Sharov, A. a., Mays, W. T., & Neal, J. W. (2001). Evaluation of aestival diapause in hemlock woolly adelgid (Homoptera: Adelgidae). Environmental Entomology, 30, 877–882. doi:10.1603/0046-225X-30.5.877

Sato, S. (1999). Galls on tigertail spruce made by Aphrastasia tsugae at Mt. Tsurugi. Gensei

73: 1–26.

Skinner, M., Parker, B. L., Gouli, S., & Ashikaga, T. (2003). Regional responses of hemlock woolly adelgid (Homoptera: Adelgidae) to low temperatures. Environmental

Entomology, 32(3), 523–528. doi:10.1603/0046-225X-32.3.523

Souto, D., T. Luther, and B. Chianese. (1996). Past and current status of hemlock woolly adelgid in eastern and Carolina hemlock stands. In S.M. Salom, T. Tigner, and R. Reardon (Eds.). First Hemlock Woolly Adelgid Review. US Forest Service, Morgantown, WV. 9–15. Print.

Stenseth, N. C., & Mysterud, A. (2005). Weather packages: Finding the right scale and composition of climate in ecology. Journal of Animal Ecology, 74(6), 1195–1198. doi:10.1111/j.1365-2656.2005.01005.x

Store, R., & Kangas, J. (2001). Integrating spatial multi-criteria evaluation and expert

knowledge for GIS-based habitat suitability modelling. Landscape and Urban Planning,

55(2), 79–93. doi:10.1016/S0169-2046(01)00120-7

Trotter, R. T., & Shields, K. S. (2009). Variation in winter survival of the invasive hemlock woolly adelgid (Hemiptera: Adelgidae) across the eastern United States. Environmental Entomology, 38, 577–587. doi:10.1603/022.038.0309

US Department of Agriculture Forest Service. (2012) Forest health protection: Hemlock woolly adelgid distribution map. Forest Health Protection Service, Newtown Square PA.

Ward, J. S., Montgomery, M. E., Cheah, C. a. S.-J., Onken, B. P., & Cowles, R. S. (2004). Eastern hemlock forests: Guidelines to minimize the impacts of hemlock woolly adelgid. NA-TP-03–04, USDA Forest Service, Northeastern Area State and Private Forestry, Morgantown, WV, 32.

(39)

Yamasaki, M., DeGraaf, R. M., & Lanier, J. W. (1999). Wildlife habitat associations in eastern hemlock-birds, smaller mammals, and forest carnivores. Proceedings: Symposium on Sustainable Management of Hemlock Ecosystems in Eastern North America. Edited by KA McManus, KS Shields, and DR Souto. USDA Forest Service, Newtown Square, Pa, pp, 135–143.

(40)

Chapter 2

Using Climate and Genetic Diversity Data to Prioritize Conservation Seed Banking for

Imperiled Hemlock Species

Abstract

(41)

HWA mortality occurs. The genetic diversity parameters are then weighted and combined with the minimum temperature threshold.

The result is a spatially weighted index giving the most priority to eastern hemlock populations in Maine, central New York, and southwest Vermont. Additionally, disjunct but genetically distinct populations in Wisconsin should also be considered for genetic diversity sampling. Regarding Carolina hemlock, central main-body and disjunct northern populations receive the highest prioritization and should receive consideration. Low sampling density, especially in the case of eastern hemlock has a profound effect on interpolating the genetic diversity parameters. Under low density sampling condition, more of the interpolated area requires estimation. When sampling density is higher less estimation is required making the interpolated surface more representative of the true nature of the samples.

INTRODUCTION

(42)

canopies from northern Georgia and Alabama in the South, to Nova Scotia in the north. It is also a canopy-dominant species in parts of its range. The main body of the range also extends as far west as Minnesota (Figure 1.2). Both species are shade tolerant and long-lived providing a thick duff layer, dense shade, slow rates of nitrogen cycling, and a habitat suitable for many plant and animal communities (Galatowitsch, 2009).

Eastern and Carolina hemlock have been experiencing extensive mortality since the introduction of an aphid-like insect called the hemlock woolly adelgid (Adelges tsugae

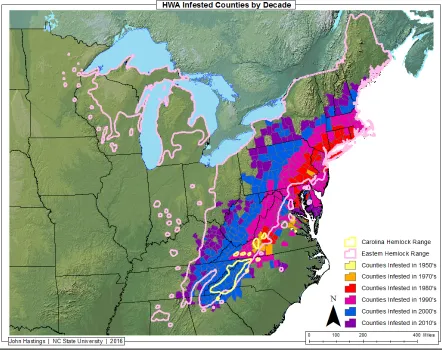
Annand) (HWA). This highly invasive forest pest was first introduced from Japan in 1951 through Richmond, Virginia (McClure, 1989; Souto et al. 1996). Since its introduction HWA has spread to over 400 counties across 19 states, including much of the U.S. range of eastern hemlock and the entirety of Carolina hemlock (Figure 2). HWA is parthenogenetic and individual females can produce over 70 eggs per year. Driven by its parthenogenetic nature and high egg production, it is capable of killing its host in as little as four years (McClure et al. 2003; Jetton et al. 2008). HWA is easily transported by humans, bird, and the wind often via manmade landscape corridors or riparian areas, and crawler generations are active when human recreation and bird migration are likely to be highest (McClure, 1990; Koch, et al. 2006).

Current strategies for adelgid management are expensive, short-lived, or logistically infeasible. The most effective chemical controls against HWA are dinotefuran and

(43)

Cheah 2002). Stem injection wounds the tree but reduces limitations imposed by proximity to water, while soil-application on steep or rocky slopes, along areas near water, or those prone to thunderstorms, could affect aquatic animals due to chemical runoff into streams (Cowles, 2009).

Biological control is currently considered the most promising long-term solution to adelgid management (Cheah et al. 2004). Predatory beetle release has been an effective tactic; for example, on caged branches Laricobius nigrinus has shown significant adelgid reduction (Lamb et al. 2011) and a strong preference for HWA (Zilahi-Balogh et al. 2002). However, rearing, releasing, and establishing biological controls is difficult and time consuming (Cheah et al. 2004; Koch et al. 2006), and with the fast pace of HWA range expansion and hemlock mortality, biological control efforts will very quickly need to become

more successful over larger areas (Vose et al. 2013). Alternatively, a combination of

management techniques including biological and chemical controls, gene conservation, and host-resistance breeding seems essential to long-term sustainability at the species level.

Genetic diversity assessment and gene conservation is a viable and particularly applicable strategy at a time of high HWA-related mortality and short-term management solutions (Oten et al. 2014). Since 2003, Camcore (international tree breeding and

(44)

of Arkansas (Jetton et al. 2013; Oten et al. 2014). The primary concept behind the installation of ex situ seed orchards is the availability for in situ breeding and restoration should the need arise and once successful management techniques are in place (Oten et al. 2014). Similar to that of American chestnut (Castanea dentata (Marsh.) Borkh.), the current hemlock host-resistant breeding methods include hybridizing native hemlock trees with a host-resistant relative from western North America or Asia and then backcrossing with the pure species (Jetton and Rhea 2010). Additionally, locating naturally occurring HWA-resistant eastern and Carolina hemlocks is of critical importance for gene conservation, as it may be possible to breed these individuals with pure species individuals, and exclude genes from non-native hemlocks (Oten et al. 2014).

Hemlock studies performed by Potter et al. (2008) and Potter et al. (2010) promote further genetic diversity studies with mindfulness of climate change and ex situ gene

conservation. These early works also set up more recent eastern hemlock (Potter et al. 2012) and Carolina hemlock (Campbell, 2014) studies, both of which used microsatellite markers to assess genetic diversity for targeting of seed collections across their respective ranges.

Results found across both studies include high levels of inbreeding and low genetic diversity range-wide. Similar to that of eastern hemlock in the study conducted by Potter et al. (2012), Carolina hemlock exhibited genetic clustering that was both distinct and possibly

representative of a glacial refugium (Campbell, 2014).

(45)

eastern hemlock range by average annual minimum temperatures below -15ºC to -30ºC (Parker et al. 1999). Based on NOAA/GFDL CM2.1, UKMO HadCM3, and DOE/NCAR PCM general circulation model (GCM) projections HWA is expected to infest the entire northeastern U.S. region under IPCC A1 emission scenarios by the end of the century. Under IPCC B2 emission scenarios, only 50% invasion is expected by the end of the century

(Paradis, 2008). Previous studies have found certain temperature thresholds may have no impact on HWA survival in January but significant impacts as spring approaches (Costa et al. 2004). Furthermore, historical trends modeled into the future project emissions scenarios on track with the highest output scenarios (Peters et al. 2013). This is troubling as pests respond to changing climate more much more rapidly than the forests—and likely the host species— they inhabit (Logan 2016). Projected rates of climate change are also expected to accelerate – so much so that in situ genetic adaptation of most tree populations to new climate conditions is unlikely (Jump and Penuelas, 2005; Heller and Zavaleta, 2009), nor is migration likely to be fast enough for many species (Davis and Shaw, 2001; Heller and Zavaleta, 2009). Other factors may play a role in adelgid cold tolerance including ambient temperature compared to hemlock microhabitat temperature, adelgid physiology (McClure 1983, Baust and Rojas 1985), rate of consumption of available food (Bale et al. 2002), and quality of hemlock stands (McClure, 1991). Additionally, some HWA populations have shown adapted cold-tolerance in as little as 100 generations (Butin et al. 2005).

(46)

readily move when conditions change. Furthermore, HWA range expansion as a direct result of climate change puts both species at significant risk. If populations can change genetically as a product of sampling and gene conservation, species reduction or extinction due to

climate change could be minimized (Sgro` et al. 2010). Thus, hemlocks capacity to withstand the effects of climate change depends on the conservation of genetic diversity and studies like this to locate populations most at risk in a changing climate and prioritize them for future gene conservation efforts.

In order to better understand how patterns of genetic diversity and future climate conditions can be applied in the prioritization of eastern and Carolina hemlock populations, this study utilizes four genetic diversity metrics—allelic richness, percent of polymorphic loci, observed heterozygosity, and inbreeding (FIS)—from Carolina hemlock genetic diversity data collected by Campbell (2014). The same metrics are taken from 60 eastern hemlock populations across the native US range highlighted in a study by Potter et al. (2012).

(47)

DATA REQUIREMENTS & METHODS

Genetic Diversity Data

Twenty-nine Carolina hemlock populations were sampled throughout the native range by Campbell (2014) during the summer of 2013. Sixteen microsatellite loci were observed for 439 trees, making it the most extensive Carolina hemlock genetic diversity sampling ever performed. Populations with insufficient sampling or populations that were planted have been left out of the spatial analysis as those populations are not useful for the purpose of this project. The remaining data were stored in a shapefile containing 24 point-geometry features. Each feature contains the genetic diversity attributes of a single sampling location.

Sixty eastern hemlock populations were sampled throughout the species’ U.S. range from 2006 - 2009 by Potter et al. (2012). For this study, thirteen microsatellite loci were amplified across 1,180 trees. Populations were designated as northern or southern based on their location relative to the Wisconsinian glaciation event roughly 18,000 years before present (Dyke et al. 2003; Potter et al. 2012). The resulting data were stored in a shapefile containing 60 point-geometry features with genetic diversity attributes. From the Campbell (2014) and Potter et al. (2012) studies, four genetic diversity metrics were selected as significant to future sampling: allelic richness, percent polymorphism, observed

(48)

Minimum Temperature Data

The USDA plant hardiness maps are represented by the average annual extreme minimum temperature for each zone. Thus, the only difference between the two is that plant hardiness is average annual extreme minimum temperature grouped into 5ºC/F increments. For this project, we used the same minimum temperature metric from the University of Idaho Gridded Surface Meteorological Data (UofI METDATA) to evaluate historical climate observations across the eastern and Carolina hemlock range. The UofI METDATA database combines PRISM climate datasets with 4 km gridded regional-scale reanalysis data based on LNDAS-2 daily-gauge readings from 1979 – present. The data are then validated against a nexus of weather stations including RAWS, AgriMet, AgWeatherNet, and USHCN-2 (Abatzoglou, 2012).

The average annual extreme minimum temperature metric was also adopted to project minimum temperature from 2020 – 2039 using the Multivariate Adaptive Constructed

(49)

Additional Data

Underlying base map data were downloaded from the U.S. Geological Survey (USGS) National Map Project small-scale collection website (National Map, 2014). This includes data used to build the underlying elevation and shaded relief layers as well as state and coastal boundaries. Range maps pertaining to eastern and Carolina hemlock came from the USGS Geoscience and Environmental Change Science Center’s Digital Representations of Tree Species Range Maps (Little, 1971). Lastly, a shapefile containing all counties

infested by HWA from its introduction in 1951 through 2014 (Figure 2) was provided by Dr. Frank Koch of the USDA Forest Service Eastern Forest Environmental Threat Assessment Center.

Genetic Diversity Methodology

(50)

neighborhood with a maximum of 6 and a minimum of 3 sampling points was used in conjunction with a 1-sector circle. These neighborhood restrictions were implemented to account for low sampling density. Additionally, a stable semivariogram with 100% error measurement was implemented. All kriging was processed to the extent of the eastern or Carolina hemlock range shapefile. Each of the kriging results was then converted to raster format before being clipped to the U.S. range boundary of eastern or Carolina hemlock.

Minimum Temperature Methodology

Northward HWA expansion is directly influenced by minimum winter temperatures (Paradis et al. 2008). With this in mind, areas with the greatest overall projected warming may be at the greatest risk. This is especially true in the case of eastern hemlock as HWA in the northern part of the range have exhibited higher tolerances to extreme cold than HWA populations in the south (Skinner et al. 2003). Difference in extreme minimum temperature was quantified across 20 GCM projections. Model ensemble averages are typically held in high regard as they maintain greater confidence than individual climate models and limit extreme results for given regions (Galatowitsch et al. 2009).

(51)

plant hardiness zone for RCP 8.5 was calculated by adding the difference map back to the historical minimum temperature observations (Figure 3.2).

Multi-Criteria Evaluation

To limit the population size of the output genetic diversity locations, the datasets are first reclassified from their current range of values to a 1 – 20 scale. A value of 1 is of the lowest priority for genetic diversity or projected temperature difference, where a value of 20 is of highest priority. The five parameters—four genetic diversity parameters and one temperature difference parameter—are each given a 20% influence in the evaluation model, based on expert opinion. The total score for each dataset is obtained by multiplying the influence by the standardized value for that parameter through a multi-criteria evaluation technique called weighted linear combination (Jiang and Eastman 1999). The products are then summarized to receive an overall score range-wide (Drobne and Lisec 2009). It should be noted, the final output keeps the reclassified scale of 1 – 20. In the case of this project, goal is to find the most suitable sites for genetic diversity sampling rather than the exclusion of populations based on low scores.

Sensitivity Analysis

Sensitivity analysis was used to examine how the data fed into the model affect the outcome. Under this method, model sensitivity was detected by changing input factors one at a time. By changing one factor at a time, any change observed in the output will

(52)

was repeated until five maps were made for each species. The final hemlock prioritization map was then subtracted from each one of the maps with omitted parameters. The product is a map for each parameter that when compared, highlights to which parameter the overall model is most sensitive.

RESULTS

Eastern Hemlock

Eastern hemlock priority is given to populations in the northeastern part of the geographic range, specifically, Maine and central New York. Additionally, populations in southwest Vermont and northwest Massachusetts have high priority. Several southern populations exhibit higher priority than surrounding populations, including those in the far southeastern area of the main range, while northwestern populations in the Great Lakes states showed moderate priority. Central Appalachian and disjunct populations exhibited the lowest overall priority (Figure 4.1).

(53)

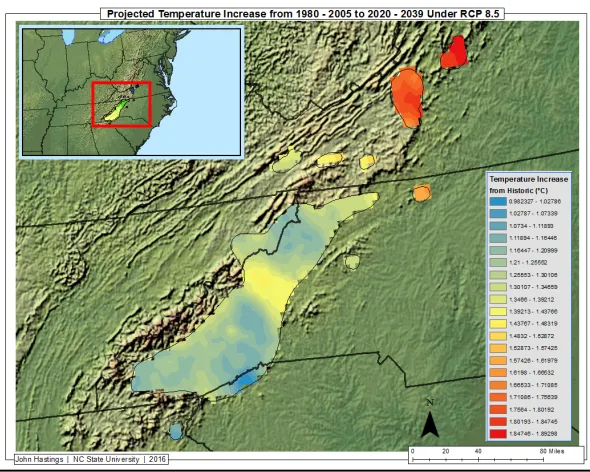
heterozygosity was high in pockets of the south and in parts of the northern range (Figure 8.1), while disjunct populations generally had low heterozygosity. Minimum winter temperature demonstrated a gradient of greater temperature change in the northern reaches and minimal temperature difference in the southern reaches (Figure 9.1). Kriging prediction errors suggest that the inbreeding coefficient parameter was the most successfully

interpolated from the previous sampling locations (Figure 10.1).

Eastern Hemlock Sensitivity Analysis

Results of the sensitivity analysis for the five parameters included in the eastern hemlock prioritization model are reported in Figures 11.1, 12.1, 13.1, 14.1, and 15.1. The difference maps for both eastern and Carolina hemlock show positive and negative changes in the output priority map value when a particular parameter is omitted. Additionally, the same legend was used for all of the sensitivity analysis difference maps for each species. Of the five parameters under consideration, the model was most sensitive to inbreeding, as it generated the highest overall mean output score across all locations both before and after the production of the difference map (Figure 11.1). Noteworthy is that percentage of

(54)

the range. Minimum temperature difference showed the greatest minimum and maximum difference map values and more distinct spatial clustering of high values than any of the other parameters (Figure 15.1), including clustering in the southern region where temperature difference values were significantly lower before the parameter was omitted. This

underscores the important role that temperature change plays in prioritizing northern populations despite the relative high diversity in the southern Appalachian Mountain populations.

Carolina Hemlock

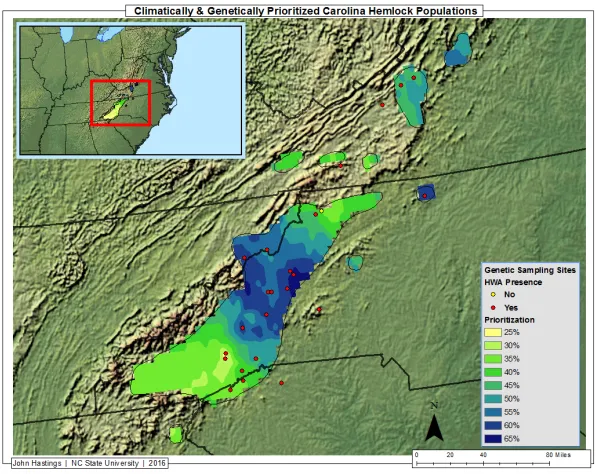
The largest cluster of high prioritization is geographically central to the main-body range for Carolina hemlock. Populations east of the Appalachian Mountains in North Carolina show the highest overall priority, while populations in the northern and southern extend of the main-body range exhibit the lowest priority (Figure 4.2). In agreement with Campbell (2014), several disjunct groups are consistent with a northern-dominant cluster, thus, they have high prioritization and are separated by relatively low priority main-body northern populations. Specifically, disjunct populations in northeastern North Carolina should receive conservation and seed collection consideration.

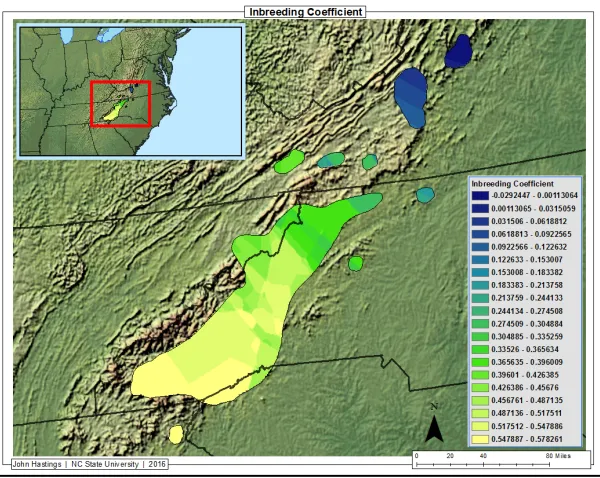
Inbreeding was higher in the southern Carolina hemlock range and exhibited lower levels in northern disjunct populations (Figure 5.2). Percent of polymorphic loci, observed heterozygosity, and allelic richness all expressed high priority in the central main-body range (Figure 6.2, Figure 7.2, and Figure 8.2). As previously mentioned, minimum winter

(55)

and minimal temperature difference in the southern reaches (Figure 9.2). Kriging prediction errors suggest that the observed heterozygosity parameter was the most successfully

interpolated from the previous sampling locations (Figure 10.2).

Carolina Hemlock Sensitivity Analysis

Results of the sensitivity analysis for the five parameters included in the Carolina hemlock prioritization model are reported in Figures 11.2, 12.2, 13.2, 14.2, and 15.2. The difference maps produced by the sensitivity analysis performed on Carolina hemlock shows the multi-criteria evaluation model being most sensitive to inbreeding (Figure 11.2). The minimum and maximum difference map values among omitted parameters were nearly the same; however, the mean difference map output value of the inbreeding parameter was over twice as high as the next closest—average annual extreme minimum temperature difference (Figure 15.2). In opposition to inbreeding and minimum temperature difference—the

(56)

DISCUSSION

Eastern Hemlock

In New York specifically, populations central in latitude across the state are worth strong consideration (Figure 4.1). Likewise, lowest overall sampled inbreeding in Maine, coupled with limited sampling density makes most of the state a possible candidate for seed banking and conservation efforts. Additionally, patches in southwest Vermont also earned high values and are worth consideration.

Populations in the northwestern part of the range also receive relatively high priority and should also be considered for further genetic diversity studies and seed banking. Based on high values for observed heterozygosity, low levels of inbreeding, and high risk of minimum temperature changes, populations in eastern Wisconsin should receive

consideration for conservation efforts. Additionally, disjunct and moderately prioritized populations nearby should receive consideration, as disjunct populations sampled by Potter et al. (2012) show genetic distinctiveness from main-range populations. Furthermore, they may be at a greater risk of climate change.

Although genetic diversity is known to be high in southern populations, high northern values for observed heterozygosity, minimum temperature difference, and

(57)

hemlock populations are not at great risk of climate change, rather it aims to reinforce the necessity to limit HWA’s northward range expansion. The northward trend of range

restrictions induced by climate warming and the accompanying changes could increase stress to otherwise healthy trees while delimiting the spread of HWA previously selected for cold-tolerance.

Finally, the sampling location and size of eastern hemlock populations is a

noteworthy limitation for this analysis. Differences in sampling density throughout the range has a profound effect on interpolating regions similarly. In the northeastern region where the density is lower, the interpolation has a tendency to draw from sampling locations that are further away, stretching the results across a larger area. In the south where the range narrows, the sampling locations are much closer together. This changes the patter of the prediction effort, which tends to be high in areas with limited sampling locations and low in area where sampling is dense. These sampling issues are accounted for in the methodology, where a neighborhood restriction limits the number of points included in the interpolation to a

Figure

Figure 1.1. Carolina hemlock seed collection locations as sampled by Campbell (2014). Aside from the modeled  parameters, low sampling distribution in the southwestern sector should contribute to at least one sampling location in the area
Figure 2. New counties infested with hemlock woolly adelgid for each decade through the year 2014
Figure 3.1. Counties infested with hemlock woolly adelgid in each USDA plant hardiness zone
Figure 4.1. Eastern hemlock populations prioritized based on the combination of weighted climatic and genetic parameters
+7

References

Related documents