ANALYSIS OF EMISSION PROFILES FROM CHARCOAL PRODUCED FROM DIFFERENT TREE SPECIES BY DIFFERENT PYROLYSIS
METHODS
TOM JUSTUS SHIKORIRE N50/CTY/PT/23014/2011
A thesis submitted in partial fulfillment for the Degree of Master of Environmental Science in the School of Environmental Studies of Kenyatta University
DECLARATION
This thesis is my original work and has not been presented for any award or degree in any other University.
Tom Justus Shikorire (Bsc. Industrial Chemistry) N50/CTY/PT/23014/2011
Department of Environmental Science
Signature………... Date………
This thesis has been submitted with our approved as University Supervisors.
Dr. Margaret Mwihaki Ng’ang’a Chemistry Department
Kenyatta University
Signature……….. Date.……… Dr. Gathu Kirubi
Department of Environmental Science Kenyatta University
DEDICATION
ACKNOWLEDGEMENT
I am deeply indebted to my supervisors; Dr. Margaret Ng’ang’a, Dr. Gathu Kirubi and Prof. Ahmed Hassanali of Kenyatta University for all the insightful ideas, guidance, encouragement and critical discussion that they provided throughout the study period. Most importantly, my overwhelming gratitude goes to Prof. Ahmed Hassanali for proposing this fascinating topic of study.
I also appreciate Mr. Murefu Baraza of energy environment and development advisory whose insightful lectures in the renewable energy technologies class gave me a strong foundation and passion to pursue this course. The laboratory work would not have been possible without the unrelenting and kind help of Mr. Elias Maina, chief technician in Chemistry Department who helped fabricate the glassware used in this study.
Although there aren’t enough superlatives to express how grateful and lucky I am for having the best parents and brothers in the world I would like to thank my mother Chilande, father Akali and brothers Maurice, Laurence and William. This work could not have been possible were it not for their steadfast love, support and believing in me especially during tough times.
TABLE OF CONTENTS
DECLARATION... II DEDICATION... III ACKNOWLEDGEMENT ... IV TABLE OF CONTENTS ... V LIST OF TABLES ... VIII LIST OF FIGURES ... IX ABSTRACT ... X ACRONYMS AND ABBREVIATIONS ... XI
CHAPTER ONE: INTRODUCTION ... 1
1.1.BACKGROUND ... 1
1.2.PROBLEM STATEMENT ... 6
1.3.JUSTIFICATION ... 7
1.4.RESEARCH QUESTIONS ... 8
1.5.HYPOTHESES ... 9
1.6.OBJECTIVE OF THE STUDY ... 9
1.7.SCOPE AND LIMITATIONS OF THE STUDY... 9
1.8.CONCEPTUAL FRAMEWORK ... 10
CHAPTER TWO: LITERATURE REVIEW ... 11
2.1.CHARCOAL CONSUMPTION ... 11
2.2.TECHNOLOGIES FOR CHARCOAL PRODUCTION ... 13
2.2.1. Traditional earth mound kiln ... 14
2.2.2. Efficient/ improved pyrolysis methods ... 15
2.3.SUSTAINABLE VERSUS NON SUSTAINABLE CHARCOAL PRODUCTION ... 17
2.4.TREE SPECIES FOR CHARCOAL PRODUCTION ... 19
2.5.ENVIRONMENTAL IMPACTS OF CHARCOAL PRODUCTION AND CONSUMPTION ... 23
2.6.EMISSIONS FROM CHARCOAL BURNING ... 26
2.7.POLYCYCLIC AROMATIC HYDROCARBONS (PAHS) ... 28
2.8.HEALTH EFFECTS OF BIOMASS BURNING ... 30
CHAPTER THREE: MATERIALS AND METHODS ... 37
3.1.GLASSWARE AND SOLVENTS ... 37
3.1.1. Glassware ... 37
3.1.2. Solvents ... 37
3.2.APPARATUS ... 37
3.2.1. Chimney ... 37
3.2.2. Clay Jiko / Cook stove ... 38
3.3.SAMPLING ... 38
3.3.1. Species identification ... 39
3.3.2. Charcoal production and sample collection ... 39
3.4.EXPERIMENTAL SETUP ... 40
3.5.EXTRACTION OF VOLATILES ... 40
3.6.GAS CHROMATOGRAPHY-MASS SPECTROMETRY ANALYSIS ... 41
3.7.EXPERIMENTAL DESIGN ... 41
3.8.DATA ANALYSIS ... 42
CHAPTER FOUR: RESULTS AND DISCUSSION ... 43
4.1.EMISSIONS FROM CHARCOAL PREPARED FROM A. POLYACANTHA BY TRADITIONAL ... 43
4.2.EMISSIONS FROM A. POLYACANTHA CHARCOAL PREPARED BY EFFICIENT PYROLYSIS
... 47
4.3.COMPARISON OF PAH EMISSIONS FROM A. POLYACANTHA CHARCOAL SMOKE ... 50
PREPARED BY TRADITIONAL AND EFFICIENT PYROLYSIS ... 50
4.4. EMISSIONS FROM A. XANTHOPHLOEA CHARCOAL PREPARED BY TRADITIONAL PYROLYSIS ... 51
4.5. EMISSIONS FROM A. XANTHOPHLOEA CHARCOAL PREPARED BY EFFICIENT PYROLYSIS ... 55
4.6.COMPARISON OF PAH EMISSIONS FROM A. XANTHOPHLOEA CHARCOAL PREPARED BY ... 56
TRADITIONAL AND EFFICIENT PYROLYSIS ... 56
4.7.EMISSIONS FROM E. GRANDIS CHARCOAL PREPARED BY TRADITIONAL PYROLYSIS ... 58
4.8.EMISSIONS FROM E. GRANDIS CHARCOAL PREPARED BY EFFICIENT PYROLYSIS .... 61
4.9.COMPARISON OF PAH PROFILES EMITTED FROM A. POLYACANTHA AND A. ... 64
XANTHOPHLOEA CHARCOAL PREPARED BY TRADITIONAL PYROLYSIS ... 64
4.10. COMPARISON OF PAH PROFILES EMITTED FROM A. POLYACANTHA AND E. GRANDIS ... 66
CHARCOAL PREPARED BY TRADITIONAL PYROLYSIS ... 66
4.11.COMPARISON OF PAH PROFILES EMITTED FROM A. XANTHOPHLOEA AND A. ... 67
POLYACANTHA CHARCOAL PREPARED BY EFFICIENT PYROLYSIS ... 67
4.12. COMPARISON OF PAH PROFILES EMITTED FROM A. XANTHOPHLOEA AND E. GRANDIS ... 67
CHARCOAL PREPARED BY EFFICIENT PYROLYSIS ... 67
4.13.COMPARISON OF PAH PROFILES EMITTED FROM DIFFERENT TYPES OF CHARCOAL ... 67
CHAPTER FIVE: CONCLUSION AND RECOMMENDATIONS ... 71
5.1.CONCLUSION ... 71
5.2.RECOMMENDATIONS ... 72
5.3.AREAS OF FUTURE RESEARCH ... 72
REFERENCES ... 74
APPENDICES ... 92
APPENDIX 6.1:PROPERTIES AND STRUCTURE OF IDENTIFIED PAHS ... 92
APPENDIX 6.2: EMISSION PROFILES OF SMOKE EMITTED BY CHARCOAL PREPARED FROM A. ... 95
POLYACANTHA BY TRADITIONAL PYROLYSIS ... 95
APPENDIX 6.3: EMISSION PROFILES OF SMOKE EMITTED BY CHARCOAL PREPARED FROM A. ... 98
POLYACANTHA BY EFFICIENT PYROLYSIS ... 98
APPENDIX 6.4: EMISSION PROFILES OF SMOKE EMITTED BY CHARCOAL PREPARED FROM A. ... 100
XANTHOPHLOEA BY TRADITIONAL PYROLYSIS ... 100
APPENDIX 6.5: EMISSION PROFILES OF SMOKE EMITTED BY CHARCOAL PREPARED FROM A. ... 102
XANTHOPHLOEA BY EFFICIENT PYROLYSIS ... 102
APPENDIX 6.6: EMISSION PROFILES OF SMOKE EMITTED BY CHARCOAL PREPARED FROM E. ... 104
GRANDIS BY TRADITIONAL PYROLYSIS ... 104
LIST OF TABLES
Table 1.1: IARC classification of PAHs……….. 8
Table 2.1: A summary of efficient kilns ………. 18
Table 2.2: Components of biomass smoke……….. 29
Table 2.3: Standards and regulations for PAHs……….. 31
Table 3.1: Experimental design……… 42
Table 3.2: GC-MS Analysis Conditions……….. 43
Table 4.1: Concentrations for PAH emissions from A. polycantha prepared by traditional pyrolysis……… 46
Table 4.2: Concentrations of emitted PAHs from A. polyacantha charcoal prepared by efficient pyrolysis……… 49
Table 4.3: Comparison of emissions from A. polyacantha prepared by efficient and traditional pyrolysis……… 51
Table 4.4: Concentrations of emitted PAHs emitted from A. xanthophloea charcoal prepared by traditional pyrolysis………. 54
Table 4.5: Comparison of emitted PAHs from A. xanthophloea charcoal prepared by traditional and efficient pyrolysis……… 58
Table 4.6: Concentrations of PAHs emitted from E. grandis charcoal prepared by traditional pyrolysis………. 61
Table 4.7: Concentrations of emitted PAHs from E. grandis charcoal prepared by efficient pyrolysis………. 64
Table 4.8: Comparison of emitted PAHs from A. polyacantha and A. xanthophloea charcoal prepared by traditional pyrolysis…………. 66
Table 4.9: Comparison of emitted PAHs from A. polyacantha and E. grandis charcoal prepared by traditional pyrolysis……….. 67
LIST OF FIGURES
Figure 1.1: The conceptual framework of the study………... 10
Figure 2.1: The traditional earth mound kiln……….. 15
Figure 2.2: The dome shaped brick kiln………. 17
Figure 2.3: A. polyacantha……….. 22
Figure 2.4: A. xanthophloea……… 22
Figure 2.5: E. grandis………. 24
Figure 2.6: Metabolism of PAH leading to protein and DNA adducts (Pampanin, 2013)………. 33
Figure 3.1: Experimental set up for collection of volatiles……… 39
Figure 3.2: A schematic diagram of the experimental set up for collection of volatiles……….. 41
Figure 4.1: Total ion chromatogram of smoke emitted by charcoal prepared from A. polyacantha by traditional pyrolysis………. 43
Figure 4.2: Concentrations of PAHs in volatile blend obtained from traditionally prepared A. polyacantha charcoal………. 46
Figure 4.3: Total ion chromatogram of smoke emitted by charcoal prepared from A. polyacantha by efficient pyrolysis……….. 48
Figure 4.4: Concentration of PAHs in volatile blend obtained from A. polyacantha charcoal prepared by efficient pyrolysis …………. 49
Figure 4.5: Total ion chromatogram of smoke emitted by charcoal prepared from A. xanthophloea by traditional pyrolysis……… 52
Figure 4.6: Concentrations of PAHs in volatile blend obtained from traditionally prepared A. xanthophloea charcoal………. 54
Figure 4.7: Total ion chromatogram of smoke emitted by charcoal prepared from A. xanthophloea by efficient pyrolysis………. 55
Figure 4.8: Concentrations of PAHs in volatile blend obtained from A. xanthophloea charcoal prepared by efficient pyrolysis……….. 56
Figure 4.9: Total ion chromatogram of smoke emitted by charcoal prepared from E. grandis by traditional pyrolysis……….. 58
Figure 4.10: Concentrations of emitted PAHs from E. grandis charcoal prepared by traditional pyrolysis……….. 60
Figure 4.11: Total ion chromatogram of smoke emitted by charcoal prepared from E.grandis by efficient pyrolysis……… 62
ABSTRACT
ACRONYMS AND ABBREVIATIONS BaP CCME Cap-1 CDM CO2 CO Day-1 DNA EJ EUC GC GJ GJIC GOK HP HPLC IACR IEA IIED KEFRI LPG MOE MS NMHC PAC PAH PEM PISCES PM WHO Benzo[a]pyrene
Canadian Council of Ministries of Environment Per Capita
Clean development mechanism Carbon dioxide
Carbon monoxide Per Day
Dinitronucleic acid Exajoules (1018 joules) European commission Gas Chromatography Gigajoule (109 Joules)
Gap Junction Intercellular Communication Government of Kenya
Hewlett Packard
High Performance Liquid Chromatography International Agency for Cancer Research International Energy Agency
International Institute for Environment and Development Kenya Forestry Research Institute
Liquid Petroleum Gas Ministry of Energy Mass Spectrometry
Non Methane Hydrocarbons Practical Action
Polycyclic Aromatic Hydrocarbons Portable Emissions Monitor
Policy Innovation Systems for Clean Energy security Particulate matter
CHAPTER ONE: INTRODUCTION 1.1. Background
Charcoal is a wood based secondary form of energy produced by the pyrolysis of wood in the absence of air (Macqueen and Korhaliller, 2011). This is achieved by cutting wood to pieces and burning them in a kiln where the flow of air is controlled. Charcoal is widely used as a fuel in approximately 80% of Kenyan households and will continue being an important fuel for many years to come (Mugo and Gathui, 2010a). While much emphasis has been placed on promoting efficient energy mainly electricity, formal records estimate 84% of the Kenyan population rely on traditional use of biomass in form of firewood, charcoal and crop residue as the primary source of fuel (International Energy Agency, 2014). Data on the Kenyan government expenditure shows that a bigger portion of government financing, subsidies and international development aid is aimed at developing electricity that mainly caters for the needs of the urban based formal sector, commercial and industrial sectors, and medium and affluent urban and peri-urban households (Karekezi et al., 2008a). This has however not phased out the consumption and demand for charcoal.
minimal (Kituyi, 2002). It is therefore plausible to conclude that biomass (mainly firewood and charcoal) will continue being the main sources of energy for most of sub Saharan Africa for many years to come (Kituyi, 2002; Gustafson, 2001; UNDP, 2000).
Whereas the overreliance on biomass fuels is mainly linked to poor communities, charcoal is also consumed by affluent groups due to its unique properties. Urban households prefer charcoal because it is affordable, economical, convenient, it does not produce a lot of smoke relative to wood. Its calorific value is double that of wood and it consequently lasts longer more so when used with improved cook stoves (Karekezi et al., 2008a). The high demand for charcoal especially in the urban areas puts a lot of pressure on the surrounding forests and woodlands (Karekezi et al., 2008a). Kenya has a wood supply potential of 31.4 million m3 against a national demand of 41.7 million m3 hence a current deficit of 10.3 million m3. Forecasts for a 20 year period indicate a 20.0% increase in supply and 21.6% increase in demand by the year 2032 which signifies a gradually increasing deficit (MEWNR, 2013).
imposing total bans on charcoal trade (Githiomi et al., 2012; Githiomi and Oduor, 2012; Mugo and Gathui, 2010a). Two of the most protracted endeavors have been the advancement of energy efficient pyrolysis methods and environmentally stable improved cook-stoves for urban and rural poor (Karekezi et al., 2005).
Wood is commonly pyrolized into charcoal using earth, brick or steel drum kilns in small to large quantities depending on the producer that is either small scale or large scale producers (Kammen and Lew, 2005b). Wood is collected and cut into desired size then placed into an underground or above ground kiln. The kiln is lit and the wood fired up and begins to carbonize. The charcoal producer seals most of the air pockets and leaves just enough to allow some smoke and moisture to escape. The process may take a few hours to weeks to complete with half of the primary energy lost through the process (Seidel, 2008; Bailis, 2005; Karekezi et al., 2005). The energy efficiency of the process is influenced by factors such as; the kiln, moisture content of the wood, wood species, wood arrangement and the experience of the charcoal producer (Kammen and Lew, 2005a).
identified in wood smoke revealing the complexity of these emissions (IARC, 2010; Lim and Seow, 2012).
The emissions produced during the combustion of charcoal may depend on the method used to carbonize the wood and also the type of species from which the charcoal is being produced (Hindi, 2012). The chemical makeup of wood which is mainly lignin, hemicelluloses, cellulose and organics varies from one tree species to the other (Pettersen, 1984). It is reported that thermal decomposition of wood begins at 100oC while hemicelluloses, cellulose and lignin are degraded at 200-260 °C, 240-350 °C and 280-500 °C respectively (Hindi, 2012). Thus the conditions under which the charcoal was produced affects the chemical composition of the charcoal produced and hence emitted compounds when the same charcoal is burnt on a cook-stove. The cook-stove type chosen for charcoal combustion determines the quality and quantity of emissions (Roden et al., 2009).
In the year 2000, indoor air pollution from solid fuel use was responsible for more than 1.6 million annual deaths (400,000 in sub Saharan Africa) and 2.7% of the global burden of disease, making indoor air pollution the second largest environmental contributor to ill health after unsafe water and sanitation (Takama et al., 2011; Haller
It is estimated (in a business as usual scenario) that the use of biomass by households will result in 8.1 million lower respiratory infection (LRI) deaths among young children and 1.7 million chronic obstructive pulmonary deaths (COPD) among adult women in Sub Saharan Africa between 2000 and 2030 (Bailis et al., 2007).
Carbon monoxide and carbon dioxide from biomass fuels are well known to cause suffocation in poorly ventilated rooms. However, other pollutants in charcoal smoke known as products of incomplete combustion for example polycyclic aromatic hydrocarbons (PAH) have shown the ability to be injurious to human health especially due to their chronic effects. PAHs have been classified as priority pollutants owing to the carcinogenic potential of several individual PAH compounds and PAH mixtures (IARC 1987, 1985, 1984,). PAHs are widespread environmental pollutants that are formed in the combustion process of carbonaceous materials at high temperature (Nikolaou et al, 1984). Indoor air is contaminated by PAHs, which come not only from infiltration or intrusion of outdoor air but also from indoor emission sources such as smoking, cooking, and domestic heating with fuel stoves and open fireplaces, as well as from incense and candle emissions (WHO, 2010b; Zhang and Tao, 2009; Baek et al., 1991).
1
Source: (Haynes, 2011)
The current study aimed at finding out the emission profiles of three tree species commonly used for charcoal production. The research also aimed to make comparisons of the emission profiles of charcoal produced by efficient pyrolysis methods and by traditional pyrolysis methods. The tree species of interest are; E. grandis, A. polyacantha and A. xanthophloea. These were collected directly from the charcoal producers in Thika (Kakuzi Limited), Kitengela (Kitengela arboretum) and from Machakos. Kitengela and Thika were selected since there are known sustainable charcoal producers (Kakuzi limited and Kitengela arboretum farm). They specialize in planting trees and producing charcoal using efficient pyrolysis methods (Mugo and Gathui, 2010b; PAC, 2010). The kilns used by these farmers are the brick kiln and the ‘Kinyanjui’ metal drum kilns (Oduor et al., 2009). On the other hand, Machakos was chosen due to the abundance of acacia trees in the region and the traditional pyrolysis methods of charcoal production employed by the charcoal producers.
1.2. Problem statement
indoor air pollution resulting to pneumonia, chronic obstructive pulmonary disease, ischemic heart disease and lung cancer (Smith, 2006; WHO, 2010; Zhang and Smith, 2005). Indoor air pollution is rported to be the second largest contributor to ill health after unsafe water and sanitation.
The world health organization estimates that two million deaths occur annually due to exposure to emissions from biomass fuels and coal (WHO, 2010). There is therefore a compelling research need to investigate and determine the quality and quantity of pollutants in biomass fuels. This study fills this important research gap by analyzing the emissions from commonly used trees species subjected to different pyrolysis processes. The results will help charcoal producers in making choices regarding tree species and pyrolysis methods for production of charcoal with minimal health effects when used.
1.3. Justification
compounds into five major groups (Table 1.1) based on available evidence regarding their carcinogenicity (IARC, 2010a).
Table 1.1: IARC classification of PAHs
Group 1 Sufficient evidence in humans and animals and strong theoretical data in humans
Group 2A Limited evidence in humans and strong evidence in animals Group 2B Limited evidence in humans and less than sufficient
evidence in animals
Group 3 Inadequate evidence in humans and inadequate or limited evidence in animals
Group 4 Lack of carcinogenicity in animals or humans Source: (IARC, 2010a).
Charcoal is currently used by about 80% of the Kenyan population and will continue to be used as a fuel for long time to come ( Karekezi et al., 2008b; Bailis, 2005a; Kituyi et al., 2001a). The study was conducted to characterize emissions from various types of charcoal so as to identify the specific compounds that end charcoal users may be exposed to.
1.4. Research questions
The study sought to answer the following research questions:
a) What quality and quantities of products of combustion are formed when charcoal made from a different tree species are subjected to different pyrolysis methods?
1.5. Hypotheses
a) There is no significant difference between the quality and quantities of emissions from A. polyacantha, A. xanthophloea and E. grandis charcoal b) There is no significant difference between the quality and quantities of
emissions from A. polyacantha, A. xanthophloea and E. grandis charcoal prepared by efficient and traditional pyrolysis methods.
1.6. Objective of the study
The overall objective of the study was to profile the potential contaminants produced when charcoal is used as a fuel for domestic purposes such as roasting, cooking and indoor space heating
Specific Objectives
i. To determine the quality and quantities of emissions from charcoal produced from A. polyacantha, A. xanthoploea and E. grandis tree species
ii. To determine the quality and quantities of emissions from charcoal produced by traditional and improved pyrolysis methods.
iii. To determine significant differences in the quantities of emissions from charcoal.
1.7. Scope and Limitations of the study
1.8. Conceptual framework
The proposed framework in measuring emissions from charcoal produced using different tree species and by different pyrolysis methods is as shown in Figure 1.1 below.
Figure 1.1: The conceptual framework of the study
Wood used for charcoal are composed mainly of cellulose, lignin and hemicelluloses. These compounds are converted into charcoal during pyrolysis. When charcoal is used as a fuel for domestic purposes, products resulting from the incomplete combustion of the charcoal are emitted. These compounds are inhaled by the immediate end users of charcoal and also contaminate food. Some of the products of incomplete combustion are carcinogenic and also cause respiratory infections especially to women and children. The research therefore aims to find out the types of contaminants that are produced when charcoal is used domestically as a fuel.
-Cancer
-Respiratory infections
-Contamination of food
-Indoor air pollution Contaminant
emission (polymeric hydrocarbons) from burnt charcoal -Tree composition
(Cellulose, hemicellulose and Lignin)
-pyrolysis method used to produce charcoal
Harmful effects can be mitigated by
CHAPTER TWO: LITERATURE REVIEW 2.1. Charcoal consumption
Charcoal is a prevalent cooking fuel for a majority of households in Africa and its demand continues to increase due to the rapid increase in population (Kituyi et al., 2001b). Demand for charcoal is predominant in urban areas as opposed to rural areas where prevailing poverty impedes even the charcoal producers from using the fuel (Kammen and Lew, 2005b). It is projected that about two thirds of the world’s population will live in urban areas by the year 2050 (Urdal and Hoelscher, 2009). This will further increase demand for charcoal and in retrospect leaving rural populations with less supply of biomass (Kammen and Lew, 2005b). Urbanization consistently reduces wood use and increases charcoal consumption while the per capita fuel-wood consumption increases with increased forest cover (Arnold and Persson, 2003). It has been further reported that as income increases, urban households tend to switch to more convenient fuels. Charcoal is generally the primary ‘transition’ fuel to which they switch to (Barnes et al., 2013).
switch to other fuel types that might be available. This has been evident in Sudan where the price of charcoal was a third more than liquid petroleum gas (LPG) but many household still bought charcoal (Mugo and Gathui, 2010a).
Charcoal is also associated with poverty in numerous ways and at multiple scales. At the macro level, charcoal constitutes a significant productive sector of the economies of many sub-Saharan African (SSA) countries and contributes to poverty reduction through national development, employment, and household income generation (Angelsen and Wunder, 2003). Charcoal alone was approximated to add 650 million dollars to Tanzania’s economy, 5.8 times the combined value of coffee and tea production while at the same time providing income to several hundred thousands of households in urban and rural areas (World Bank, 2009).
quality of life in relation to cleaner alternatives such as liquefied petroleum gas (LPG) and electricity (Arnold et al., 2003; Desanker and Zulu, 2001). Despite the negative aspects of charcoal, it still remains up the energy ladder as a transitional fuel and is used by majority of households in SSA.
2.2. Technologies for charcoal production
Charcoal is a wood based fuel produced by carbonization / pyrolysis of wood in the absence of oxygen (Macqueen and Korhaliller, 2011). Carbonization occurs in the absence of air at temperatures of between 450 - 600oC (Macqueen and Korhaliller, 2011). Charcoal produced at low temperatures has high content of volatile material which produces poisonous fumes when burnt while charcoal produced at high temperatures contains low content of volatiles (Seidel, 2008). Charcoal production has improved over the years with the innovation of efficient kilns which have increased the efficiency and improved the quality of charcoal produced.
Technologies for charcoal production can be classified as traditional and efficient/improved pyrolysis methods. The key challenge in sustainable charcoal production is the provision of technology that is affordable and one that guarantees maximum yield from the wood used during pyrolysis. Most charcoal producers rely on the traditional earth mound kiln for charcoal production since they are unable to purchase better technologies.
2.2.1. Traditional earth mound kiln
The traditional earth mound kiln entails wood that is neatly and tightly stacked on the ground and a layer of green material (leaves and grass) placed over the pile as indicated in Figure 2.1. The stacked wood is then covered with soil thick enough to prevent air entry into the wood. The layer of green material acts as buffer holding the soil and preventing it from collapsing into the spaces in the wood. A small ignition area exposes part of the wood stack to air and is completely covered once the wood begins to burn. The charcoal producer remains on site for the entire pyrolysis process constantly sealing every outlet that may expose the wood to air usually signaled by smoke oozing out of the covering soil.
Traditional charcoal making methods lead to disintegration and depletion of national tree resources (Seboka, 2009). During the carbonization of wood into charcoal by traditional earth mound kilns, approximately 35% of wood is converted into charcoal while the rest is lost into the atmosphere in form of greenhouse gases such as CO2 and
CH4 (Seboka, 2009). For example, the production of one tone of charcoal using a
traditional kiln will require 0.1 hectares of woodland while it will only require 0.05 hectares to produce the same amount of charcoal using a efficient kiln (Oduor et al., 2012).
Approximately 60 - 85% of the wood is burnt to produce heat enough to carbonize the rest of the wood (Girard, 2002). This method is still in use today despite the availability of improved efficient kilns since it is cheap to most charcoal producers. This method of charcoal production yields charcoal of inconsistent quality and at very low yield to feedstock ratio (approximately 1:12 Kilograms. Earth mound kilns and pit kilns are the simplest technology for charcoal production with no costs but are labor intensive and can only achieve efficiencies of 8- 15 % (Seidel, 2008). The low yield in charcoal results in environmental pollution since most of the feedstock is lost and released to the environment in form of greenhouse gases (Girard, 2002).
2.2.2. Efficient pyrolysis methods
produced by this kiln is uniformly carbonized with smaller amounts of volatiles compared to the traditional earth mound kiln. This is due to the uniformly constructed brick walls that reduce energy losses as well as enhance uniform carbonization of wood. The efficiency is also higher (30%) hence charcoal yields are higher compared to the earth mound kilns.
Figure 2.2: The dome shaped brick kiln
19-30% efficiency. The financial capabilities of the charcoal producer and portability of the kiln directly affect the choice of the kiln used (Mugo et al., 2003). A dome shaped brick kiln (Figure 2.2) was used to produce charcoal for this study.
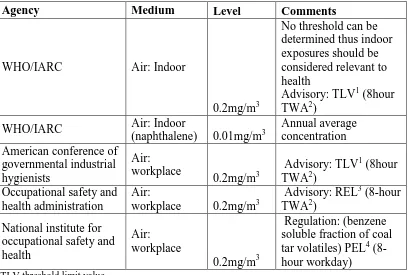
Table 2.1: Types of efficient kilns
Kiln Type Efficiency Remarks
Casamance Kiln (improved earth mound kiln)
30% -Requires capital investment for the chimney
-Difficult to construct
Brick kilns 30% -Suitable for semi industrial
production
-Carbonization 13-14 days -Cost intensive and stationary Steel kilns 27-35% -Carbonization after 16- 24
-Cost intensive
-Promoted as community kilns in Kenya
Adam Retort 40% -Noxious emissions reduced by
70%
-Carbonization within 24-30 hours
-Cost intensive and suitable for semi industrial use
Traditional kiln *8-15% -Simplest method with no cost. -Labor intensive
-Charcoal of inconsistent quality and at very low yield to feedstock ratio
*(Seidel, 2008) |Source: (Kammen and Lew, 2005a)
2.3. Sustainable versus non sustainable charcoal production
production (Girard, 2002). However, these intervention efforts have often led to unemployment, increased rural to urban migration- as charcoal producers seek alternative forms of employment. Banning of charcoal production as was done in Kenya and Mauritius has proved ineffective since bans drive producers underground making it difficult to control production procedures (Girard, 2002).
The environmental impacts of charcoal production and utilization are majorly linked to the inefficiency of carbonization, forestry and land degradation and the long transportation distances. Despite the improvements in kilns, the best kiln when properly used produces a maximum efficiency of 40% leading to energy losses of the wood in production process. Thus charcoal users end up consuming more fuel-wood than direct fuel-fuel-wood users (Kammen and Lew, 2005a). In most cases charcoal is produced from clear cutting of vegetation in preparation for planting thus it is rarely linked to sustainable forestry.
Thika. Kakuzi is a private company that is involved in planting of trees for charcoal production and treated poles. Brick kilns with an energy efficiency of between 28%-30% are used in the pyrolysis of wood found unsuitable for poles. The charcoal is then sold to vendors who in turn sell it to other consumers (Mugo and Gathui, 2010a).
However, complete sustainability goes beyond the charcoal production process. Kituyi, 2002 recommends a systems approach where the movement of material can be trailed from the time they are harvested to disposal so as to ensure sustainability throughout the wood fuel life cycle. That is, from wood harvesting, carbonization, charcoal utilization and ash disposal (Kituyi, 2002). What comes out clearly is that feedstock for charcoal production should match production, the kilns used for pyrolysis should be of high efficiency and cook-stoves used should have a high efficiency.
2.4. Tree species for charcoal production
producers largely depend on traditional knowledge when choosing the best trees for their charcoal.
Traditional charcoal producers prefer dry well stacked savannah forests as opposed to dense humid rain forests (FAO, 1987). The savannah wood is usually dense, slow-growing and contains high quantities of lignin, which gives good charcoal yield when carbonized (FAO, 1987). Species that produce charcoal that burns for a long time consistent with high carbon content are mostly preferred since this is economical to the user. The species include Casuarina equisetifolia, A. mearnsii, A. polyacantha, A. xanthophloea, A. spectabilis, E. camaldulensis, Leuceana leucocephala, Tectona
grandis, Sesbania sesban and other Acacia and Combretum species (Oduor et al., 2012). The characteristics that make these tree species suitable for charcoal production are mainly; production of little/ non- toxic smoke have dense wood with low moisture content, coppice and produce wood that does not spark when burning (Hines, 1993).
Species that produce dense charcoal such as the ones mentioned above are overly targeted by charcoal producers rendering them more vulnerable to overexploitation and in cases where coppicing and replanting are not supported, the woodlots / forests are eventually depleted (Girard, 2002).
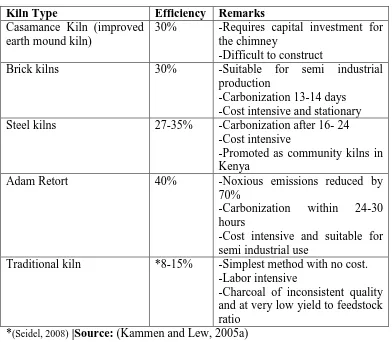
A. polyacantha
woodlands and bushlands, thriving in sites with high groundwater table and alluvial soils with a good mix of clay and sand. The species grows from sea level to an altitude of 1800 meters and does well with a mean annual rainfall of 300 - 1000 millimeters (Oduor et al., 2012b). It has a wood density of 0.467g/cm3 and the calorific value of its wood and charcoal are 4.0kj/g and 6.5kj/g respectively.
Figure 2.3: A typical A. polyacantha tree
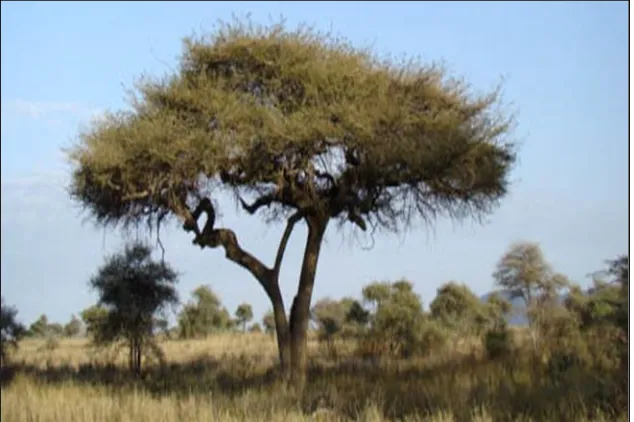
A. xanthoploea
Figure 2.4: A typical A. xanthoploea tree
E. grandis
Figure 2.5: A typical E. grandis tree
2.5. Environmental impacts of charcoal production and consumption
The combustion of biomass including charcoal production and consumption as a domestic biomass fuel plays a significant role in the global carbon cycle (Pennise et al., 2001). It is estimated that biomass burning accounts for 25-45% annual global emissions of CO2 , 15-50 % of CO, 3-10 % of CH4 and 24 % of Total non-Methane
Organic compounds (TNMOC) (Pennise et al., 2001; Levine, 1996). These are greenhouse gases that are directly linked to global warming and climate change (Levine, 1996).
Experiments have however shown that for situations of sustainable harvesting where CO2 emissions are considered neutral, some improved stoves with better efficiency
and ventilation assistance can lower the total warming impact of PICs by as much as 50-95% ( Macqueen et al., 2011; MacCarty et al., 2008). Charcoal burning may produce less CO2 than traditional wood burning but the PIC emissions are
the chemical constituents of the emissions and their effects on humans and the environment (Pennise et al., 2001).
There is an increasing body of knowledge associating household use of traditional biomass to emissions of black carbon, which is a significant contributor to climate change (Takama et al., 2011). Residential biomass burning is bound to an estimated 18 percent of global black carbon emissions (Bond and Sun, 2005). Over forty thousand tons of wood is used daily in form of charcoal to serve the energy requirements of nearly three quarters of Kenyan households and small businesses (Bailis, 2005b). This kind of wood fuel consumption has overriding social and environmental consequences although not all impacts related to charcoal consumption are negative. The general extent to which charcoal consumption will impact the environment is dependent on the extent to which wood are sustainably harvested so that reserves do not decline (Bailis, 2005b).
charcoal fuel cycle can produce a net increase in global warming commitment (GWC-the total of global warming potentials of (GWC-the gases emitted in a process) because of (GWC-the emitted PIC (Pennise et al., 2001).
Whereas charcoal is a renewable resource, its soaring rate of extraction and inefficient use may render it a nonrenewable resource (Mugo and Gathui, 2010c). Even though some may try to delink charcoal production from deforestation due to other competing uses of forest land, many scientists agree that charcoal contributes to depletion of forests (Kristoferson, 1997). This is partly linked to the poor methods of charcoal production by use of inefficient traditional kilns which require large amounts of wood but yield low amounts of charcoal (Seidel, 2008). Greenhouse gas emissions, indoor air pollution and deforestation, reduction in ecological services of forests, biodiversity loss, soil erosion are among the major impacts associated with unsustainable utilization of forests (Mugo and Gathui, 2010c). Past arguments have suggested that charcoal production and consumption were causing destruction to vegetation cover (Eckholm, 1975). Be that as it may, a variety of tradeoffs and benefits associated with fuel wood production and consumption do exist and can be realized when charcoal is produced sustainably.
tonnes of charcoal (Mugo and Gathui, 2010c). Other environmental services of forests such as carbon dioxide sequestration, watershed protection, aesthetic benefits, climate regulation and species conservation are also gained (Pattanayak et al., 2010). In addition, more jobs are created through the making of cook stoves and ovens and kilns (Mugo and Gathui, 2010c).
2.6. Emissions from Charcoal burning
The emissions of charcoal burning are classified into two groups: emissions produced during the carbonization of wood and the emissions produced during the end use of charcoal in a cook stove. The chemical composition of the wood and the method of charcoal production may affect the profile of the emissions when the charcoal is burnt (Hindi, 2012). It is reported that thermal decomposition of wood begins at 100oC while hemicelluloses, cellulose and lignin are degraded at 200-260oC, 240-350oC and 280-500oC respectively (Hindi, 2012). In wood pyrolysis, the major contributor to volatile composition is hemicellulose and cellulose components (Park, 2010). A temperature range of between 450oC and 500oC is regarded as optimum and yields charcoal of a high carbon content with less volatiles (Park., et al 2010; FAO, 1987).
least amount of volatile matter or fixed carbon content charcoal must have before being regarded as good-quality. For example, Emrich (1985) as well as FAO (1987) reported that the volatile matter content of good quality charcoal must be less than 30%. Moreover, charcoal containing more volatile matter has lower calorific value (Foley, 1986).
Table 2.2: Components of biomass smoke
Class Constituents
Inorganic compounds Ammonia
Carbon monoxide Nitric oxide Sulfur dioxide Hydrocarbons Alkanes and alkenes
Aromatics including benzene and toluene PAHs
Other organic compounds Aldehydes and ketones, alkanols Alkyl esters, carboxylic acids Coumarins and flavanoids Methylated phenolic compounds Phytosteroids
Substituted aromatic compounds Sugar derivatives, terpenoids Source: (IARC, 2010)
2.7. Polycyclic aromatic hydrocarbons (PAHs)
PAHs are a class of organic compounds produced by incomplete combustion of biomass, coal, oil, gas garbage or other organic substances such as tobacco and plastics (Silva et al., 2011). PAHs are ubiquitous in the environment and consist of two or more fused benzene rings containing mainly carbon and hydrogen. The difference in configuration of the benzene rings may lead to different properties. There are more than 100 different PAHs, the simplest of which is naphthalene (3).
used thus they may enter the human body through ingestion and dermal absorption (WHO, 2010a).
Cl
2 3 4
Source: (Haynes, 2011)
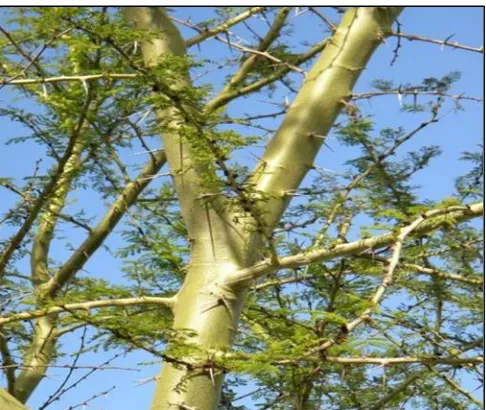
Emphasis has been placed on the mutagenic, genotoxic and carcinogenic effects of PAHs that may be contained in biomass smoke to which thousands of households are exposed (Silva et al., 2011). The United States’ occupational safety and health administration (OSHA, 2009) has mandated PAH workroom air standard (Table 2.3) to be an 8-hour time weighted average (TWA) permissible exposure limit (PEL) of 0.2mg/m3 as indicated in Table 2.3. In addition, the WHO notes that no thresholds can be determined for PAHs and thus all indoor air exposures are considered relevant to health (WHO, 2010a)
Table 2.3: Standards and regulations for PAHs
Agency Medium Level Comments
WHO/IARC Air: Indoor
0.2mg/m3
No threshold can be determined thus indoor exposures should be considered relevant to health
Advisory: TLV1 (8hour TWA2)
WHO/IARC Air: Indoor
(naphthalene) 0.01mg/m3
Annual average concentration American conference of
governmental industrial hygienists
Air: workplace
0.2mg/m3
Advisory: TLV1 (8hour TWA2)
Occupational safety and health administration
Air:
workplace 0.2mg/m3
Advisory: REL3 (8-hour TWA2)
National institute for occupational safety and health
Air: workplace
0.2mg/m3
Regulation: (benzene soluble fraction of coal tar volatiles) PEL4 (8-hour workday)
1TLV threshold limit value
2TWA (time-weighted average): concentration for a normal 8-hour workday and a 40-hour workweek
to which nearly all workers may be repeatedly exposed 3
REL: recommended exposure limit
Source: (Kim et al., 2013)
2.8. Health effects of biomass burning
The international agency for research on cancer (IARC) has classified some PAHs as carcinogenic (group 1) or likely carcinogenic to humans (group 2) (IARC, 2010). Formal classification of individual PAHs as confirmed, probable or possible carcinogens is highly dependent on the degree to which they have been assessed using a variety of experimental and epidemiological approaches - especially for the large number of alkylated PAHs. Alkylated PAHs have been found to be more toxic as compared to their un-substituted congeners (Rhodes et al., 2005). Although not all PAHs have been classified as carcinogens, there is little doubt that at least some of the presently unclassifiable PAHs will be confirmed as potentially carcinogenic in future (CCME, 2008).
Individuals can be exposed briefly or throughout their lifetimes to chemicals in air, water and food; exposures may be environmental or occupational. The main routes of exposure are inhalation, ingestion and dermal contact (WHO, 2010). Food groups that tend to have the highest levels of PAHs include charcoal broiled or smoked meats, leafy vegetables, grains, and vegetable fats and oils (Yu et al., 2011). Individuals vary widely in their response to exposure to chemicals; each person has a pre-existing status (defined by, for example, age, sex, pregnancy, pulmonary disease, cardiovascular disease, genetic make-up) and a lifestyle, in which such factors as exercise and nutrition play key roles. All these different elements may influence a person’s susceptibility to chemicals (WHO, 2010c).
of organs mainly the liver, kidney and lungs. They are excreted in the bile, urine or breast milk and stored to a limited degree in adipose tissue (Muñoz and Albores, 2012).The lipophilicity of PAHs enables them to readily penetrate cellular membranes (Yu et al., 2011). Subsequent metabolism renders them more water-soluble making them easier for the body to remove. However, PAHs can also be converted to more toxic or carcinogenic metabolites (Muñoz and Albores, 2010).
Figure 2.6: Metabolism of PAH leading to protein and DNA adducts Source: (Pampanin, 2013)
PAHs may absorb light energy in ultra violet region (UVR) of (280-400 nm) region and may induce DNA damage by production of ROS (Muñoz and Albores, 2012). For example, chrysene induces apoptosis and DNA damage in human keratinocytes by generating ROS in response to UVB radiation (Ali et al., 2011).
DNA adducts caused by PAH metabolites are known to be essential components in the cause of cancer development (Pampanin, 2013). Thus, DNA adducts are used as biomarkers of exposure to PAHs and they represent a crucial end point, being a marker of genotoxicity (Pampanin, 2013). For example, some studies have revealed, by X-ray crystallography, structures of PAH-adducted oligonucleotides bound to bacterial DNA polymerases (Hsu et al., 2005; Ling et al., 2004).
The failure of repair mechanisms and constant exposure to PAHs induces mutagenesis in cells. If DNA repair mechanisms are afflicted by the adduct formation rate the result is an accumulation of mutations in DNA that may induce carcinogenesis (Muñoz and Albores, 2012). These mutations are present in multiple genes including those that participate in cell survival. In particular, p53 mutations are associated with risk of carcinogenesis in PAH exposed individuals (Muñoz and Albores, 2012). Since the p53 protein is a transcription factor that regulates cell proliferation, differentiation, apoptosis, and DNA repair, mutations induced in this important protein could lead to severe damage in cells and genes. Some studies have linked p53 mutations to PAH exposure (Mordukhovich et al., 2010; Yoon et al., 2003).
The figure 2.1 adopted from Pampanin, (2013) is a schematic representation of DNA-PAH adducts formation process.
Cells are capable of repairing damage caused from PAH exposure, adduct formation, and ROS production through a number of molecular mechanisms. The most common mechanisms of repair used by cells exposed to PAHs are nucleotide excision repair (NER), base excision repair (BER), non-homologous end joining (NHEJ) of DNA double-strand breaks (DSBs), homologous recombination-al repair (HRR) and transcription coupled repair (TCR) (Muñoz and Albores, 2012). In addition, some studies indicate that DNA damage induced by PAHs is preferentially repaired by NER or BER and to a lesser extent by HRR ( Meschini et al., 2010; Braithwaite et al, 1998). In the NER process, cells identify damaged DNA regions based on their unusual structure or chemistry. NER is considered the main pathway for removal of bulky DNA adducts (Braithwaite et al., 1998).
CHAPTER THREE: MATERIALS AND METHODS 3.1. Glassware and Solvents
3.1.1. Glassware
All the glassware that was used in this work was cleaned using chromic acid followed by washing detergent. They were then rinsed with distilled water followed by acetone and then kept in the oven at 80°C to dry. Before sample collection, the conical flasks and sample bottles were rinsed with distilled dichloromethane and dried in the oven. All this was done so as to avoid contamination.
3.1.2. Solvents
The solvent used was dichloromethane (DCM). This was of analar grade purchased from Sigma-Aldrich Company. DCM was used for the extraction of volatiles as well as washing of glassware. DCM is immiscible in water and can dissolve a wide range of organic compounds due to its medium polarity(Rossberg et al., 2000). In addition, DCM has a low boiling point (39°C) thus it can be evaporated at low temperature without losing the extracted compounds
3.2. Apparatus 3.2.1. Chimney
Figure 3.1: Experimental set up for collection of volatiles
3.2.2. Clay Jiko / Cook stove
A clay Jiko was also fabricated in a way that its edges were the same size as the chimney so as to minimize any smoke losses (Figure 3.1). The chimney was placed on top of the cook stove allowing the smoke to flow in one direction into the collecting cannula where the volatiles were condensed.
3.3. Sampling
Purposive sampling was employed in selecting charcoal producers from whom the charcoal samples were collected based on insights from published literature (Oduor et al 2012; Mugo et al., 2010; KEFRI, 2009). The species chosen were E. grandis,
3.3.1. Species identification
Tree species were identified by a taxonomist from Botany department, KU and voucher specimen deposited at the university herbarium and prepared for carbonization..
3.3.2. Charcoal production and sample collection
Two pyrolysis methods of charcoal production that is the traditional earth mound kiln and the dome shaped brick kiln (described in section 2.2) were used. Charcoal producers in Thika, Kitengela and Machakos were identified. In Thika, Kakuzi limited was identified as a semi industrial charcoal producer that uses E. grandis
species and a dome shaped brick kiln for pyrolysis. Another charcoal producer specializing in charcoal production from A. polyacantha and A. xanthoploea among other tree species identified in Kitengela. This charcoal producer also used a dome shaped brick kiln similar to the one used by Kakuzi Limited.
Two other charcoal producers were identified in Machakos. These were specialized in production of charcoal using the traditional earth mound kiln (see section 2.2.1). Dry wood from A. polyacantha and A. xanthoploea was bought from a farmer in Machakos and given to the charcoal producers. They were paid to produce charcoal for the study. Kakuzi limited and the charcoal producer in Kitengela (Teddy Kinaynjui of ‘cookswell Jikos’) provided the charcoal samples at no cost since they were interested in the research findings.
3.4. Experimental setup
The set up shown in figure 3.1 and 3.2 was used to collect aliquot samples from the different types of charcoal under study.
Figure 3.2: A schematic diagram of the experimental set up for collection of volatiles
Charcoal samples were burnt on a clay cook-stove / jiko and the smoke condensed in a canula tube held in a thermos flask containing ice and sodium chloride at negative 8 to 10 °C.
3.5. Extraction of Volatiles
The condensed volatiles were mixed with 30ml of dichloromethane (DCM) in a separating funnel and mixed vigorously for 5 minutes. The mixture was then allowed to settle forming two layers that were then separated. This was repeated three times and the resulting DCM fractions were pooled together. Sodium sulfate (Na2SO4)
granules were dried in the oven at 1050C for 2 hours. A scoopful of the dried anhydrous Na2SO4 was added to the extract in a conical flask and the flask swirled.
More Na2SO4 was gradually added with swirling of the flask until all the water was
filter paper. The process was repeated for all the other extracts. The dried extracts were transferred into a round bottomed flask and concentrated with a rotary evaporator at a temperature of 30oC.
3.6. Gas Chromatography- Mass Spectrometry analysis
The volatiles were analyzed using Gas Chromatography-linked Mass Spectrometry (GC-MS) and constituents characterized by their fragmentation patterns. This was compared with those from National Institute of Standards and Technology (NIST) library and their relative amounts determined. The conditions under which the analysis was done are as outlined in the Table 3.1.
Table 3.1: GC-MS Analysis Conditions
GC MS
Column Rtx-35 (length 30 m, 0.32 mm I.D., df=0.25 μm
Interface temperature
300℃
Inlet Mode Splitless Ion source
temperature
230℃ Vaporizing
Chamber temp
300℃ Solvent elution time 3.5min
Column oven temp 90℃ (2min) →5℃→(10min) 320℃→ (12min)
Data sampling time 4.5 – 60min
Carrier gas Helium Measurement mode Scan
Control mode Constant linear velocity
(43.7cm/sec)
Mass range m/z 45-450
High pressure injection
150kPa (1.5min) Event time 0.3sec Purge flow rate 3 mL/min
Injection rate 1.0 μL
Source: (Mannino and Orecchio, 2008)
3.7. Experimental design
extracts were injected into the GC-MS machine and the mean concentrations calculated and analyzed
Table 3.2: Experimental design
Species
A. polyacantha A. xanthoploea E. grandis
Traditional x x x
Efficient x x x
X- Three extracts for each charcoal sample
3.8. Data analysis
CHAPTER FOUR: RESULTS AND DISCUSSION
4.1. Emissions from charcoal prepared from A. polyacantha by traditional pyrolysis
GC-MS characterization of emissions obtained from A. polyacantha charcoal prepared by traditional pyrolysis revealed a total of 84 compounds. These included PAHs (6%), phenols (42%), benzene derivatives (15%), ketones (12%), alkanes (4%), alkenes (9%), phthalates (1%), aldehydes (1%), carboxylic acids (1%) and esters (2%).The total ion chromatogram of smoke emitted by charcoal prepared from A. polyacantha prepared by traditional pyrolysis is illustrated in Figure 4.1 below. Additionally, the retention times as well as relative abundances for all the identified compounds are given in Appendix 6.2.
Figure 4.1: Total ion chromatogram of smoke emitted by charcoal prepared from
A. polyacantha by traditional pyrolysis * Daltons
From the analysis, a total of eleven PAHs were identified and are indicated on the chromatogram. These were naphthalene (3), pyrene (4), 2-methylnaphthalene (5), fluorene (6), 2,6-diisopropylnaphthalene (7), 9H-fluoren-9-one (8), phenanthrene (9), fluoranthene (10), anthracene (11), benzo(a)anthracene (12) and chrysene (13).
5 6 7
O
8 9 10
11 12 13
Source: (Haynes, 2011)
Table 4.1: Concentrations of PAHs from A. polycantha charcoal prepared by traditional pyrolysis
PAHs
*Concentration x10-3(µg/g)
WHO/NIOSH Exposure Limit x10-3(µg/g)
Naphthalene 110.00 ± 4.93a 38.5
Benzo(a)anthracene 91.67 ± 10.82ba 16.96
Phenanthrene 91.00 ± 2.08ba 35.67
Anthracene 80.33 ±10.04bc 35.67
Chrysene 74.67 ± 14.24bcd 22.05
Fluorene 72.00 ± 4.58bcd 31.43
Fluoranthene 66.67 ± 4.70cd 38.24
2-Methylnaphthalene 64.00 ± 7.23cd 33.06
Pyrene 60.00 ± 3.79cd 31.43
9H-Fluoren-9-one 58.33± 6.36cd 27.14
2,6-Diisopropylnaphthalene 53.67 ± 1.76d 30.00
*Means separated using Duncan Multiple Range Test (DMRT) by the same letter are not significantly different (P˃0.05) from each other
Figure 4.2: Concentrations of PAHs in volatile blend obtained from traditionally prepared A. polyacantha charcoal
The difference in the concentration of the emitted PAHs can be attributed to the different concentration of precursor compounds from which PAHs were formed. In pyrolysis, PAHs are proposed to be formed by pyro-synthesis, in which radicals undergo a series of bimolecular reactions with alkenes, alkynes, and aromatics to form larger ring structures (Britt et al., 2004). The pyro-synthesis of individual PAHs has been linked with phytochemicals present in biomass fuels (Britt et al., 2004). For example, it is reported that the native structure of steroids was maintained to form PAHs such as phenanthrene and chrysene structures and the yield of PAHs was dependent on the steroid structure (Britt et al., 2004).
Phytochemical screening of A. polyacantha stem bark revealed the presence of flavonoids, steroids, carbohydrates, tannins, anthraquinones, cardiac glycosides, alkaloids, triterpenoids and saponins (Okpanachi et al., 2011). Thus it may be
0 20 40 60 80 100 120
Conce
n
tr
at
ion
x10
-3 (µg/
g)
PAHs
plausible to conclude that since PAHs are formed from different phytochemicals present in biomass, their resulting concentrations are different owing to the quantity of phytochemicals in the plant. Similar results have been reported where naphthalene, 2-methylnaphthalene, phenantrene and fluoranthene were the most abundant in burning charcoal from water-pipe smoking (Nguyen et al., 2013).
Figure 4.3: Total ion chromatogram of smoke emitted by charcoal prepared from A. polyacantha by efficient pyrolysis
There was significant difference (P<0.05) in concentrations of PAHs emitted from A. polyacantha charcoal that had been prepared by efficient pyrolysis There was also significant differences in the concentrations of emitted naphthalene (86.00 x 10⁻³µg/g) and phenanthrene (71.33 x 10⁻³µg/g) as indicated in Table 4.2. However, the concentration of 2-methylnaphthalene (54.67 x 10⁻³µg/g) and fluorene (48.33 x
10-3µg/g) were not significantly different.
Table 4.2: Concentrations of emitted PAHs from A. polyacantha charcoal prepared by efficient pyrolysis
PAH *Concentration x 10-3(µg/g)
NIOSH exposure limit
x10-3(µg/g)
Naphthalene 86.00 ± 3.06a 38.5
Phenanthrene 71.33 ± 0.88ab 35.67
2-methylnaphthalene 54.67 ± 9.14b 33.06
Fluorene 48.33 ± 1.67b 31.43
*Means separated using Duncan Multiple Range Test (DMRT) by the same letter are not significantly different (P˃0.05) from each other
respectively. Fluorene had the least concentration (48 x 10-3µg/g) as indicated in the Figure 4.4. The mean concentrations of all the four emitted PAHs were higher than permissible exposure limits (NIOSH, 2010).
Figure 4.4: Concentration of PAHs in volatile blend obtained from A. polyacantha
charcoal prepared by efficient pyrolysis
The significant differences in the concentration of emitted PAHs from A. polyacantha
charcoal that was prepared by efficient pyrolysis can be attributed to the difference in concentrations of precursors from which the PAHs were formed. PAH synthesis during combustion has been linked with the precursors such as steroids, cellulose and alkenes in wood species (Britt et el., 2004). Thus the high concentration of naphthalene may be attributed to the high concentration of the precursor compound from which it is being formed. However, because of the chemical complexity of
0 10 20 30 40 50 60 70 80 90
Conce
n
tr
at
ion
x 10
-3 (µg/
g)
PAHs
biomass and its pyrolysis products, it is difficult to gain detailed information on the formation pathways of specific PAHs (Antal et al., 1985).
4.3. Comparison of PAH emissions from A. polyacantha charcoal smoke prepared by traditional and efficient pyrolysis
There was significant differences (t = -6.376, df = 2, P = 0.024) between fluorene emitted from A. polyacantha charcoal prepared by traditional and efficient pyrolysis (Table 4.3). In addition, there was significant differences (t = -11.529, df = 2, P = 0.007) between naphthalene emitted from A. polyacantha charcoal prepared by traditional and efficient pyrolysis (Table 4.3). There was significant differences (t = -14.750, df = 2, P = 0.005) between phenanthrene emitted from A. polyacantha
charcoal prepared by traditional and efficient pyrolysis. However, there was no significant difference (t= -1.257, df = 2, P = 0.336) between 2-methylnaphthalene emitted from A. polyacantha charcoal prepared by both traditional and efficient pyrolysis (Table 4.3).
Table 4.3: Comparison of emissions from A. polyacantha prepared by efficient and traditional pyrolysis
PAH Traditional Modern P
2-methylnaphthalene 64.00±7.23 86±3.06 0.336
Fluorene 72.00±4.58 71.33 ± 0.88 0.024
Naphthalene 110.00±4.93 54.67±9.14 0.007
Phenanthrene 91.00±2.08 48.33±1.67 0.005
into the carbonizing wood through openings in the covering soil and leaves. This results in the non-uniform carbonized charcoal which produces high concentrations of volatiles when burned on a cook-stove. On the other hand, charcoal production by efficient pyrolysis (brick kiln) results in uniformly carbonized charcoal. The brick walls of the kiln prevent entry of oxygen from the surroundings resulting in charcoal that produces low concentration of volatiles when burned on a cook stove. In addition, the double brick walls in a brick kiln ensure that most of the heat is retained inside the pyrolysis chamber allowing carbonization to take place at high temperatures as compared to earth mound kilns. It is reported that pyrolysis of wood into charcoal at low temperatures yields charcoal with a high content of volatile material which produces poisonous fumes when combusted while charcoal produced at high temperatures emits low content of volatiles (Seidel, 2008).
Figure 4.5: Total ion chromatogram of smoke emitted by charcoal prepared from A. xanthophloea by traditional pyrolysis
From the analysis, a total of eleven PAHs were identified and are indicated on the chromatogram. These were naphthalene (3), 1-methylnaphthalene (14), 1,5-dimethyl-1,2,3,4-tetrahydronaphthalene (15), 2,7-dimethylnaphthalene (16), 1,4-dimethylnaphthalene (17), fluorene (6), 2,6-diisopropylnaphthalene (7), anthracene (11) and pyrene (4).
14 15
16 17
There was significant difference (P<0.05) in the concentration of PAHs emitted from
A. xanthophloea charcoal prepared by traditional pyrolysis (Table 4.4). There was significant difference in the concentration of 2,6-diisopropylnaphthalene (201.54 x 10
-3
µg/g), naphthalene (140.42 x 10⁻³µg/g), 1,4-dimethylnaphthalene (65.64 x 10⁻³µg/g) and 1,5-dimethyl-1,2,3,4-tetrahydronaphthalene (54.23 x 10⁻³µg/g) as indicated in Table 4.4. There was however, no significant difference in the concentration of anthracene (84.80 x 10⁻³µg/g), pyrene (71.82 x 10⁻³µg/g) and 1-methylnaphthalene (70.11 x 10⁻³µg/g), 2,7-dimethylnaphthalene 109.96 x 10⁻³µg/g) and fluorene (97.35 x 10⁻³µg/g ) as indicated in Table 4.4.
Table 4.4: Concentrations of emitted PAHs emitted from A. xanthophloea charcoal prepared by traditional pyrolysis
PAH
*Concentration x 10-3 (µg/g)
NIOSH
exposure limit x10-3(µg/g) 2,6-Diisopropylnaphthalene 201.54 ± 37.26a 23.03
Naphthalene 140.42 ± 2.08b 38.15
2,7-Dimethylnaphthalene 109.96 ± 3.07cb 31.3
Fluorene 97.35 ± 5.90cd 29.42
Anthracene 84.80 ± 2.12cde 27.44
Pyrene 71.82 ± 1.78cde 24.18
1-Methylnaphthalene 70.11 ±1.60cde 34.39 1,4-Dimethylnaphthalene 65.64 ± 1.97de 31.3
1,5-Dimethyl-1,2,3,4-tetrahydronaphthalene 54.23 ± 3.38e 30.51
2,6-diisopropylnaphthalene had the highest concentration (201.54 x 10⁻³µg/g) while 1,5-dimethyl-1,2,3,4-tetrahydronaphthalene had the lowest concentration(54.23 x 10⁻³µg/g). All the concentrations of emitted compounds were higher than the WHO permissible levels as indicated in Figure 4.6
Figure 4.6: Concentrations of PAHs in volatile blend obtained from traditionally prepared A. xanthophloea charcoal
The difference in concentrations of 2,6-diisopropylnaphthalene, naphthalene, 2,7-dimethylnaphthalene, fluorene, 1,4-dimethylnaphthalene and 1,5-dimethyl-1,2,3,4-tetrahydronaphthalene can be attributed to the different concentrations of the precursor compounds from which they were formed. These precursors are mainly
0 5 10 15 20 25 30 35 40 45 0 50 100 150 200 250 300 Co n ce n tr ation s x 10
-3 (µ
g/ g) Conce n tr at ion x 10
-3 (µg/
g)
PAHs
cellulose, hemicellulose, and extractives (Britt et al., 2004; Klass, 1998). The high concentration of 2,6-diisopropylnaphthalene can be attributed to the chemical composition of the A. xanthophloea which may contain a high concentration of precursors necessary for pyro-synthesis of this compound. It is reported that during the combustion and pyrolysis of biomass, PAHs are synthesized by reactions of radicals and precursors such as alkanes, phytochemicals and aromatics to form larger fused benzene structures (Britt et al., 2004).
4.5. Emissions from A. xanthophloea charcoal prepared by efficient pyrolysis GC-MS characterization of emissions obtained from A. xanthophloea charcoal prepared by efficient pyrolysis revealed a total of 61 compounds. These included PAHs (4%), phenols (45%), benzene derivatives (16%), ketones (9%), alkanes (5%), alkenes (8%), phthalates (1%), aldehydes (5%) and esters (7%), The total ion chromatogram of smoke emitted by charcoal prepared from A. xanthophloea prepared by efficient pyrolysis is given in Figure 4.7 and the retention times as well as relative abundances for all the identified compounds are given in Appendix 6.5.