Development and Validation of Uv Spectrophotometric
Estimation of Ciprofloxacin Hcl in Bulk and Tablet Dosage
form Using Area Under Curve Method.
1Anup Kabade*, 2Sumit Gaikwad , 3Digge Pradip, 4Vipul Pulli, 5Amrapali Jagadale
Department of Pharmaceutics, D.S.T.S College of Pharmacy, Solapur, Solapur, Maharashtra, India.
Email:[email protected] ABSTRACT:-
A simple, precise, accurate, and economical UV visible spectrophotometric method has been developed for estimation of Ciprofioxacin HCL drug by AUC method. The standard and sample solutions were prepared by using double distilled water as a solvent. Quantitative determination of the drug was performed at wavelength range 270-278 nm. The linearity was established over the concentration range of 05-25 µg/ml for Ciprofioxacin HCL with correlation coefficient value of 0.9993. Precision studies showed that % relative standard deviation was within range of acceptable limits. The mean percentage recovery was found to be 99.26%. The proposed method has been validated as per ICH guidelines.
Keywords: - Ciprofioxacin HCL, UV visible spectrophotometry, AUC, Method Validation.
INTRODUCTION:-
Ciprofloxacin hydrochloride monohydrate is 1-cyclopropyl-6-fluoro-1,4-dihydro-4-oxo-
7-(1piperazinyl)-3-quinolinecarboxylic acid hydrochloride monohydrate. The molecular weight of the ciprofloxacin hydrochloride monohydrate is 385.82. It is a faintly yellowish to light yellow crystalline substance. Ciprofloxacin hydrochloride is
an antibiotic that can treat a number of
bacterial infections. It is a second-generation fluoroquinolone. Its spectrum of activity includes most strains of bacterial pathogens responsible for respiratory, urinary tract, gastrointestinal, and abdominal infections, including Gram-negative Escherichia
coli,Hamophilus influenzae,Proteus
mirabilis etc. and Gram-positive
(sensitive, but not methicillin-resistant Staphylococcus aureus,Streptococcus aureus,Streptococcus
pneumonie etc. and bacterial pathogens.
Ciprofloxacin and other fluoroquinolones are valued for this broad spectrum of activity, excellent tissue penetration, and for their availability in both oral and
intravenous formulations. Hence an attempt has been made to develop
International Journal of Research
Available at http://internationaljournalofresearch.org/p-ISSN: 2348-6848 e-ISSN: 2348-795X Volume 02 Issue 03
April 2015
Fig. 1: Chemical structure of Ciprofloxacin HCL
Proquin XR is available as 500 mg (ciprofloxacin hydrochloride monohydrate equivalent) tablets, utilizing AcuForm®
delivery technology. Proquin XR
(ciprofloxacin hcl) tablets are blue film-coated and oval-shaped. The inactive ingredients are povidone, magnesium stearate, polyethylene oxide, and film coating (Opadry® Blue).
MATERIALS AND METHODS:-
Apparatus and instrumentation
A shimadzu 1800 UV/VIS double beam spectrophotometer with 1cm matched quartz cells was used for all spectral measurements. Single Pan Electronic balance (CONTECH, CA 223, India) was used for weighing purpose. Sonication of the solutions was carried out using an Ultrasonic Cleaning Bath (Spectra lab UCB 40, India). Calibrated volumetric glassware (Borosil®) was used for the validation study.
Materials
Reference standard of Ciprofloxacin HCL API was supplied as gift sample by Medico Pharmaceutical Ltd., Mumbai. Tablet sample with label claim 250 mg per tablet were purchased from local market Pune.
Method development
Determination of Wavelength Range
Fig. 2 UV AUC spectrum of Ciprofloxacin HCL (20µg/ml)
Area under curve (Area calculation)
Area under curve method involves the calculation of integrated value of absorbance with respect to the wavelength between two selected wavelengths such as λ1 and λ2 representing start and end point of curve region. The area under curve between λ1 and λ2 was calculated using UV probe software. In this study area was integrated between wavelength ranges from 270 to 278 nm.
Area calculation: (α+β) =
Where, α is area of portion bounded by curve data and a straight line connecting the start and end point, β is the area of portion bounded by a straight line connecting the start and end point on curve data and horizontal axis, λ1 and λ2 are wavelength range start and end point of curve region[].
Preparation of standard solution
The standard stock solution of Ciprofloxacin HCL was prepared by accurately weighing & transferring, 10 mg of API to 100 ml of volumetric flask. The drug was dissolved with sonication in 50 ml of distilled water and volume was made up to the mark by using distilled water. Then take from that 2ml and add to 10ml volumetric flask and make up with distilled water to get final standard stock solution (20µg/ml) was further diluted with distilled water to obtain 05-25 µg/ml Ciprofloxacin HCL solutions.
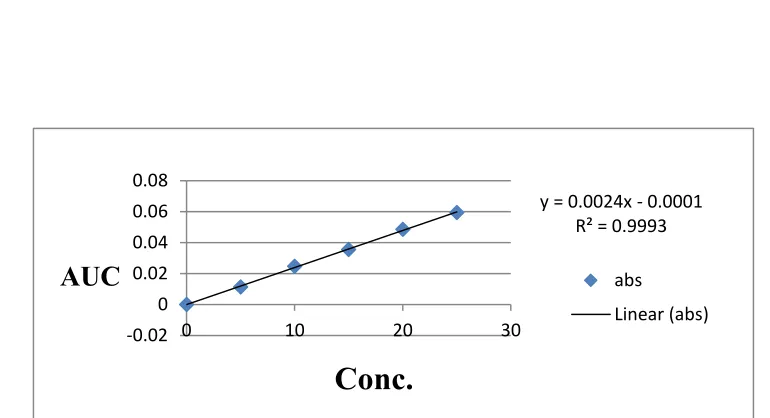
Calibration curve for Ciprofloxacin HCL.
International Journal of Research
Available at http://internationaljournalofresearch.org/p-ISSN: 2348-6848 e-ISSN: 2348-795X Volume 02 Issue 03
April 2015
(Fig. 3).
Fig.3 Linearity of Ciprofloxacin HCL
Assay of tablet formulation
Twenty tablets each containing 250 mg of Ciprofloxacin HCL were weighed crushed to powder and average weight was calculated. Powder equivalent to 10 mg of Ciprofloxacin HCL was transferred in 100 ml of volumetric flask. A 50 ml of distilled water was added and sonicated for 15
minutes. Then solution was further diluted up to the mark with distilled water. The solution was filtered using Whatmann filter paper no. 41; first 5 ml of filtrate was discarded. This solution was further diluted to obtain 15µg/mL solution with water, subjected for UV analysis using distilled water as blank. This procedure was repeated
three times
(Table 1).
Table 1: Assay of tablet dosage form
Sr.No. Sample Solution Concentration (µg/ml)
Amount found
(%) n=3 Mean % found %RSD
1 15 97.27
2 15 98.41 97.98 0.6299
3 15 98.25
*n=3, % RSD = % Relative Standard Deviation.
y = 0.0024x - 0.0001 R² = 0.9993
-0.02 0 0.02 0.04 0.06 0.08
0 10 20 30
AUC
absLinear (abs)
Fig. 4 UV AUC spectrum of Ciprofloxacin HCL dosage form (15µg/ml)
Method validation:-
The above method was validated for various parameters such as Accuracy, Linearity, Precision, Limit of detection (LOD) and Limit of Quantitation (LOQ) according to ICH guideline.(23)
Accuracy
The accuracy for the analytical method was evaluated at 80%, 100% and 120% levels of 20µg/ml standard solution. Area under curve (AUC) was measured in wavelength range 270-278 nm and results were obtained in terms of percent recovery. Three determinations at each level were performed and % RSD was calculated for each level (22)
Table 2: Accuracy results for Ciprofloxacin HCL.
Accuracy
level Sample conc (µg/ml)
Std. conc Total amount. Added (µg/ml)
%
Recovery RecoveryMean % % RSD
80 15 12 27 98.47
100 15 15 30 99.18 99.26 0.8443
120 15 18 33 100.14
Precision
The precision of an analytical procedure expresses the closeness of an agreement (degree of scatter) between a series of measurements obtained from multiple sampling of the same homogeneous sample
International Journal of Research
Available at http://internationaljournalofresearch.org/p-ISSN: 2348-6848 e-ISSN: 2348-795X Volume 02 Issue 03
April 2015
20µg/ml concentration on three consequent days. The %RSD Was calculated. Table 3: Precision results forCiprofloxacin HCL.
Parameter Intra day Inter-day
Sample sol conc 20 20
AUC (mean +-S.D) 0.0427 0.0489
%RSD 0.9734 0.5142
Linearity and Range
The linearity was determined by using working standard solutions between 05-25 µg/ml. The areas under curve (AUC) of these solutions were recorded. Calibration
curve of area under curve to concentration plotted on excel sheet and linear regression was performed. The correlation coefficient, regration Equation was calculated.
(Fig. 3)
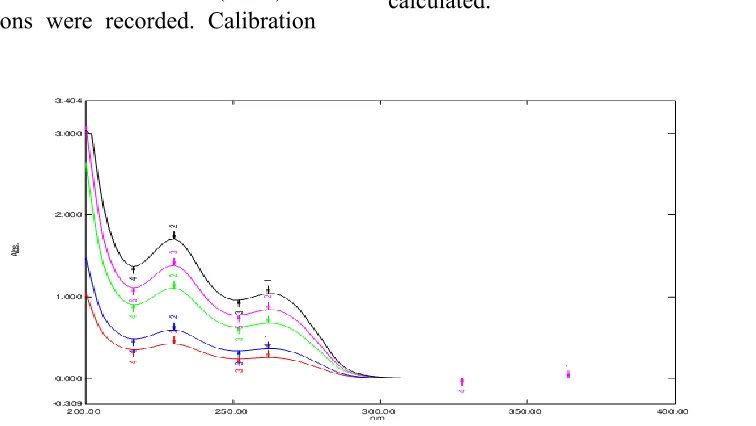
Fig.5 Overlay of Ciprofloxacin HCL spectra at diff. Concentration.
Limit of Detection and Limit of Quantification:
The Limit of Detection (LOD) is the smallest concentration of the analyte that gives the measurable response. LOD was calculated using the following formula
LOD = 3.3 σ /S
The Limit of Quantification (LOQ) is the smallest concentration of the analyte, which gives response that can be accurately
quantified. LOQ was calculated using the following formula
LOQ = 10 σ/S
Where, σ is standard deviation of the response and
S is the slope of the calibration curve.
Five sets of known concentrations (05-25µg/ml) were prepared and scanned. By using these spectras, regression equations were obtained. By taking average of slopes
and standard deviation of y-intercept, LOD and LOQ were calculated. The values of LOD and LOQ are given in table 4.
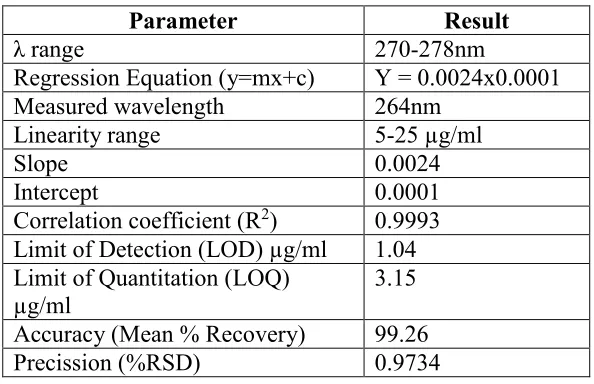
Table 4: Summary of validation parameters
Parameter Result
λ range 270-278nm
Regression Equation (y=mx+c) Y = 0.0024x0.0001 Measured wavelength 264nm
Linearity range 5-25 µg/ml
Slope 0.0024
Intercept 0.0001
Correlation coefficient (R2) 0.9993 Limit of Detection (LOD) µg/ml 1.04 Limit of Quantitation (LOQ)
µg/ml 3.15
Accuracy (Mean % Recovery) 99.26 Precission (%RSD) 0.9734
RESULTS AND
The UV visible spectroscopic method for the Ciprofloxacin HCL by area under curve was found to be simple, accurate, economical and reproducible. The drug concentrations were found to be linear in the range of 05-25 µg/ml and the correlation coefficient value of 0.9993 indicates that developed method was linear. For Precision the percent relative standard deviation (% RSD) was found to be 0.9734 while, intra-day and inter-day precision results in terms of percent relative standard deviation values were found to be 0.9734 and 0.5142 respectively thus the method is observed as precise. The accuracy of the method was assessed by recovery studies at three different levels i.e. 80%,
deviation were satisfactory and the recovery studies were close to 100%. The % RSD value is ≤ 2 indicates the accuracy of the method. The Limit of Detection and Limit of Quantitation values were found to be 1.04µg/ml & 3.15µg/ml respectively. The result of the analysis for pharmaceutical formulation by the developed method was consistent with the label claim, highly reproducible and reliable. The validation parameters are summarized in Table 4. The method can be used for routine quality control analysis of Ciprofloxacin HCL in bulk and pharmaceutical formulations.
CONCLUSION:-
International Journal of Research
Available at http://internationaljournalofresearch.org/p-ISSN: 2348-6848 e-ISSN: 2348-795X Volume 02 Issue 03
April 2015
for assay of bulk drug and pharmaceutical dosage formulations.
ACKNOWLEDGEMENT:-
The authors sincerely thanks to D.S.T.S college of pharmacy solapur Maharashtra, India for providing experimental facilities to carry out this work.
REFERENCES:-
[1]. Lachman L, Liberman HA, Kanig JL, The Theory and Practice of Industrial Pharmacy, 3rd edition, Varghes Publishing House, Bombay, 1987, 453-
456.
[2]. Li VHK, Lee VHL, Controlled Drug Delivery: Fundamentals and Applications, 2nd edition, Marcel Dekker Inc., New York, 2005,4-36.
[3]. Lee TWY ,Robinson JR, Controlled Release Drug Delivery System, Remington: The Science and Practice of the Pharmacy, 20th edition, B.I. Publication Pvt. Ltd., Noida, 2000, 03-906.
[4]. Ansel CH, Pharmaceutical Dosage Forms and Drug Delivery System, 6th edition, Williams and Wilkins, USA,1995, 213-216.
[5]. Parmar NS, Shiv Prakash, Biopharmaceutical and Pharmacokinetic Consideration in Development ofControlled Release Drug Products:Controlled and Novel Drug Delivery; 1st edition, CBS Publisher and Distributor, New Delhi, 1997, 1-16.
[6]. Vyas SP, Khare RK, Controlled Drug Delivery Concept and Advances, 1st edition, Vallabh Prakashan, New Delhi, 2000, 54, 155-158
[7] SC Sweetman. Martindale, The Complete Drug Reference, 35th Edition, The Pharmaceutical Press, London,
Chicago, 2007; 220, 755.
[8] JH Block; JM Beale. Wilson and Gisvold’s Textbook of Organic Medicinal and Pharmaceutical Chemistry, 11thedition, Lippincott Williams & Wilkins,
Philadelphia, 2004; [9] BS Nagaralli; J Seetharamappa; MB
Melwanki. J. Pharm. Biomed. Anal., 2002, 29, 859 – 864.
[10]MI Pascual-Reguera; GP Parras; AM Daz. Microchem. J., 2004, 77, 79 – 84. [11] A Navalόn; O Ballesteros; R Blanc; JL Vílchez. Talanta, 2000, 52, 845 – 852. [12] C Tong; X Zhuo; Y Guo; Y Fang. J.
Lumin., 2010, 130, 2100 – 2105.
[13] J Sousa; G Alves; A Fortuna; A Pena; C Lino; A Falcao. Biomed. Chromatogr., 2011, 25(5), 535 – 541.
[14] C Grondin; W Zhao; M Fakhoury; E Jacqz-Aigrain. Biomed. Chromatogr., 2011, 25(7), 827 – 832.
[15] T Saffaj; M Charrouf; A Abourriche; Y Aboud; A Bennamara; M Berrada. Dyes
Pigm., 2006, 70, 259 – 262.
[16]MR El-Ghobashy; NF Abo-Talib. J.
Adv. Res., 2010, 1(4), 323 – 329.
[16]C Sagan; A Salvador; D Dubreuil; PP Poulet; D Duffau; I Brumpt. J. Pharm.
Biomed. Anal., 2005, 38, 298 –
306.
[17]N Tavakoli; J Varshosaz; F Dorkoosh; MR Zargarzadeh. J. Pharm. Biomed. Anal., 2007, 43, 325 – 329.
[18]MA Mahrouse; EF ElKady. Chem.
Pharm. Bull., 2011, 59(12), 1485-1493.
[19]EF ElKady; MA Mahrouse.
Chromatographia, 2011, 73, 297 – 305.
[20]R Kumar; H Singh;P Singh. J. Chem.
Pharm. Res., 2011, 3(2), 113-117.
[21]MA Dhage; GS Chhabra; S K Banerjee.
J. Chem. Pharm. Res., 2011, 3(2), 765-769.
[22]K Divya; B Narayana. J. Chem. Pharm.
[23]R Patel; EVS Subrahmanyam; AR Sharbaraya. J. Chem. Pharm. Res., 2012, 4(9), 4342-4351.
[24]RI EL-Bagary; NF Abo-talib; MBN Eldin. J. Chem. Pharm. Res., 2011, 3(6), 562-570.
[25]F Salinas; JB Nevado; MA Espinosa.
Talanta., 1990, 37(3), 347–51.
[26]RI El-Bagary; HM Hashem; WA Ebeid.
J. Chem. Pharm. Res., 2011, 3(4), 722-733.
[27] JM Gracía; O Hernández; AI Jiménez; F Jiménez; JJ Arias. Anal. Chim. Acta., 1995,317,83 – 93.
[28]Q2 (R1) Validation of analytical procedures, Proceedings of the International Conference on Harmonisation(ICH), Geneva. Commission of the European Communities (1996).
[29] Lachman L, Liberman HA, Kanig JL, The Theory and Practice of Industrial Pharmacy, 3rd edition, Varghese Publishing House, Bombay, 1987, 453-456.
[30] Li VHK, Lee VHL, Controlled Drug Delivery: Fundamentals and Applications, 2nd edition, Marcel Dekker Inc., New York, 2005,4-36.