ISSN 2286-4822
www.euacademic.org DRJI Value: 5.9 (B+)
Analytical Method Development and Validation of
Multicomponent Mucolytic Action in
Pharmaceutical Formulation by Using HPLC
Techniques
ALI NASER NAYEF
Dentistry College, Kerbala University Kerbala, Iraq
Abstract:
In the present work, we have successfully developed analytical methods namely HPLC for bulk and formulation. The proposed RP-HPLC methods were simple, accurate, precise, rapid, specific and highly sensitive; developed and validated for the determination of GEM and AMB in bulk and in dosage form. The results were comparable with the corresponding labeled amounts. Hence, the proposed method can be successfully used for routine quality control analysis of pharmaceutical formulation and bulk drug in marketed preparations.
Gemifloxacin, aflouroquinoline derivative has antibacterial activity. Ambroxol dibromoaminobenzyl derivative, GEM and AMB are available in tablet dosage form (G-cin A,lupin) for mucolytic action. The present work dealt with simultaneous estimation of GEM and AMB from bulk and tablet formation by RPHLC. The developed HPLC method was validated in terms of accuracy, repeatability, and precision.
Key words: Gemifloxacin (GEM), Ambroxol (AMB), HPLC high performance liquid chromatography, Mucolytic action.
1. INTRODUCTION
analytical method to many kinds of application fields. HPLC overcome many of these difficulties and provide excellent resolution with high speed and sensitivity for separating the types of compounds mentioned above. This technique can be useful not only in agricultural chemistry but also in inorganic, bioclinical and environmental chemistry.
Gemifloxacin (GEM) and Ambroxol (AMB) combination is recently been approved for Mucolytic action[1]. The present
project utilizes the need and requirement for quality control of new combination of drugs in market and maintain the quality of marketed formulations.
A good method linear relationship was observed for GEM in concentration ranges of (10 – 60 µg/ml) .the correlation coefficients for GEM was found to be (0.9991).
The inter – day and intra – day precision results were good enough to indicate that the proposed method was precise and reproducible. The assay experiment showed that the content of GEM estimated in the tablet dosage form was free from the interferences of percipients.
Heinanen M. Barbas. et al, reported HPLC determination of ambroxol hydrochloride in human plasma and pharmacokinetics[1]Column used is 5 m Beckman – Ultrasphere ODS column (25cm 4.6mm i.d) with distilled water/phosphate buffer of pH 7 (73:27) as mobile phase at 1ml/min and detection at 246 nm.
Zarzuelo, A. et al, developed Reversed phase HPLC method for the determination of ambroxol in human plasma[2]Column used is 5 m Resolve C18 column (25cm 4.6mm
i.d) operated at 250C with acetonitrile/distilled water/10mM – phosphate buffer of pH 7/THF (14:14:11:1) as mobile phase at 1.5 ml/min and detection at 242 nm.
/10mM – diammonium phosphate buffer (7:3) adjusted to pH 6 with phosphoric acid as a mobile phase and detected at 247 nm. Martinez –Lozano. et al, reported Anodic voltammetric behavior of ambroxol at carbon paste electrode behavior of ambroxol at carbon paste electrode[4] Portions of a standard
ambroxol hydrochloride (I) solution were mixed with 0.5M – sulfuric acid and mixed solution was transferred to an electrochemical cell combined with a carbon paste-working electrode. Anodic voltammetry was performed and the peak current was measured at 1.1V (Vs SCE).
Demircigil, B. T. et al, reported Flow – injection analysis of ambroxol in pharmaceutical tablet [5]Portions of an
aqueous extract of tablet containing known amount of ambroxol (I), was injected into a fused – silica capillary (75 in i.d.) having been previously washed with distilled water, water, 0.1M – Phosphoric acid, and 0.1M NaOH. Water is used as a solvent and the absorbance of the resulting stream was monitored at 209 nm.
2. EXPERIMENTAL PART
2.1 Apparatus:-
Model: Jasco HPLC LC-2000 plus series Specification: Isocratic mode
Pump: Jasco PU-2080Plus reciprocating intelligent pump UV Detector: Jasco UV-2075 Plus detector
Column: C18 Column
2.3 Selection of Mobile phase: The pure drug of Gemiifloxacin was injected into the HPLC system and run in different solvent systems. Different mobile phases like methanol and water, acetonitrile and water, , methanol and 0.01M potassium dihydrogen orthophosphate buffer (KH2PO4) were tried in order to find the best conditions for the separation of Gemifloxacin so it was found that Methanol and 7% formic acid gives satisfactory results as compared to other mobile phases.. It was found that finally, mobile phase was determined to be methanol: 7% formic acid (80: 20v/v).
2.4 Preparation of Mobile phase: 7% Formic acid was prepared by dissolving accurately about 7 ml of formic acid in 100ml of glass double distilled water. Mobile phase was prepared by mixing( 400ml of Methanol and 100ml of Formic acid) and its PH is adjusted to 2.1 This mobile phase was ultrasonicated for 20 min. and it was filtered through 0.45 μm Nylon 6.6(N66) 47 mm membrane filter paper.
2.5 Preparation of standard stock solution: Accurately about 10mg of Gemifloxacin was weighed and transferred to two separate 100ml volumetric flask. The drugs were dissolved in 50 ml of mobile phase with shaking and then volume was made up to the mark with mobile phase to get 100μg/ml of standard stock solution of drug. This stock solution was filtered through 0.2μ Nylon 6.6 (N66) membrane filter.
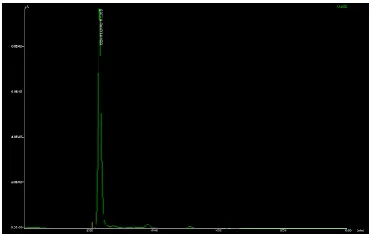
2.7 Chromatographic condition: The optimum composition of the mobile phase containing Methanol and 7% formic acid (80:20v/v) and its PH adjusted to 2.1 was selected because it was found ideally resolve the peaks of GEM .The flow rate was set to 1.0ml/min and UV detection was carried out at 260 nm. The mobile phase and samples were degassed by ultrasonic vibration for 20 min. and filtered through 0.45μm Nylon 6.6 (N66) 47 mm filter paper. All determination was performed at constant room temperature.
Figure 2.1 A Typical Chromatogram of Gemifloxacin
3. METHOD VALIDATION
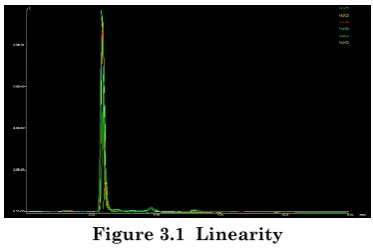
range of 10-60 mcg/ml for GEM. The linearity of calibration graph and adherence of the system to Beer’s law was validated by high value of correlation coefficient and also standard deviation (S.D) for intercept value was less than 2%.
Figure 3.1 Linearity
Table 3.1 Observation table for calibration curve of GEM Conc. mcg/ml Peak area
10 120956
20 207321
30 340723
40 452187
50 538765
60 659876
Figure 3.2 Calibration curve of GEM
Table 3.2 Validation and System suitability parameter Parameters GEM
Linearity range(mcg/ml) 10-60 mcg/ml
Slope 194470
Retention time 2.36 Tailing factor 0.75 Limit of detection(mcg/ml) 0.05 Limit of Quantitation(mcg/ml) 0.17 Theoretical plate no. 18000
3.2. Limit of Detection (LOD) and Limit of Quantitation (LOQ):
LOD is the lowest amount of an analyte in a sample that can be detected but not necessarily quantitated an exact value. LOQ is the lowest amount of an analyte in a sample that can be quantitatively determined with suitable precision and accuracy.
3.3 x D, LOD = S,10 x D, LOQ = S
Where, D = standard deviation of the y-intercepts of regression line. S = slope of the calibration curve.
3.3. Specificity: The specificity of the HPLC method was determined by complete separation of GEM as shown in Figure with parameters like retention time (tR), Resolution (RS) and tailing factor (Tf). Here tailing factor for peak of GEM was less than (2%) and Resolution was satisfactory. The peak obtained for GEM was sharp and have clear baseline separation.
range for each drug containing 32 mcg/ml of GEM. System repeatability was determined by six replicate application and three times measurement of sample solution at the analytical concentration. The repeatability of sample application and measurement of peak area for each drug were calculated by repeating the assay three times of six replicate dilutions of the same concentration in the same day for intraday precision. Interday precision was obtained by the assay of six sample sets on different days. The results are shown below:
Table 3.3 Intra-day precision
Drug % mean* S.D % RSD S.E
GEM 100.3 1.6075 1.6026 0.09 *n=3
Table 3.4 Inter-day precision
Drug % mean* S.D % RSD S.E
GEM 99.67 0.7916 0.7942 0.2209
3.5 Accuracy (Recovery studies): The solutions for recovery studies at 80%, 100% and 120% level were prepared in the same manner as given under simultaneous equation method. But in the method mobile phase was used as solvent. These solutions were filtered through 0.2μ m Nylon 6,6 (N66) 47 mm membrane filter paper. The solution was analyzed by RP-HPLC method as described above. The results for recovery studies and statistical evaluation are shown below:
Table 3.5 Recovery studies
Level of % Recovery
Amount present(mg/tab)
Amount of standard added(mg/tab)
Total amount recovered(mg)
% Recovery*
GEM GEM GEM GEM
80 320 256 575.59 99.93
100 320 320 638.84 99.82
Table 3.6 Statistical validation: Component Mean Standard
Deviation
Coefficient of Variation
Standard Error
GEM 99.98% 0.011 0.0112 0.1
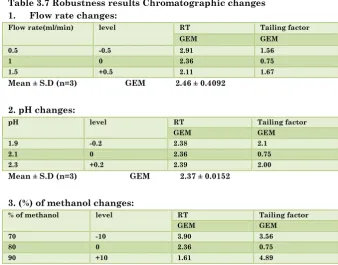
3.6 Robustness of method: The evaluation of robustness should be considered during the development phase and depends upon the type of procedure under study. It should show the reliability of an analysis with respect to deliberate variations in the method parameters. The parameters included pH mobile phase, flow rate, percentage of Methanol in the mobile phase. The solution containing 32 mcg/ml of GEM was injected into sample injector of HPLC three times under different parameters like variation in pH, flow rate, percentage of Methanol in the mobile phase. The results are shown in table below:
Table 3.7 Robustness results Chromatographic changes 1. Flow rate changes:
Flow rate(ml/min) level RT Tailing factor
GEM GEM
0.5 -0.5 2.91 1.56
1 0 2.36 0.75
1.5 +0.5 2.11 1.67
Mean ± S.D (n=3) GEM 2.46 ± 0.4092
2. pH changes:
pH level RT Tailing factor
GEM GEM
1.9 -0.2 2.38 2.1
2.1 0 2.36 0.75
2.3 +0.2 2.39 2.00
Mean ± S.D (n=3) GEM 2.37 ± 0.0152
3. (%) of methanol changes:
% of methanol level RT Tailing factor
GEM GEM
70 -10 3.90 3.56
80 0 2.36 0.75
4. ESTIMATION OF GEM FROM PHARMACEUTICAL DOSAGE FORM (ASSAY OF TABLET)
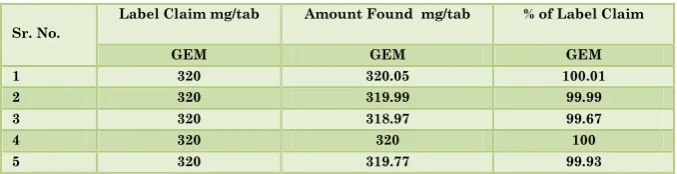
The tablet solution was prepared in the same manner as described in precision method. This tablet solution was further diluted with mobile phase to obtained sample solutions in Beer Lamberts’ range for drug containing 32 mcg/ml of GEM. A 20 μl volume of sample solution was injected into sample injector of HPLC six times under chromatographic conditions as described above. Area of each peak was measured at 260 nm. The amount of each drug present in the sample (n=5) as determined from peak area of GEM present in the pure mixture.
Table 4.1 Analysis of tablet formulation
Sr. No.
Label Claim mg/tab Amount Found mg/tab % of Label Claim
GEM GEM GEM
1 320 320.05 100.01
2 320 319.99 99.99
3 320 318.97 99.67
4 320 320 100
5 320 319.77 99.93
Table 4.2 Statistical validation Component Mean Standard
Deviation
Coefficient of Variation
Standard Error
GEM 99.92 0.1431 0.1432 0.06404
5. RESULTS AND DISCUSSION
HPLC method was developed, validated and used for quantitative determination of Gemifloxacin mesylate (GEM) formits tablet dosage form. Chromatographic separation was performed on Grace C18 colum (250 mm × 4.6 mm, 5 μm), with
with detection at 260 m with Rt 2.36 min. Separation was
completed in less than 10 min. As per (1CH) guidelines the method was validated for lineary, accuracy, precision, limit of quantitation, limit of detection, and robustness.
Linearity of GEM was found to be in the range of 10-60 μg/ml. the correlation coefficient was 0.9991. The results of tablet analysis (n=5) were found to be 99.92% with ± 0.1431% standard deviation for GEM .Percent recovery of GEM was found to be 99.98%. The assay experiment shows that the method is free of excipients, hence the method is specific.
REFERENCES
1. Heinanen. M., Barbas, C. J.pharm. Biomed and March, 2001, 24(5-6), 1005-1010.
2. Zarzuelo, A., Sayalora, M.L., Lopez, F.G., Lanao, J.M. J. Liq.
Chromatogr Relat. Technol., Apr 2001,24(7), 1007-1014.
3. Benli, P, Tuncel, M. Pharmazie,Mar.1998 53(3),203-204. 4. Martinez-Lozano, C., Sanz, A., Branvo, E. J. Chromatogr, B:
Biomed. Appl, 25 Apr 1997, 692(1), 199-205.
5. Demircigil, B.T., Uslu, B., Ozkan-Y., Ozkan, S.A., Sentnerk, Z. Electroanalysis (N.Y.), Feb. 2003, 15(3),230 – 234.
6. Skoog, D.A., Holler, F.J., Timothy, A., Nieman, In: Principals of instrumental Analysis, 5thedition, M. Sherman, J, Bortel, F. Messina (EDS), Saunders College Publication, London, (1998) 3.
7. Jeffery, G.H., Bassat, J. Mendham, J. Denny, R.C. In: Vogel’s Textbook of Qualitative Chemical Analysis, 5thEdition, Atkin, Hill, Holman, Furniss (Eds), ELB Swithlongman Publication, Harlow, (1989) 3.
9. ICH, Q2A, Text on Validation of Analytical Procedures, International Conference on Harmonization, Geneva, October 1994, 1-5.
10.ICH, Q2B, Validation of Analytical Procedures: Methodology, International Conference on Harmonization, Geneva, November, 1996, 1-8.
11. Skoog, D.A. West, D.M., Holler, F.J. in: Analytical Chemistry introduction, 6thedition, M.innuzzi, D.Hardin, (Eds), Saunders College Publication Philadelphia (1993) 3.572.432. 12. Bauman, R.Y., Absorption Spectroscopy, John Wiley and., Sonsinc New York, (1962) 569,405.
13. Ronald, C., Danny, Roy, Sinclair, in: Visible And Ultra – violet Spectroscopy, Analytical Chemistry by open learning 1st Edition, D. Mowthorpe edr),John & Wiley and Sons, Singapore, (1991) 116,120.
14. Shah, Y.I., Paradkar, A.R., Dhayagude, M.G. in: Introduction to Biostatistics and Computer Science, Nirali Prakashan, Pune (1996)56.