Scholarship@Western
Scholarship@Western
Electronic Thesis and Dissertation Repository
4-20-2012 12:00 AM
Anatomy: The Relationship Between Internal and External
Anatomy: The Relationship Between Internal and External
Visualizations
Visualizations
Ngan T. Nguyen
The University of Western Ontario
Supervisor
Dr. Timothy D. Wilson
The University of Western Ontario Joint Supervisor Dr. Andrew J. Nelson
The University of Western Ontario
Graduate Program in Anatomy and Cell Biology
A thesis submitted in partial fulfillment of the requirements for the degree in Doctor of Philosophy
© Ngan T. Nguyen 2012
Follow this and additional works at: https://ir.lib.uwo.ca/etd
Part of the Anatomy Commons
Recommended Citation Recommended Citation
Nguyen, Ngan T., "Anatomy: The Relationship Between Internal and External Visualizations" (2012). Electronic Thesis and Dissertation Repository. 468.
https://ir.lib.uwo.ca/etd/468
This Dissertation/Thesis is brought to you for free and open access by Scholarship@Western. It has been accepted for inclusion in Electronic Thesis and Dissertation Repository by an authorized administrator of
(Spine title: Internal and external visualizations)
(Thesis format: Integrated Article)
by
Ngan T. Nguyen
Graduate Program in Anatomy and Cell Biology
A thesis submitted in partial fulfillment of the requirements for the degree of
Doctor of Philosophy
The School of Graduate and Postdoctoral Studies The University of Western Ontario
London, Ontario, Canada
ii
THE UNIVERSITY OF WESTERN ONTARIO School of Graduate and Postdoctoral Studies
CERTIFICATE OF EXAMINATION
Supervisor
______________________________ Dr. Timothy D. Wilson
Co-Supervisor
______________________________ Dr. Andrew J. Nelson
Supervisory Committee
______________________________
Examiners
______________________________ Dr. Peter Haase
______________________________ Dr. Peter Merrifield
______________________________ Dr. Dan Belliveau
______________________________ Dr. Mark Terrell
The thesis by
Ngan T. Nguyen
entitled:
Anatomy: The Relationship Between Internal and External
Visualizations
is accepted in partial fulfillment of the requirements for the degree of
Doctor of Philosophy
iii
Abstract
This dissertation explored the relationship between internal and external visualizations and the implications of this relationship for comprehending visuospatial anatomical information. External visualizations comprised different computer representations of anatomical
structures, including: static, animated, non-interactive, interactive, non-stereoscopic, and stereoscopic visualizations. Internal visualizations involved examining participants’ ability to apprehend, encode, and manipulate mental representations (i.e., spatial visualization ability or Vz). Comprehension was measured with a novel spatial anatomy task that involved mental manipulation of anatomical structures in three-dimensions and two-dimensional
cross-sections. It was hypothesized that performance on the spatial anatomy task would involve a trade-off between internal and external visualizations available to the learner.
Results from experiments 1, 2, and 3 demonstrated that in the absence of computer visualizations, spatial visualization ability (Vz) was the main contributor to variation in spatial anatomy task performance. Subjects with high Vz scored higher, spent less time, and were more accurate than those with low Vz. In the presence of external computer
visualizations, variation in task performance was attributed to both Vz and visuospatial characteristics of the computer visualization. While static representations improved
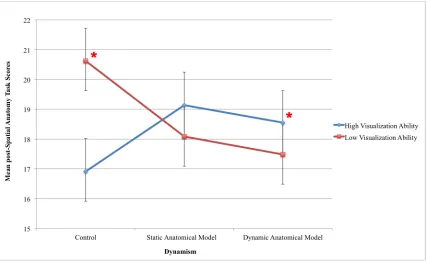
performance of high- and low-Vz subjects equally, animations particularly benefited high Vz subjects, as their mean score on the SAT was significantly higher than the mean score of low Vz subjects. The addition of interactivity and stereopsis to the displays offered no additional advantages over interactive and stereoscopic visualizations. Interactive,
non-interactive, stereoscopic and non-stereoscopic visualizations improved the performance of high- and low-Vz subjects equally.
It was concluded that comprehension of visuospatial anatomical information involved a trade-off between the perception of external visualizations and the ability to maintain and manipulate internal visualizations. There is an inherent belief that increasing the educational effectiveness of computer visualizations is a mere question of making them dynamic,
iv
not the case, and that the benefits of computer visualizations vary according to learner characteristics, particularly spatial visualization ability.
Keywords
Internal visualizations, external visualizations, computer visualizations, spatial visualization ability, visuospatial anatomy comprehension, education, static images, animation,
v
Co-Authorship Statement
The written material in this thesis is the original work of the author. Ngan Nguyen participated in all aspects of the work contained herein: conception of the hypotheses, conduct of the experiments, and authorship of the manuscripts. The roles of the co-authors are detailed below by chapter.
Chapter 2: Experiment 1
The manuscript is published in the journal Anatomical Sciences Education ( 5:2, 98-108, 2012). All authors on the manuscript shared in the conception of this research study. The instructional materials and Spatial Anatomy Task was developed by N.Nguyen. The data for this study was collected, analyzed and interpreted by N. Nguyen. N.Nguyen carried out the composition of the manuscript with inputs from Drs. Wilson and Nelson.
Chapter 3: Experiment 2
Conception of this research study was shared by N.Nguyen, T. Wilson, and A. Nelson. The design of the Matlab testing interface was carried out by N.Nguyen and A.Mulla. The data for this study was collected, analyzed and interpreted by N.Nguyen. Preparation of the manuscript was carried out by N.Nguyen with inputs from Drs. Wilson and Nelson. The manuscript will be submitted to the journal Anatomical Sciences Education.
Chapter 4: Experiment 3
Conception of this research study was shared by N.Nguyen, T. Wilson, and A. Nelson. The design of the Matlab testing interface was carried out by N.Nguyen and A.Mulla. The data for this study was collected, analyzed and interpreted by N.Nguyen. Preparation of the manuscript was carried out by N.Nguyen with inputs from Drs. Wilson and Nelson. The manuscript will be submitted to the journal Anatomical Sciences Education.
vi
Acknowledgments
In retrospect I am surprised, and at the same time, very grateful for all I have received
throughout these years. It has shaped me as a person and has led me to where I am today. It is a pleasure to thank the many people who made this thesis possible.
First and foremost, I offer my sincerest gratitude to my primary supervisor, Dr. Timothy D. Wilson, for supporting me throughout these years with his patience and knowledge whilst allowing me the freedom to explore on my own. Thank you to my secondary supervisor, Dr. Andrew J. Nelson, for providing insightful comments and constructive criticisms that helped me focus my ideas and guided me throughout the writing process.
I would like to show my gratitude to my advisors, Dr. Melvyn A. Goodale and Dr. Mathew Heath, for giving wise advice and helping me sort out the technical details of my work. I would also like to thank Dr. Robert. C. Gardner for assisting with the data analysis, and Sid Bhattacharyya for helping with the development of the computer models.
Dr. Marjorie Johnson and Dr. Peter Haase, thank you for teaching me everything I know about human anatomy, and for showing me what it truly means to be a ‘good teacher.’
I am indebted to my many student colleagues for providing a stimulating and fun
environment in which I studied and grew as an academic. I am especially grateful to Charys Martin and Michele Barbeau for helping me stay sane through these difficult years. Your support and care helped me overcome setbacks and stay focused on my graduate work.
I would like to express my heart-felt gratitude to my partner, Chanrith Yin, for setting me on a pedestal and believing that I can do anything I set my mind to. Thank you to my brothers Samson, Jimmy, and Hung, for providing me with support, protection, and strength
throughout my entire life.
vii
Table of Contents
CERTIFICATE OF EXAMINATION ___________________________________________________________ ii
Abstract _______________________________________________________________________________________ iii
Acknowledgments ___________________________________________________________________________ vi
Table of Contents ____________________________________________________________________________ vii
List of Tables __________________________________________________________________________________ x
List of Figures _________________________________________________________________________________ xi
List of Appendices ___________________________________________________________________________ xii
List of Abbreviations _______________________________________________________________________ xiii
Preface _______________________________________________________________________________________ xiv
Chapter 1 ______________________________________________________________________________________ 1
1 General Introduction ____________________________________________________________________ 1
1.1 Medical Education ___________________________________________________________________________ 1
1.2 Anatomy Education _________________________________________________________________________ 1
1.3 Overview of Dissertation ___________________________________________________________________ 3
1.4 References ____________________________________________________________________________________ 6
Chapter 2 ______________________________________________________________________________________ 8
2 Literature Review ________________________________________________________________________ 8
2.1 Visualization _________________________________________________________________________________ 8
2.2 External visualizations _____________________________________________________________________ 9 2.2.1 Computer visualizations _________________________________________________________________ 9 2.2.2 Comparative research studies __________________________________________________________ 19 2.2.3 Summary _________________________________________________________________________________ 24
viii
2.4 Overview of empirical chapters __________________________________________________________ 31
2.5 Overall aims and hypotheses _____________________________________________________________ 34
2.6 References ___________________________________________________________________________________ 36
Chapter 3 _____________________________________________________________________________________ 44
3 Experiment 1 ____________________________________________________________________________ 44
3.1 Introduction _________________________________________________________________________________ 44
3.2 Materials and methods ____________________________________________________________________ 46 3.2.1 Participants ______________________________________________________________________________ 46 3.2.2 Instructional materials __________________________________________________________________ 46 3.2.3 Performance measures _________________________________________________________________ 48 3.2.4 Study design _____________________________________________________________________________ 48 3.2.5 Data analyses ____________________________________________________________________________ 50
3.3 Results ________________________________________________________________________________________ 50
3.4 Discussion ___________________________________________________________________________________ 58
3.5 Summary _____________________________________________________________________________________ 62
3.6 References ___________________________________________________________________________________ 63
Chapter 4 _____________________________________________________________________________________ 66
4 Experiment 2 ____________________________________________________________________________ 66
4.1 Introduction _________________________________________________________________________________ 66
4.2 Material and methods ______________________________________________________________________ 68 4.2.1 Participants ______________________________________________________________________________ 68 4.2.2 Performance measures _________________________________________________________________ 69 4.2.3 Study design _____________________________________________________________________________ 71 4.2.4 Data analyses ____________________________________________________________________________ 71
4.3 Results ________________________________________________________________________________________ 73
4.4 Discussion ___________________________________________________________________________________ 77
4.5 Summary _____________________________________________________________________________________ 79
4.6 References ___________________________________________________________________________________ 81
Chapter 5 _____________________________________________________________________________________ 83
5 Experiment 3 ____________________________________________________________________________ 83
5.1 Introduction _________________________________________________________________________________ 83
ix
5.2.1 Participants ______________________________________________________________________________ 85 5.2.2 Instructional materials __________________________________________________________________ 85 5.2.3 Performance measures _________________________________________________________________ 86 5.2.4 Study design _____________________________________________________________________________ 87 5.2.5 Data analyses ____________________________________________________________________________ 88
5.3 Results ________________________________________________________________________________________ 89
5.4 Discussion ___________________________________________________________________________________ 94
5.5 Summary _____________________________________________________________________________________ 96
5.6 References ___________________________________________________________________________________ 97
5.1 ____________________________________________________________________________________________________ 98
Chapter 6 _____________________________________________________________________________________ 99
6 General discussion ______________________________________________________________________ 99
6.1 Empirical contributions ___________________________________________________________________ 99
6.2 Contributions to anatomy education __________________________________________________ 103
6.3 Future directions _________________________________________________________________________ 104
6.4 Conclusion _________________________________________________________________________________ 106
6.5 References _________________________________________________________________________________ 108
Appendices _________________________________________________________________________________ 111
x
List of Tables
Table 2.1: Monocular pictorial depth cues (Schwartz, 2010) _________________________________________________ 14
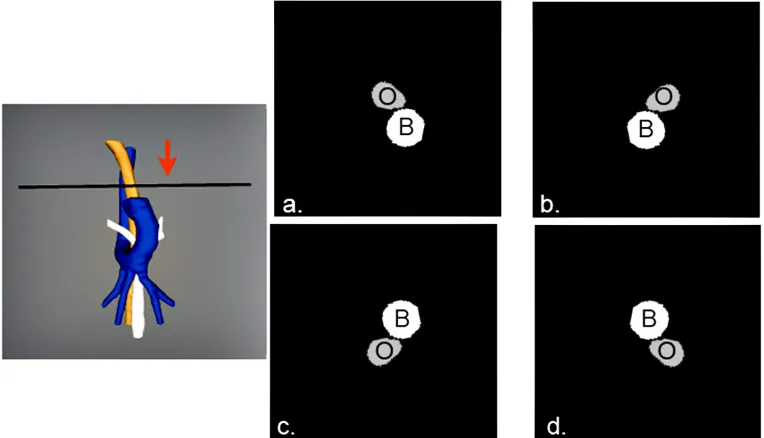
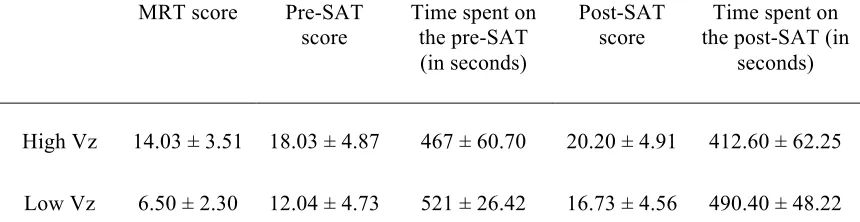
Table 3.1: Descriptive statistics for the MRT, pre-‐SAT, and post-‐SAT for high Vz (N = 30) and low Vz (N = 30) subjects. ________________________________________________________________________________________________ 51
Table 3.2: F-‐statistics for CRF analysis of post-‐SAT scores (with mean pre-‐SAT score as a covariate). ___ 53
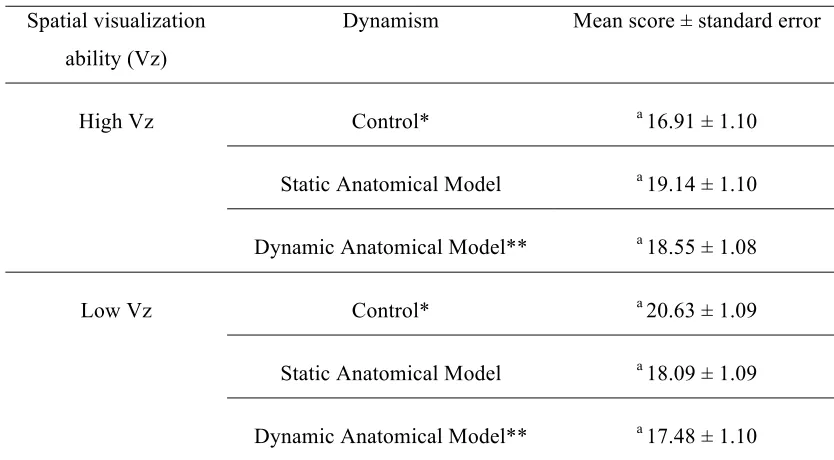
Table 3.3: Mean post-‐SAT scores for all dynamism by Vz level combination. _______________________________ 54
Table 3.4: F-‐statistics for the CRF analysis of time spent on the post-‐SAT (with time spent on the pre-‐SAT scores as a covariate). _____________________________________________________________________________________ 56
Table 3.5: Mean time spent on the post-‐SAT for all dynamism by Vz level combination. ___________________ 57
Table 4.1: Descriptive statistics for the MRT and SAT for high Vz (N = 21) and low Vz (N = 21) subjects. 73
Table 4.2: Correlations between mental rotations task (MRT) scores and SAT scores, amount of time spent on the SAT, and accuracy of SAT responses. ______________________________________________________ 74
Table 4.3: Responses for each answer option as selected by high-‐ and low-‐Vz subject for each multiple-‐ choice question posed in the self-‐reflective questionnaire. _____________________________________________ 77
Table 5.1: Descriptive statistics for the MRT, pre-‐SAT, and post-‐SAT for high Vz (N = 20) and low Vz (N = 20) subjects. ________________________________________________________________________________________________ 89
Table 5.2: F-‐statistics for completely randomized factorial analysis of post-‐SAT scores. __________________ 90
Table 5.3: Mean post-‐SAT scores for all binocular by monocular display level combination. ______________ 90
Table 5.4: F-‐statistics for completely randomized factorial analysis of time spent on the post-‐SAT. ______ 92
xi
List of Figures
Figure 2.1: Motion-‐parallax as a visual cue. ____________________________________________________________________ 15
Figure 2.2: Example of a mental rotations task question ______________________________________________________ 32
Figure 2.3: Example of an identification task question ________________________________________________________ 33
Figure 2.4: Example of a localization task question ____________________________________________________________ 33
Figure 3.1: Screenshot of the anatomical and geometrical models. __________________________________________ 47
Figure 3.2: Flowchart illustrating the procedure for the study. _______________________________________________ 49
Figure 3.4: Scatter plot representing the relationship between pre-‐spatial anatomy task scores and mental rotations task scores. ______________________________________________________________________________ 52
Figure 3.5: Scatter plot representing the relationship between time spent on the pre-‐spatial anatomy task (in seconds) and mental rotations task scores. __________________________________________________________ 52
Figure 3.6: Profile plot of mean post-‐SAT scores as a function of dynamism of the visual display.. _______ 55
Figure 3.7: Profile plot of mean times spent on the post-‐SAT as a function of dynamism of the visual display. ______________________________________________________________________________________________________ 58
Figure 5.1: Flowchart illustrating the procedure for the study. _______________________________________________ 87
Figure 5.2: Profile plot of mean post-‐SAT scores. ______________________________________________________________ 91
Figure 5.3: Profile plot of mean time spent on the post-‐SAT. _________________________________________________ 93
xii
List of Appendices
Appendix A: Ethics approval notice ____________________________________________________________________________ 111 Appendix B: Permission approval notice ______________________________________________________________________ 113 Appendix C: Instructions for the Spatial Anatomy Task -‐ Mental Rotations ________________________________ 114 Appendix D: Spatial Anatomy Task -‐ Mental rotations questions ___________________________________________ 116 Appendix E: Instructions for the Spatial Anatomy Task -‐ Identification ____________________________________ 121 Appendix F: Spatial Anatomy Task -‐ Identification questions _______________________________________________ 123 Appendix G: Instructions for the Spatial Anatomy Task -‐ Localization ______________________________________ 128 Appendix H: Spatial Anatomy Task -‐ Localization questions _________________________________________________ 130 Appendix I: Self-‐reflective questionnaire ______________________________________________________________________ 135 Appendix J: Answer key to the Spatial Anatomy Task questions ____________________________________________ 142
xiii
List of Abbreviations
CF ______________________________Closure Flexibility
CS ______________________________Closure Speed
DOF_____________________________Degree of Freedom
MRT_____________________________Mental Rotations Task
P ________________________________Perceptual Speed
SR ______________________________Spatial Relations
Vz ______________________________Visualization ability or spatial visualization ability
SAT______________________________Spatial Anatomy Task
CRF______________________________Completely Randomized Factorial
xiv
Preface
“ Wisdom is not a product of school but of the lifelong attempt to
acquire it.”
Chapter 1
1
General Introduction
1.1 Medical Education
The primary goal of medical education is to teach students how to perform clinical procedures with minimum risks and maximum benefits to patients. Since patients are three-dimensional (3-D) entities, healthcare and medical education often involve learning and applying 3-D information (Marks, 2000). A cornerstone in the foundation begins in anatomy courses, where, in addition to terminology, students learn visuospatial
information, including the shape of anatomical structures, their position in 3-D space, and their location relative to other structures. When carrying out medical procedures, often the internal structures of the patient’s body are not directly visible, so that medical
professionals have to rely on internal or mental representations of visuospatial anatomical information.
1.2 Anatomy Education
Given the importance of visuospatial information in medicine, educators have
many medical schools in both the United States and Canada have experienced a decrease in curriculum hours compounded by a scarcity of donated bodies and reduced supply of, and demand for, instructors who can teach gross cadaveric dissection (Collins et al., 1994; Cottam, 1999; Drake et al., 2009; Gregory et al., 2009). These conditions, in turn, have resulted in either an unacceptable student-cadaver ratio or the elimination of dissection altogether. In the former scenario, dissection becomes an inefficient learning tool, and in the latter condition the elimination of dissection precipitates total reliance on other forms of instruction in anatomy (Prentice et al., 1977; Rizzolo et al., 2006)
With the development in graphical technologies and widespread availability of
computers, computerized representations of anatomy have become prevalent in all levels of medicine and allied health sciences – from undergraduate anatomy education to surgical training. Compared to real world objects, computer visualizations offer
advantages in terms of accessibility, convenience, cost, safety, and versatility (Aziz et al., 2002; McLachlan et al., 2004; McLachlan and Patten, 2006). As a result, medical
education has begun a dramatic shift towards introducing computer visualizations into its learning program with the intention that they will “enhance” or “amplify” cognition (Keehner et al., 2008; AFMC, 2010). The ability to communicate anatomical information visually has extended from static (or non-dynamic) to animated (or dynamic)
representations, non-interactive to interactive displays, and non-stereoscopic to stereoscopic visualizations (Khalil et al., 2005; Luursema et al., 2006). Many benefits have been claimed for interactive and dynamic visualizations. These include the belief that (a) 3-D visualizations are better than 2-D images, (b) animations are better than static representations, (c) interactive visualizations are better than non-interactive ones, and (d) virtual reality simulations based on stereoscopic images are better than animations (Scaife and Rogers, 1996).
Such generalizations about the benefits of technologically-advanced visualizations over simple static representations beg the question however, what is actually gained
facilitating the acquisition of visuospatial anatomical knowledge than static diagrams available in traditional anatomy textbooks or atlases? Why not the other way around, where static diagrams are more effective than animations or non-interactive visualizations are better interactive ones?
Despite much optimism about their educational potential, our understanding of the instructional value of different computer visualizations is relatively limited. Within cognitive science, there is mounting evidence that the effectiveness of instructional visualizations depends on how well their design reflect human cognitive architecture (Mayer, 2005). Specifically, the educational value of these visualizations depends on whether learners have enough cognitive resources (i.e., working memory and long-term memory) to construct, maintain, and integrate information in the external display
(Sweller et al., 1998; Mayer, 2005). Therefore, within cognitive science there has been a move towards examining the relationships between external visualizations and internal thought process and to explore a full range of factors that affect learning from computer visualizations (Zhang and Norman, 1994; Zhang et al., 2002; Hegarty et al., 2007; Keehner et al., 2008). A striking finding from cognitive research studies is that computer visualizations are not equally effective for all learners, and that task performance often involves a tradeoff between internal and external resources available to the learner. On the one hand, different characteristics of the learner (e.g., prior knowledge, spatial ability, and motivation) can mean that more or less cognitive resources are devoted to the main instructional task. On the other hand, different characteristics of the external computer visualization can mean that more or less task load is carried out internally.
1.3 Overview of Dissertation
cognition is exclusively in the mind, and external objects, if they had anything to do with cognition at all, are at most peripheral aids (Zhang and Norman, 1994). Giving external computer visualizations a more central functional role in relation to internal
visualizations allows us to account more adequately for how the representational system works (Scaife and Rogers, 1996). The value of this approach is that it allows us to focus our attention more on the properties of the internal and external visualizations and
cognitive processing involved when interacting with visual representations. In addition to enabling us to better understand the cognitive value of different graphical representations, this approach also allows us to begin to assess more effectively how instructional
innovation in anatomy education should be approached.
The remainder of this dissertation is divided into five chapters:
Chapter 2 is the literature review. It begins with an operational definition of
‘visualization’ and outlines the differences between internal and external visualizations. Next, the properties of external computer visualizations used in anatomy courses (static, dynamic, stereoscopic, monocular, interactive, and non-interactive) are described followed by a review of previous research studies evaluating their educational effectiveness. Finally, the role of internal spatial visualization ability, a sub-factor of spatial ability, is examined along with a review of previous literature describing its role in anatomy education.
Chapters 3 – 5 are three experiments in this dissertation. Experiment 1 examines whether spatial visualization ability influences performance on a novel spatial anatomy task and whether the effects of spatial visualization ability could be modulated through instruction with different computer visualizations. Experiment 2 examines the problem solving strategies of individuals with high and low spatial visualization ability in order to determine whether differences in strategies contribute to differences in anatomy task performance. Experiment 3 examines whether increasing the realism of the display will inherently improve the educational effectiveness of the computer visualization.
1.4 References
AFMC. 2010. The future of medical education in Canada (FMEC): A collective vision for MD Education. In. Ottawa: The Association of Faculties of Medicine of Canada (AFMC)
Aziz MA, McKenzie JC, Wilson JS, Cowie RJ, Ayeni SA, Dunn BK. 2002. The human cadaver in the age of biomedical informatics. Anat Rec 269:20-32.
Collins TJ, Given RL, Hulsebosch CE, Miller BT. 1994. Status of gross anatomy in the U.S. and Canada: Dilemma for the 21st century. Clin Anat 7:275-296.
Cottam WW. 1999. Adequacy of medical school gross anatomy education as perceived by certain postgraduate residency programs and anatomy course directors. Clin Anat 12:55-65.
Drake RL, McBride JM, Lachman N, Pawlina W. 2009. Medical education in the
anatomical sciences: The winds of change continue to blow. Anat Sci Educ 2:253-259.
Gregory JK, Lachman N, Camp CL, Chen LP, Pawlina W. 2009. Restructuring a basic science course for core competencies: An example from anatomy teaching. Med Teach 31:855-861.
Hegarty M, Keehner M, Cohen C, Montello DR, Lippa Y. 2007. The role of spatial cognition in medicine: Applications for selecting and training professionals. In: Allen GL, editor. Applied Spatial Cognition: From Research to Cognitive
Technology. 1st Ed. Mahwah, NJ: Lawrence Erlbaum Associates, Inc. p 285-316.
Keehner M, Khooshabeh P, Hegarty M. 2008. Individual differences among users: Implications for the design of 3D medical visualizations. In: Dong F, Ghinea G, Chen SY, editors. User Centered Design for Medical Visualization. Hershey, PA: Information Science Reference, an imprint of IGI Global. p 1-24.
Luursema JM, Verwey WB, Kommers PAM, Geelkerken RH, Vos HJ. 2006. Optimizing conditions for computer-assisted anatomical learning. Interacting with Computers 18:1123-1138.
Marks SC, Jr. 2000. The role of three-dimensional information in health care and medical education: The implications for anatomy and dissection. Clin Anat 13:448-452.
Mayer R. 2005. The Cambridge Handbook of Multimedia Learning. New York: Cambridge.
McLachlan JC, Bligh J, Bradley P, Searle J. 2004. Teaching anatomy without cadavers. Med Educ 38:418-424.
McLachlan JC, Patten D. 2006. Anatomy teaching: Ghosts of the past, present and future. Med Educ 40:243-253.
Prentice ED, Metcalf WK, Quinn TH, Sharp JG, Jensen RH, Holyoke EA. 1977. Stereoscopic anatomy: Evaluation of a new teaching system in human gross anatomy. J Med Edu 52:758-763.
Rizzolo LJ, Stewart WB, O'Brien M, Haims A, Rando W, Abrahams J, Dunne S, Wang S, Aden M. 2006. Design principles for developing an efficient clinical anatomy course. Med Teach 28:142-151.
Scaife M, Rogers Y. 1996. External cognition: how do graphical representations work? Int J Hum Comput Stud 45:185-213.
Sweller J, Merrienboer J, Paas F. 1998. Cognitive architecture and instructional design. Educ Psychol Rev 10:251-296.
Zhang J, Norman DA. 1994. Representations in distributed cognitive tasks. Cognit Sci 18:87-122.
Chapter 2
2
Literature Review
2.1 Visualization
The New Oxford American Dictionary defines “visualization” as the process of “forming a mental image” or “making (something) visible to the eye” (McKean, 2005). In
cognitive science, these are two entirely difference constructs. The former, called an internal visualization, is a representation in the mind of an individual derived from imagery or imagination (Hegarty, 2004b); the latter, called an external visualization, is a representation in the environment that can be perceived by an individual (Hegarty, 2004b). For example, an image of the human heart printed in an anatomy textbook or atlas is an external representation of the heart; it is not the heart reduced in size and transposed onto a 2-D surface, but only a physical copy of what the heart looks like from a particular vantage point. Similarly, if one has ever dissected the heart and can envision what the heart looks like, from whichever perspective one wishes, then one is relying on an internal or mental representation of the heart. The heart is not physically in one’s head, but rather a mental image of the heart accessed from memory.
One key feature of external visualizations is that they can provide valuable assistance for learning. This assistance, called “cognitive support,” can occur through a number of mechanisms that reduce demands on the learner’s working memory and allow an effortful internal cognitive process to be offloaded onto a less effortful external perceptual-motor process (Tory and Moller, 2004; Keehner et al., 2008b). There are many tools that can support or augment the learning process, the most common of these being visual and aural representations. This dissertation focuses particularly on visual representations, specifically computer - generated visual representations, or simply computer
2.2 External visualizations
Throughout history, advancement in technology has significantly improved our ability to create external representations of anatomy. While cadaveric dissection has been
acknowledged as the paradigm of anatomy teaching since the 16th century, access to dissections was limited due to the lack of fresh bodies and the lack of effective
preservation techniques (Olry, 2000; McLachlan and Patten, 2006). As a result, external representations in the form of physical models with fine anatomical details were created as alternative teaching aids. These had the advantages of being more widely available and were not at risk of decay. In the 17th and 18th centuries, anatomical models were made from available materials such as wax, ivory and cardboard (Olry, 2000). Starting in the early 20th century, plastic or polychromatic rubber became the material of choice for creating anatomical models (Olry, 2000). In recent years, computers have changed the way we create and use anatomy representations. Because of computers, anatomical representations can be created automatically at time of use, can be made dynamic and interactive, can be used anywhere, with or without an internet connection, and can be stored on almost any network - capable devices ranging from desktop computers to tables and smartphones.
2.2.1
Computer visualizations
Computer visualizations can be classified in many ways. Commonly, they are described in terms of features such as their modality (text or picture), abstraction (iconic or
symbolic), sensory channel (auditory or visual), dimensionality (2-D or 3-D), dynamism (static/non-dynamic or dynamic), or interactivity (active or passive) (Ainsworth and VanLabeke, 2004). Different types of external computer representations of anatomy vary in terms of how much information they represent about the human body, in how
explicitly that information is represented, and in the type of mapping between the
external representation and its referent (i.e., the represented structure) (Hegarty and Kriz, 2008).
2.2.1.1
Modality: text versus pictures
Comparisons of information processing requirements of text and pictures have been used to explain why pictorial representations can have advantages over text for presenting certain types of information to learners. Texts are descriptive representations consisting of symbols describing an object, such as spoken or written words and mathematical expressions (Schnotz and Kürschner, 2008). Symbols are signs that have no similarity with the content they represent. For example, the word ‘heart’ has no similarity with a real heart. It is a symbol, and it’s meaning is based on a convention. In a sentence like, “the resting heart beats 70 times per minute”, nouns (such as ‘heart’) are symbols for objects and events; verbs (such as ‘beats’) are symbols for actions, and adjectives (such as ‘resting’) are symbols for attributes. Pictures, on the other hand, are depictive
representations consisting of icons (Schnotz and Kürschner, 2008). Icons are signs that are associated with the content they represent through common structural features. A map of Canada or a picture of the human body are examples of depictive representations that have some similarity with the corresponding referent (Schnotz, 2005).
information (e.g., turning a key can unlock a door), organizing information to reduce search efforts (e.g., a map or flowchart), and representing relationships amongst elements that are difficult to explain verbally (e.g., a Venn diagram) (Zhang and Norman, 1994). Another advantage of pictures is they can promote parallel processing by the visual system, which can increase the bandwidth of information extraction. According to the modality principle (Lowe, 2004), under certain, well-defined conditions, presenting some information in visual form and other information in auditory form can effectively expand working memory capacity and so reduce the effects of excessive cognitive load. Finally, pictures can be used to drive cognitive behaviour without conscious awareness (Zhang and Norman, 1994; Zhang, 1997). For example, physically salient cues, such as bright colors, labels, and motion, can be added to the display to draw learners’ attention towards important concepts or features, increasing the likelihood that these features will be
brought into the information processing system (Desimone and Duncan, 1995).
The comparisons of text and pictures referred to above concern the way their different visuospatial characteristics impact on information processing requirements such as search and the detection of relationships (Lowe, 2004). It is possible to take this theme one step further and make similar comparisons between static and dynamic, and 2-D and 3-D visualizations.
2.2.1.2
Dynamism: static versus dynamic
A static (or non-dynamic) image printed in an anatomy textbook or atlas can explicitly represent the parts of the human body. This type of image is commonly used to show anatomical structures (e.g., muscles of the lower limb) from one of six canonical
An animation is the prototypical example of a dynamic visualization (Hegarty, 2004b). A traditional animation consists of a sequence of frames that play at a constant rate; each frame image exists only transiently to be replaced by subsequent frames (Ainsworth and VanLabeke, 2004). In contrast to a static image, an animation can explicitly represent both the parts of the human body and how those parts change with respect to time (e.g., how muscles contract and relax). Hence, in an animation, the movements of objects are isomorphic to the movements of parts in the human body (Hegarty and Kriz, 2008). In addition to portraying a visible sequence of events in real time, or proportional to real time, animations can also be used to increase depth information in the display (e.g., by having the muscles rotate in virtual space). The multiple views provided by rotating an object may more accurately depict the visuospatial properties of anatomical structures (Garg et al., 1999).
2.2.1.3
Dimensionality: 2-D versus 3-D
The human body is a 3-D entity (actually, 4-D if time is included), in that it has a length, width, and height. When looking at an image (static or dynamic, 2-D or 3-D) there are visual cues incorporated in the image that the brain attends to. The visual system relies on these cues to infer the visuospatial properties of objects within the field of view, in this case, anatomical structures. These depth cues are typically divided into two broad categories - monocular cues that require the visual input of one eye and binocular cues that require the visual input of two eyes (Schwartz, 2010).
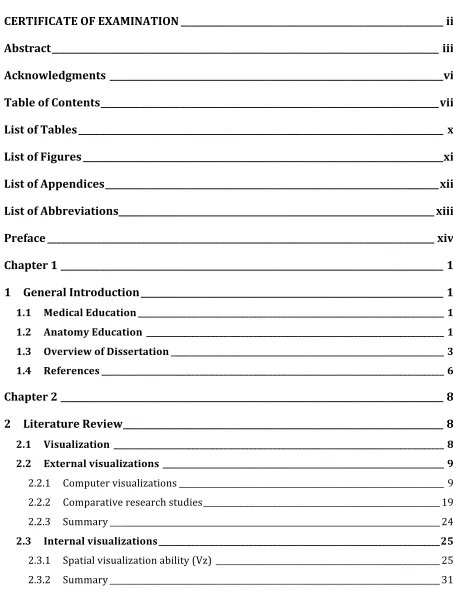
Motion cues include multiple forms of parallax. The perception of motion can be thought of simply as a change in the visual direction of an object as a function of time when one, then another, retinal locus is stimulated by its image (Steinman and Garzia, 2000). If the observer is moving relative to a stationary object, the resulting movement is called moving-viewer motion parallax (Bowman et al., 2005). If the observer is stationary but the object is in motion (e.g., it is rotating or translating), the resulting movement is called stationary-viewer motion parallax (Bowman et al., 2005). In both cases, objects will move at different speeds on the retina depending on their distance from the observer. Objects closer to the observer will appear to move faster than objects farther away. The sequence of images in Figure 2.1 illustrates motion parallax as a visual cue. The
incorporation of motion depth cues to a display (e.g., having an object rotating in virtual space) can provide a 3-D impression of an object that better communicates its
visuospatial properties (Keehner et al., 2008b). Because these motion-based depth cues depend on the object’s ability to move and not on whether the movements are actively controlled by the learner, this type of spatial information is made available regardless of whether a visualization’s level of interactivity is passive or active (Keehner et al., 2008a; 2008b).
Binocular cues exist because of the differential location of the two eyes. On average, the human eyes are separated by approximately 6.4 cm in the horizontal direction (Ware, 2004). Due to this separation, the two eyes receive slightly different images of the external environment and the brain uses the disparity between these images to recover information about the relative distance or depth of objects in the visual world (Steinman and Garzia, 2000). This process is called stereopsis and its sole basis is the horizontal (or binocular) disparity between the two retinal images (Poggio and Poggio, 1984). There are, of course, several cues to depth, like texture gradients, shading, and motion parallax, which are based on the visual input of only one eye. However, stereopsis is the most important and accurate of them, especially when it comes to depth perception in close visual field (Ware, 2004).
While stereopsis occurs naturally in animals with overlapping visual fields (Ware, 2004), the effect can be achieved using a standard computer monitor coupled with stereo glasses. The monitor is used to generate and display the disparate images (one for each eye) while the stereo glasses are used to filter the screen images so that each eye receives only one screen image. Bowman et al. (2005) recommends a monitor with a high refresh rate (100 Hz or better) because the display of the two images reduces the refresh rate by 50%. The stereo glasses can either be active or passive. Active (or shutter) stereo glasses are synchronized to open and close their shutters at the same reduced refresh rate as the monitor (Bowman et al., 2005). Passive stereo glasses are based on polarization or
spectral multiplexing. Polarization multiplexing filters the overlaid images with polarized filters that run in opposite directions (e.g., one filter could be horizontally polarized while the other is vertically polarized). Spectral multiplexing (or anaglyph stereo) displays the two overlaid images in two different colours (e.g., blue and red). The coloured filters are used so that light from any colour other than the filter’s colour is washed out. Although active stereo produces the highest stereo quality, it is expensive and requires
2.2.1.4
Interactivity: interactive versus non-interactive
If the visualization does not allow any mode of interaction other than watching, then it is passive interaction. Many of the highly useful static and dynamic computer visualizations used in anatomy courses support passive interaction only (Garg et al., 1999; Luursema et al., 2008). If the visualization allows viewer control over the presentation of information, then it is active interaction. Betrancourt (2005) distinguished broadly between two categories of active interaction: control and interactivity. “Control” refers to the capability of the viewer to act on the pace and direction of the presentation sequence (e.g., play, pause, rewind, etc.). “Interactivity” refers to the capability of the viewer to alter parameters (e.g. viewpoints) of the object in the visualization, allowing for exploration from different perspectives.
The ability to interact with computer visualizations can be achieved through various input hardware, ranging from the traditional desktop devices such as keyboards, 2-D mice and trackballs to more sophisticated devices that track users’ hand motion. Many different characteristics can be used to describe input devices. One of the most important
characteristics is the number of degrees of freedom (DOF) that the input device allows. A degree of freedom may be defined as the number of independent dimensions of the motion of a body (Bowman et al., 2005). A traditional 2-D mouse, for example, allows for translation along two perpendicular axes (up/down along the y-axis and left/right along the x-axis). Since the movement along the axes is independent of each other, a traditional mouse has two DOF. A tracker, on the other hand, allows for translation along three perpendicular axes (up/down along the y-axis, right/left along the x-axis, and forward/backward along the z-axis) as well as rotation about these axes (pitch, yaw, roll). Since the movement along each of the three axes is independent of each other, a tracker has six DOF. Typically a device’s DOF gives an indication of how complex the device is and the power it has in accommodating various interaction techniques.
Another way of characterizing input devices is by the input type and frequency of data (i.e. reports) they generate. Data reports are composed of discrete components,
from a set) based on the user’s action (e.g., key presses) and produce a discrete (or stepped) system response (e.g. making a menu selection or following a hyperlink). Continuous input device components generate multiple data values (e.g., real-value numbers, pixels, coordinates) in response to a user’s action and produce a flow of system responses (Bowman 2005). This mode of interaction is important for direction
manipulation interfaces, where there is a short “cognitive distance” between a user’s action and the system’s feedback, resulting in a feeling of first-personness or direct engagement with the object displayed (Hutchins et al. 1985). In many cases, input
devices combine discrete and continuous components, providing a larger range of device-to-interaction technique mapping (Bowman et al., 2005).
In summary, computer visualizations used in anatomy courses vary widely in the type of depth cues incorporated in the display and the degree to which they permit interactive control by the user. A static image provides a 2-D representation of a 3-D object. Pictorial depth cues such as shading, shadow, and texture gradient are applied to a 2-D surface, creating a sense of depth where none previously existed. An animation of an object rotating in virtual space provides a 3-D impression of the object. The incorporation of motion parallax enables multiple views of the object, which better communicates the visuospatial information of anatomy (Keehner et al., 2008b). The incorporation of computer-implemented stereopsis enhances depth information, especially at near
distances, by providing the left and right eye of the viewer with two images, representing two perspectives of the same object, with a minor deviation equal to the perspectives that both eyes naturally receive in binocular vision (Bowman et al., 2005). Computer
2.2.2
Comparative research studies
2.2.2.1
Static representations versus animations
Intuitively, one might expect that animations will offer advantages over static
representations, especially since the additional depth cues incorporated in these displays better communicate the visuospatial properties of anatomical structures (Keehner et al., 2008b). At best, static depictions, such as illustrations or photographs printed in anatomy textbooks, can present implicit representations only of dynamic or visuospatial
information. They therefore require learners to infer the situational dynamics or spatial properties, respectively (Lowe, 2004). This can be seen as imposing a processing burden on the information processing system. In contrast, animations have the advantage of being able to present the dynamic or spatial content explicitly such that there is an isomorphism between the content being represented in the dynamic display and its referent (Lowe, 1999; 2004). Thus, when learning with animation the majority of learners’ working memory resources could be devoted to comprehending the content directly. However, initial research comparing the educational effectiveness of animations and static depictions failed to show clear advantages for animated displays. For example, Tversky et al. (2002) reviewed over 20 studies comparing learning from static
representations and animations. In the majority of the studies, including those in the domain of physics, biology, and mechanics, there was no advantage of animations over static representations. In cases where there was an advantage, further examination
revealed lack of equivalence between the animated and static displays in both content and procedures, such that the animation conveyed more information or interactivity was involved. In contrast, Hoffler and Leutner (2007) published a meta-analysis of 26 studies comparing animations and static representations in an attempt to identify factors
responsible for successful learning with animations. Their analysis revealed an overall advantage of animated over static representations. The analysis further revealed that animations are more effective than static representations only when they are
The analysis also showed a larger benefit of animations over static representations when the target knowledge was procedural-motor knowledge rather than problem-solving knowledge or declarative knowledge.
In the specific domain of anatomy, Hariri et al. (2004) compared the utility of interactive animations and static representations for learning shoulder joint anatomy. Students received ten-minute learning sessions with either a simulator that provided dynamic graphic display and haptic feedback or static textbook images. Subsequently, students had to identify anatomical structures videotaped during a shoulder arthroscopy. They found that the animation had no instructional advantage over the textbook images. Keedy et al. (2011) compared the value of interactive animations and static representations for learning hepatobiliary anatomy. Students studied hepatobiliarly anatomy with either a learning module comprised of text, still images, and interactive animations or a learning module comprised of only text and still images. Following the learning module, students completed a satisfaction survey and a nine-item anatomy knowledge test. They found higher satisfaction ratings for the interactive animations; however, the animations had no instructional advantage over the textbook style approach.
2.2.2.2
Stereoscopic versus non-stereoscopic visualizations
In education, it is often assumed that increasing the realism of a display will inherently improve its educational effectiveness (Scaife and Rogers, 1996). If this is the case, then computer visualizations that better communicate the visuospatial properties of anatomy should assist learners in constructing a more accurate mental representation of anatomical structures. Since stereopsis offers the advantage of improved depth perception and
accuracy (especially in close proximity to the viewer), one might expect that it will have instructional advantages over monocular displays. To date, only two studies have
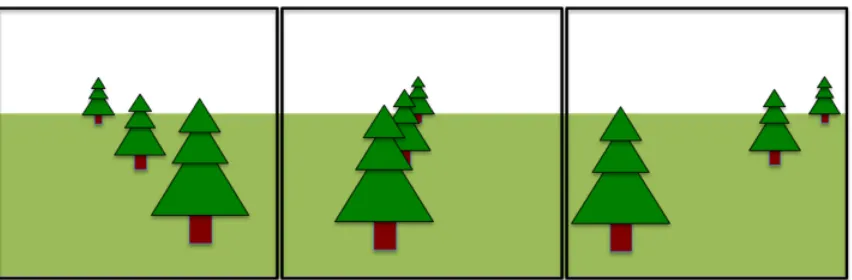
examined the contribution of stereopsis on virtual anatomy learning. In the first study, participants learned abdominal anatomy through interaction with a stereoscopic animation or non-stereoscopic static representations (Luursema et al., 2006). Anatomy competency was measured with a task that involved identification of abdominal
structures in 2-D cross-section and localization of corresponding plane/level of selected cross-sections. The authors found that the stereoscopic animation had an overall
instructional advantage over non-stereoscopic static representations for both
identification and localization problems. In the second study, interactivity was omitted and participant’s learned abdominal anatomy via stereoscopic animation or non-stereoscopic animation (Luursema et al., 2008). The authors found that computer-implemented stereopsis improved performance on the localization task but not the identification task.
Although few studies have examined the instructional value of stereoscopic displays for learning anatomical information, plenty of studies have examined the usefulness of these displays on surgical skill training. However, these studies have yielded inconsistent results as to the benefits of computer-implemented stereopsis. Some studies found clear advantages for stereoscopic displays. Peitgen et al. (1996), for example, examined the effects of computer-implemented stereopsis on laparoscopic task performance.
Performance time and accuracy were recorded. Compared to the non-stereoscopic display, the stereopscopic display improved performance (both speed and accuracy) on the surgical task. Falk et al. (2001) and Byrn et al. (2007) examined the impact of
time and accuracy were measured. In both studies, stereoscopic displays improved task performance (speed and accuracy) compared to non-stereoscopic displays.
By contrast, other studies found that the addition of stereopsis offered no additional advantages over monocular displays. Hanna et al. (1998) examined the impact of computer-implemented stereopsis on laparoscopic cholecystectomy for symptomatic gallstone disease. The addition of stereopsis to the display did not offer advantages over the non-stereoscopic display. Furthermore, surgeons reported adverse symptoms
immediately after the operations with both systems; however, the score for visual strain, headache, and facial discomfort were higher with the stereoscopic display. Roach et al. (2012) evaluated the impacts of stereopsis on the acquisition of new surgical skills - the rhombic flap and double z-plasty procedures. Students’ technical skills (i.e., dexterity, respect for tissue, instrument control, time and progressive thought) were assessed with a five-point Global Rotating Scale. The stereoscopic display did offer additional training advantages over the non-stereoscopic display.
Finally, in some cases, computer-implemented stereopsis hinders task performance. Wentink et al. (2002) compared a standard laparoscopic viewing system comprised of a monocular endoscope with a high-resolution monitor with three advanced laparoscopic viewing systems (including a stereoscopic 3D endoscope system) in a laparoscopic training experiment. Performance time was obtained. The time on the task was
significantly greater with the stereoscopic viewing system than with the standard viewing system. Therefore, compared to the standard system, task performance (as measured by time on task) actually decreased.
2.2.2.3
Interactive versus non-interactive visualizations
and abilities. Hence, it is impossible for traditional animations or static images to take these individual differences into account. Here, interactivity comes into play. The advantage of interactivity is that it enables the viewer to adapt the presentation to his/her individual cognitive needs by actively deciding “what” is presented on the screen and “when” it is presented (Schwan and Riempp, 2004). It is tempting to assume, then, that making visualizations more effective in anatomy education is merely a question of making them more interactive. However, studies examining the educational value of interactive visualizations have demonstrated mixed results.
Some studies found significant advantages for interactivity. Mayer and Chandler (2001) showed that learners who had simple control over the pace of an animation (i.e., pause, play) not only found the material more enjoyable but also performed better on transfer tests (i.e. test of deep learning) than learners who had no control over the presentation. Schwan and Riempp (2004) demonstrated that having complete control over the pace and direction of an animation (i.e., stop, replay, reverse or change speed) accelerates the process of skill acquisition (i.e., tying a nautical knot). Subjects with complete control over animations had a better understanding of the depicted processes than subjects with no control. By contrast, subjects with no control needed substantially more time than subjects with control to acquire procedural skills. In the context of anatomy education, Luursema and Verwey (2011) examined the contribution of interactivity to learning abdominal anatomy. Students received three-minute learning sessions with a stereoscopic abdominal model. Half the students had active control over the rotation of the model (by using a mouse) while the other half witnessed the active participants’ explorations. After the study phase, an anatomical knowledge test consisting of identification questions (identify structure in 2D cross-section) and localization questions (localize the plane/level of selected cross-sections) assessed participants’ learning. Active exploration provided a small but significant benefit over passive exploration.
they contrasted the performance with an interactive visualization to that with a non-interactive visualization. In experiment 2, they used a yoked design to observe the effects of interactivity while controlling for visual input in interactive and non-interactive
conditions. In experiment 3, they contrasted an interactive visualization with a non-interactive visualization that was designed to model the visual information accessed by the most successful interactive participants in earlier experiments. In experiment 1, interactivity produced better performance than passive viewing, but the advantage of interactivity disappeared in experiment 2 when the visual input for the two conditions was equalized through the yoked design. In experiment 3, non-interactive participants who watch optimal movements of the visualization performed as well as interactive participants who manipulated the visualization effectively and better than interactive participants who manipulated the visualization ineffectively. The results suggest that interactivity per se is not the critical factor in the performance of the cross-section task. Instead, the quality of the visual information available predicts success on the task, regardless of whether participants have control over it.
2.2.3
Summary
Despite their seemingly endless pedagogical potential, it is clear from initial research that there is not a simple advantage of animations over static representations, stereoscopic over non-stereoscopic displays, and interactive over non-interactive visualizations. Yet, most educators continue to believe making computer visualizations more dynamic and interactive will enhance their educational effectiveness (Hegarty, 2004b). By focusing on improving the methods by which visual information is communicated, these educators automatically assume a bottom-up model of learning (Kriz and Hegarty, 2007).
According to this model, learning is primarily a function of encoding information from the external display, so that improving characteristics of the display will, by necessity, improve learning. In contrast, less attention has been given to how the learning process is affected by learners’ abilities, skills, goals, and prior knowledge, that is, top-down
characteristic that has been found to influence anatomy learning through traditional methods and more recently from computer visualizations.
2.3 Internal visualizations
While technology has significantly improved our ability to create external visualizations, our ability to internally visualize has probably not changed significantly over the last few decades. Internal visualization has been an important topic of research in cognitive science since the 1800s (Hegarty, 2004a; Zacks and Michelon, 2005). Studies of internal visualization often involve examining people’s ability to construct, inspect, and transform mental representations (Hegarty, 2004a). In the working memory literature, the internal visualization system is collectively known as the visuospatial sketchpad (Baddeley, 1992). In the human intelligence literature, internal visualization ability is also called spatial ability (Carroll, 1993; Hegarty, 2004a).
2.3.1
Spatial visualization ability (Vz)
Generally, the process of constructing and maintaining internal visualization is considered a visual process, involving the visuospatial sketchpad of working memory (Clark and Paivio, 1991; Baddeley, 1992; Mayer and Sims, 1994; Miyake et al., 2001). Processing information in the visuospatial sketchpad is strongly influenced by spatial ability (Miyake et al., 2001), which Carroll (1993) defines as individuals’ abilities in searching the visual field, apprehending the forms, shapes, and positions of objects as visually perceived, forming mental representations of those forms, shapes, and positions, and manipulating such representations ‘mentally’ (Carroll 1993, p. 304). My simply stated, an internal representation of a perceived object or scene must be created and maintained in such a way that mental manipulations are possible.
and together they form the broad concept of spatial ability. These sub-factors are: (a) Visualization (Vz), the ability to apprehend, encode and manipulate visuospatial
representations, often involving rotation in two or three-dimensions; (b) Spatial relations (SR), speed of manipulating simple visuospatial representations by transformation; (c) Closure speed (CS), speed in retrieving visuospatial representations from long-term memory when presented with incomplete, disguised or obscured forms of those representations; (d) Closure flexibility (CF), speed of identifying given visuospatial patterns in a complex visual environment; and (e) Perceptual speed (P), speed of making correct comparisons when given a number of alternative patterns (Carroll, 1993).
Although there are several sub-factors of spatial ability, the one that has been shown to be most relevant to anatomy education is visualization ability (Vz), or more commonly known as spatial visualization ability. The main difference between spatial visualization ability (Vz) and spatial relations ability (SR) (which also requires mental transformation) is that SR problems are solved more rapidly than Vz problems, and the tests themselves are administered in a format that emphasizes speed in the former case and both speed and accuracy in the latter case (Mumaw and Pellegrino, 1984). The second difference
involves the stimulus and its complexity. A gross index of complexity is the number of individual stimulus elements or parts that must be stored and processed in working memory (Mumaw and Pellegrino, 1984; Pellegrino et al., 1984). SR problems, although varying among themselves in complexity, involve less complex stimuli than Vz
problems. Therefore, SR problems usually require a single mental transformation, while Vz problems require a sequence of transformations (Pellegrino et al., 1984)
advance. He or she needs to hold the given information in working memory while attempting to identify it from a complex pattern. In the case of CS, the examinee is not given information about the stimulus pattern (usually a familiar object) in advance. He or she needs to access the representation quickly from long-term memory. The difference between CS, CF, and Vz is that the former two factors require no mental transformation and rely on storage and retrieval of information from memory.
2.3.1.1
Measures of Vz
The ability to apprehend, encode, and manipulate visuospatial representation is often measured using tasks such as the Paper Folding Test (French et al., 1963) and the Mental Rotations Task (Vandenberg and Kuse, 1978). In the Paper Folding Test (French et al., 1963), the subject must imagine that a sheet of paper has been folded in a certain way, a hole is punched through all thicknesses of the paper at a certain point, and the sheet is unfolded. The folding and punching are indicated on the left side of the vertical line, and the subject must select which of the five unfolded sheets on the right of the vertical line is the result. In the Mental Rotations Task (Vandenberg and Kuse, 1978), the subject must imagine rotating three-dimensional block figures. The target/criterion figure is
represented on the far left, and the subject must determine as quickly and accurately as possible which two of the four option figures on the right are rotations of the target figure.
2.3.1.2
Individual differences in Vz
Like any ability, Vz varies significantly within the general population. Some people can store and process visuospatial information with ease, while others have difficulties performing these cognitive processes. Cognitive analysis of performance on tests of Vz suggests that differences in Vz reflect variations in speed of processing visuospatial information (Mumaw and Pellegrino, 1984; Salthouse, 1996), visuospatial working memory capacity (Shah and Miyake, 1996; Miyake et al., 2001), and strategies for processing visuospatial information (Just and Carpenter, 1985; Cohen, 2005). Compared to low Vz individuals, high Vz individuals are faster at carrying out mental operations, have more working memory resources for storing and processing visuospatial
information, and adopt more efficient strategies for solving Vz problems.
2.3.1.3
Vz and anatomy education
Spatial visualization ability (Vz) is a subfactor of spatial ability that is relevant to many disciplines of science, including biology (Russell-Gebbett, 1984; Rochford, 1985; Russell-Gebbett, 1985; Macnab and Johnstone, 1990; Eun-mi et al., 2003), chemistry (Carter et al., 1987; Pribyl and Bodner, 1987; Coleman and Gotch, 1998; Eun-mi et al., 2003), and physics (Kozhevnikov et al., 2007). As applied to anatomy education, Vz tasks often involve imagining the shape and relation of anatomical structures in both three-dimensions and two-dimensional cross-sections. Russell-Gebbett (1984) identified two skills often used by secondary school pupils to understand three-dimensional
structures in biology. These discrete skills include the ability to infer the shapes of cross-sections of anatomical structures and the ability to understand the spatial relationships among the internal parts in the anatomical cross-sections. Further analysis revealed that these skills were positively correlated with success on 3-D biology problems (Russell-Gebbett, 1985). Rochford (1985) found a positive correlation between Vz and