Page | 405
The effect of polishing time, polishing speed, and applied force on
the reduction of roughness values on the surface of silicon
photovoltaic wafers
Ronald Allan S. de los Reyes Malayan Colleges Laguna, Philippines
rasdlreyes@mcl.edu.ph
Abstract
The shaping of silicon through a series of machining processes is a very important part in the transformation of this material into useful devices. Using the mechanical polishing process, the study will elucidate the mechanism of silicon machining in the microscale. The descriptive model proposed is based on the ductile cutting – brittle cutting transition that occurs in silicon and how it is affected by the applied force and size of the impinging abrasive particles. More particularly, coarser particles mitigate the increase in applied force by spreading the force over a wider area preventing the cut to go into the brittle cutting region. Also the coarser particles have a broader contact front that prevents material build up ahead of the particles. This allows for a faster decrease in surface roughness as the polishing speed is increased. With the assumption of linear behavior within a certain range of values, an empirical equation is derived that will relate the polishing time, polishing speed, and applied force to the reduction in the surface roughness measured in average roughness, Ra, values.
Keywords :
Ductile; brittle; roughness; transition; force; polishing speed
Introduction
The machining of silicon after the crystal growing process is the industrial activity within the value chain of processes that prepares this 21st century material to become the leading substrate for a host of advanced
devices from semiconductors, power devices, battery electrodes to solar cells. Sze (1988) has given a brief discussion of the processes of silicon crystal machining consisting of ingot rounding, ingot slabbing, ingot polishing, ingot cropping, ingot slicing, and wafer polishing [8].
One example is the slicing of silicon ingots to produce silicon PV wafers. Goodrich et al. (2013) reviewed the economics of silicon photovoltaic module production and computed that wafering cost comprises about 37 % of the cost of photovoltaic energy modules [5].In order for this technology to become more competitive it is very important to understand the mechanism of silicon machining to be able to find the optimum condition for increased yields, higher quality and for a more cost effective processing.
A mechanical property of great interest is the surface roughness of the wafers after the slicing process. This can be measured as the average roughness, Ra.Buchwalda et al. (2013) determined that this property has an effect on the fracture strength of the sliced wafers [3].Investigating the Ra formation and transformation upon the action of a mechanical force can give us some understanding into the microscopic details of silicon machining.
Page | 406
advanced that will explain the cutting action at the micro level. The results of this work is shown to be generally applicable to all types of silicon machining processing.
Materials and Methods
A micropolisher set-up illustrated in Fig. 1 was used for this experiment. The abrasive wheel with a diameter of 38 mm consists of a 10.5 mm thick felt pad backing and the abrasive paper shown in Fig. 2.The abrasive paper was attached to the felt pad by adhesive and was replaced for every sample to ensure new abrasive particles per sample. Two grit sizes were used for the investigation; 80 grit size for coarse polishing and 2500 grit size for fine polishing. Polishing was performed under dry conditions with the samples stationary for the duration of the processing. Fixing the samples onto the polishing table was done by water tension in between the sample underside and the surface of the polishing table. The polishing area was kept constant to around 112 mm2 . This is to reduce variability in the measurements by localizing the polishing area. The tool for measuring the Ra values was the Taylor/Hobson profilometer - Surtronic Duo.
Fig. 1. Micropolisher set-up consisting of a variable speed rotary tool, base/stand, spring loaded force applicator, load indicator, felt pad polishing wheel, and a glazed ceramic tile sample stage/holder.
Fig. 2. Felt pad polishing wheel and abrasive disk paper.
Results and Discussion
Process variables were set according to the design as indicated in Table 1. Three samples were processed per runs. The Ra values were measured before and after polishing for each of the samples. The change in the Ra values were obtained for each sample by subtracting the final value from the initial value per sample. Afterwards, the average change in the Ra values (ΔRa) were calculated on a per run basis. These data for grit size 2500 are also indicated in Table 1 and show positive values which mean reduction of the Ra values after the polishing process.
Table 1Factor levels and average of results for 2500 grit size abrasive particles.
Run TIME FORCE SPEED Ave. ΔRa
(s) (N) (m/s) μm
1 60 0.5 16 0.23
2 120 0.5 16 0.2633333
3 60 0.5 24 0.2
4 120 0.5 24 0.2233333
5 60 1.0 16 0.2066667
6 120 1.0 16 0.1166667
7 60 1.0 24 0.1533333
8 120 1.0 24 0.28
Felt Pad Wheel
Abrasive Disk Paper
Load Indicator Wafer Sample
Polishing Wheel Variable Speed Rotary Tool
Page | 407
Fig. 3. Wafer sample with damaged layer area and polished area.
Fig. 3. shows a picture of sample with an area that was not polished and an area that went through the Ra reduction polishing process.Acker et al.(2013) characterized the damaged layer [1] determining that it extends to about 2.8 μm into the bulk of the material and described it to contain deep lateral cracks, rifts, and craters.
Fig. 4. is a plot of the ΔRa values as function of the polishing time and polishing velocity with an applied force of 0.5 N. The chart shows that the ΔRa increases with an increase in polishing time. Conversely, the ΔRa decreases as the polishing speed is increased.
It is conjectured that the polishing is still in the ductile region of cutting with a polishing depth abovethe critical ductile to brittle cutting transition depth. This explains an increase in reduction of Ra over time due to the smooth cutting in this region.
The decrease of the rate of Ra reduction as cutting speed is increased may be due to the material pile up in front of the abrasive particles serving as a counter mechanism to Ra reduction.Cai et al. (2007), using molecular dynamics simulation of the nanoscale ductile cutting of silicon, has shown that as the thrust force is increased not enough shear stress is generated to keep the dislocations moving [4]. This shifts the cutting mechanism into the brittle cutting region by promoting the propagation of cracks as the dominant mode of fracturing.
Fig. 4. Change in Ra as a function of polishing time at polishing speed 16 m/s and 24 m/s using 2500 grit size abrasive particles under an applied force of 0.5 N.
The chart in Fig. 5 is also a plot of the ΔRa as a function of the polishing time and polishing velocity but with an applied force of 1.0 N. At this applied force, the ΔRa values decreases with an increase in polishing time at the polishing speed of 16 m/s . It regained its increasing behavior with an increase in polishing time at the polishing speed of 24 m/s. . Pei (2002) has found that the silicon surface becomes rougher as the rate of cut depth increase is raised at a relatively slower machining speed [7].
Fig. 5. Change in Ra as a function of polishing time at polishing speed 16 m/s and 24 m/s using 2500 grit size abrasive particles under an applied force of 1.0 N.
ΔRa = 0.0006T+ 0.1967
ΔRa = 0.0004T+ 0.1767
0.19 0.2 0.21 0.22 0.23 0.24 0.25 0.26 0.27
0 50 100 150
Δ
R
a
(μ
m)
Polishing Time (seconds)
Speed 16 m/s
Speed 24 m/s
ΔRa = -0.0015T + 0.2967 ΔRa= 0.0021T + 0.0267
0.11 0.13 0.15 0.17 0.19 0.21 0.23 0.25 0.27 0.29
0 50 100 150
Δ
R
a
(μ
m)
Polishing Time (seconds)
Speed 16 m/s
Speed 24 m/s Damaged Layer
Page | 408
Xie et al. investigated the dry micro-grooving of Si wafers [9] has determined that 127 nm is the critical depth at which the brittle mode of cutting becomes predominant through crack propagation. It can be surmised that at a higher applied force, the cutting depth as exceeded the critial depth and has entered the region of brittle materials removal governed by crack generation. This hinders the Ra reduction process producing a decreasing value over time at the lower cutting speed of 16 m/s.
At the higher cutting speed the increasing trend for Ra reduction was recovered as shown in Fig. 5.According to Kalpakjian (1995) [6], in any grinding operation the undeformed chip thickness is proportional to the square root of the reciprocal of the grinding wheel tangential velocity. Thus increasing the cutting speed leads to smaller chippings resulting to a smoother workpiece surface.Anderson et al. (1990) proposed that in the brittle cutting region fracture mechanics govern failure of the material and a higher cutting speed means that the impact force or energy is higher and the mechanical wearing of silicon is greater [2]. A higher applied impact force could break off the chips faster in smaller sizes as compared to the chips at the lower cutting speed. This smaller chippings could lead to a much finer surface morphology.
Polishing behavior was also investigated for grit size 80 and results are shown in Table 2.
Fig. 6 illustrates the behavior of Ra reduction over time under applied force of 0.5 N. Unlike the previous results at this
applied force, the rate of Ra reduction increases as a function of time and of speed. Table 2Factor levels and average of results for 80 grit size abrasive particles.
Run TIME FORCE SPEED Ave. Δ-Ra
(s) (N) (m/s) μm
1 60 0.5 16 0.08
2 120 0.5 16 1.0666667
3 60 0.5 24 0.2266667
4 120 0.5 24 1.34
5 60 1.0 16 0.9666667
6 120 1.0 16 3.27
7 60 1.0 24 0.9666667
8 120 1.0 24 2.7933333
Fig. 6. Change in Ra as a function of polishing time at polishing speed 16 m/s and 24 m/s using 80 grit size abrasive particles under an applied force of 0.5 N.
Bigger particle grits would mean broader contact region thus distributing the applied force over a wider area. Pile up of material would less likely to occur over a longer abrasive-surface contact front thus Ra reduction still increases directly with cutting speed.
Under the applied force of 1.0 N, Fig. 7 depicts the cutting response for 80 grit size particles. The rate of Ra reduction is still seen to increase over time and speed but there is ΔRa = 0.0164T - 0.9067 ΔRa = 0.0186T - 0.8867
0.05 0.25 0.45 0.65 0.85 1.05 1.25 1.45
0 50 100 150
Δ
R
a
(μ
m)
Polishing Time (seconds)
Speed 16 m/s
Page | 409
already a signal that the smoothing process is slowing down at the higher polishing speed.
Fig. 7. Change in Ra as a function of polishing time at polishing speed 16 m/s and 24 m/s using 80 grit size abrasive particles under an applied force of 1.0 N.
In contrast to the results obtained for the 2500 grit size particles, the ductile to brittle cutting depth transition was not reached at a higher applied force due to the cushioning effect of the bigger abrasive particles. The cutting mechanism is still in the ductile region with an increase in Ra reduction over time. The decrease in the rate in Ra reduction at the higher cutting speed may indicate the start of material build up in front of the abrasive particles due to the deeper lateral penetration of the particles as discussed previously.
Derivation of the Empirical Equation
The procedure to obtain the mathematical relationship is outlined for the 2500 grit size particles. The equations relating the ΔRa with the polishing time are first obtained and are shown in Figs. 1 to 7. These curves are in turn affected by the change in polishing velocity. The change in their slopes and y-intercepts are obtained in Figs. 8 to 15.
The reduction in Ra can be expressed by the equation :
Eq. 1. ΔRa = aT + b
Where a is the change in ΔRa over time. The quantity b is an extrapolation of the curve and represents the ΔRa in the limit of time approaching zero.
The quantitiesa and b changes with respect to the polishing speed according to the equations
Eq. 2. a = cS + d
Eq. 3. b = jS + k
This is shown in Figs. 8 to 11.
Fig. 8. Slope, a, as a function of polishing speed at 0.5
N applied force.
Fig. 9. Slope, a, as a function of polishing speed at 1.0
N applied force. ΔRa = 0.0384T - 1.3367
ΔRa = 0.0304T - 0.86
0.9 1.4 1.9 2.4 2.9 3.4
0 50 100 150
Δ
R
a
(μ
m)
Polishing Time (seconds)
Speed 16 m/s
Speed 24 m/s
a = -3E-05S + 0.001
0.00035 0.0004 0.00045 0.0005 0.00055 0.0006
15 20 25
Sl
o
p
e
(
μ
m/s)
Polishing Speed (m/s)
a = 0.0005S - 0.0087
-0.0016 -0.0011 -0.0006 -0.0001 0.0004 0.0009 0.0014 0.0019 0.0024
15 20 25
Sl
o
p
e
(
μ
m
/s)
Page | 410
Fig. 10. Y-Intercept, b, as a function of polishing speed
at 0.5 N applied force.
Fig. 11. Y-Intercept, b, as a function of polishing speed
at 1.0 N applied force.
The quantities c,d,j,k changes as a function of the applied force. This is shown in Figs. 12 to 15.
Fig. 12. Function c with respect to applied force.
Fig. 13. Function d with respect to applied force.
Fig. 14. Function j with respect to applied force.
b = -0.0025S + 0.2367
0.176 0.181 0.186 0.191 0.196
15 20 25
Y
-i
n
te
rc
e
p
t
(
μ
m)
Polishing Speed m/s
b = -0.0338S + 0.8367
0.02 0.07 0.12 0.17 0.22 0.27 0.32
15 20 25
Y
-i
n
te
rc
e
p
t
(
μ
m)
Polishing Speed m/s
c = 0.0011F - 0.0006
-1.00E-04 0.00E+00 1.00E-04 2.00E-04 3.00E-04 4.00E-04 5.00E-04 6.00E-04
0.4 0.6 0.8 1 1.2
Applied Force (N)
c = eF + g
d = -0.0194F + 0.0107
-0.01 -0.008 -0.006 -0.004 -0.002 0 0.002
0.4 0.6 0.8 1 1.2
Applied Force (N)
d = hF + i
j = -0.0626F + 0.0288
-0.04 -0.035 -0.03 -0.025 -0.02 -0.015 -0.01 -0.005 0
0.4 0.6 0.8 1 1.2
Page | 411
Fig.
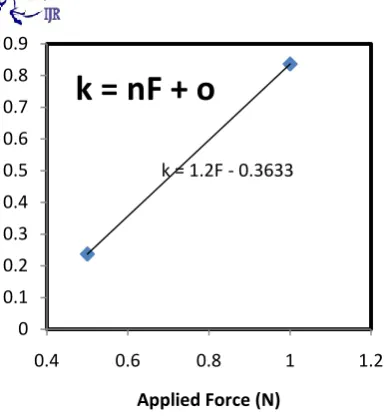
15. Function k with respect to applied force.
Upon substitution this gives the equation of the form
Eq.4.
Δ-Ra = eFST - gST - hFT + iT - lFT + mS + nF – o
Where
F : Force (N) T : Time (s) S : Speed (m/s)
This expression provides one term each for the effect of the individual factors, 3 terms for the effect of 2-factor interactions, one term for the effect of 3-factor interactions and a constant. The coefficients and constant are gained by differentiating the slope and y-intercept as a function of time, speed, and force respectively as described above.
Substituting the values we obtain the equations :
Eq. 5.ΔRa2500=0.011FST-0.0006ST-0.0194FT+
0.0107T-0.0626FS+0.0288S+1.2F–
0.3633
Eq. 6.ΔRa80 = -0.0026FST + 0.0016ST +
0.0848FT
– 0.0304T + 0.1242FS - 0.0646S –
2.8868F + 0.5967
Check for Normality Distribution
The derived equations are used to check the distribution pattern of the deviation of data points if they will follow a normal curve plot. This is depicted in Fig. 16 and Fig. 17. The histograms show that theresidual or
deviation from predicted value
distributionsare in good agreement with that of a normal distribution pattern.This indicates that the data points were only affected by random variations and were not influenced by biased or systemic errors.
Fig. 16. Frequency distribution of data point residuals (deviations) for 80 grit size abrasive particles.
Fig. 17. Frequency distribution of data point residuals (deviations) for 2500 grit size abrasive particles. k = 1.2F - 0.3633
0 0.1 0.2 0.3 0.4 0.5 0.6 0.7 0.8 0.9
0.4 0.6 0.8 1 1.2
Applied Force (N)
k = nF + o
0 1 2 3 4 5 6
-2.1 -1.7 -1.3 -0.9 -0.5 -0.1 0.
3
0.
7
1.
1
1.
5
1.
9
Fr
e
q
u
e
n
cy
Standardized Scores 1σ = 67% 2σ = 92% 3σ = 100%
0 0.5 1 1.5 2 2.5 3 3.5 4 4.5
-2.1 -1.7 -1.3 -0.9 -0.5 -0.1 0.3 0.7 1.1 1.5 Mo
…
Fr
e
q
u
e
n
cy
Page | 412 Conclusions
The ductile cutting to brittle cutting transition has been found to be critical in analyzing the machining of silicon at the microscale. At a lower cutting applied force, the machining of silicon is conjectured to be in the ductile region. In this region the rate of Ra reduction increases over time but decreases as the cutting speed is increased. This inverse behavior with cutting speed could be mainly due to the pile up of material ahead of the abrasive particles. This pile up immobilizes the dislocations in the crystal and leads to crack propagation as the primary cause of fracturing. At a higher cutting force, the depth of cut goes below the ductile cutting region and proceeds into the brittle cutting region. An increase in the cutting speed in this region leads to a finer surface texture due to the reduction of chip sizes as the cutting speed is raised. It is also surmised that the applied pressure is affected by the grit size of the impinging particles. For a given applied force, less pressure is applied per particle for coarser particles as compared to finer particles. This maintains the machining within the ductile cutting region for coarser particles even with an increase in the applied force.
Acknowledgments
This research study was supported by First Philec Solar Corp., a global leader in silicon ingot shaping, cropping, and slicing.
References
1. Acker J., Koschwitz T., Meinel B., Heinemann R., Blocks C., 2013. HF/HNO3 etching of the saw damage. Energy Procedia. 38, 223 – 233.
2. Anderson J.C., Leaver K.D., Rawlings R.D., Alexander J.M., 1990. Materials Science, 4th ed. Chapman & Hall, 2-6 Boundary Row, London SE1 8HN, pp. 312-313.
3. Buchwalda R., Fröhlicha K., Würznera S., Lehmanna T.,Sunderb K., H., Möller
H.J., 2013. Analysis of the sub-surface damage of mc- and cz-Si wafers sawn with diamond-plated wire. Energy Procedia. 38, 901 – 909.
4. Cai M.B.,. LiX.P, RahmanM., 2007. Study of the mechanism of nanoscale ductile mode cutting of silicon using molecular dynamics simulation. International Journal of Machine Tools & Manufacture. 47, 75–80.
5. Goodrich A., HackeP., WangQ., SoporiB., MargolisR., JamesT.L., WoodhouseM., 2013. A wafer-based monocrystalline silicon photovoltaics roadmap: Utilizing known technology improvement opportunities for further reductions in manufacturing costs. Solar Energy Materials & Solar Cells. 114, 110–135.
6. Kalpakjian S., 1995. Manufacturing Engineering and Technology, 3rd ed. Addison-Wesley Publishing Company Inc., pp. 790-791,.
7. PeiZ.J., 2002. A study on surface grinding of 300 mm silicon wafers. International Journal of Machine Tools & Manufacture. 42, 385–393.
8. Sze S.M., 1988. VLSI Technology, 2nd ed. McGraw-Hill Book Company, pp. 34-44,.
9. XieJ., XieH.F., LiuX.R., TanT.W., 2012. Dry micro-grooving on Si wafer using a
coarse diamond grinding.