ABSTRACT
AKRAM, BITA. Assessment of Students' Computer Science Focal Knowledge, Skills, and Abilities in Game-Based Learning Environments. (Under the direction of Drs. James C. Lester and Eric N. Wiebe).
Computer science has become a critical competency for all students. With national K-12 education initiatives such as CSforAll, block-based programming environments have emerged as widely used tools for teaching computational thinking (CT) and computer science (CS) concepts to novice programmers. A key challenge posed by block-based programming environments is assessing students’ CT and programming competencies within these environments. While this assessment role would traditionally be fulfilled by a teacher, the dramatic growth of computer science as both a necessary skill and area of interest for students presents the need for automated and semi-automated assessment tools that support teachers in this role. Developing assessment methods that can evaluate students’ CS focal knowledge, skills, and abilities help teachers evaluate students’ learning and provide appropriate scaffolding.
engaging learning opportunities while providing educators with ample opportunity to unobtrusively assess students’ knowledge and skills.
This dissertation introduces a novel temporal analytics framework for stealth assessment based on students’ problem-solving strategies. The strategy-based temporal analytic framework incorporates long short-term memory networks to analyze students’ problem-solving behaviors across consecutive tasks to inform an evidence model used in stealth assessment. When evaluating the temporal analytic framework on a dataset collected from middle grade students’ interactions with the ENGAGE game-based learning environment, results show that it outperforms competitive baseline models with respect to predictive accuracy when used for predicting students’ post-test scores.
Furthermore, this dissertation presents the development and evaluation of a stealth assessment framework that utilizes a blended hypotheses-driven assessment design approach to assess middle grade students’ CS focal knowledge, skills and abilities (FKSAs) within game-based learning environments. We follow an Evidence-centered design-based assessment to evaluate students’ CS FKSAs based on evidence extracted from their programming trajectories in a block-based programming environment. The results reveal distinctive patterns in students’ approaches to problem solving for CT challenges, which provides first steps toward identifying and assessing productive CS practices.
applying Gaussian process regression help reduce this noise. The semi-automated assessment framework utilizes a supervised learning approach that infers the algorithmic quality of a submitted programming artifact based on its hierarchical and ordinal encoded n-grams. Our results demonstrate the effectiveness of the proposed approach in inferring artifacts’ algorithmic quality. Furthermore, according to our results, Gaussian process models outperform other models that are unable to accommodate the level of noise in our dataset. Overall, our stealth assessment framework has shown to be an effective approach to unobtrusively assess students’ CS and CT competencies within a game-based learning environment.
Assessment of Students' Computer Science Focal Knowledge, Skills, and Abilities in Game-Based Learning Environments
by Bita Akram
A dissertation submitted to the Graduate Faculty of North Carolina State University
in partial fulfillment of the requirements for the degree of
Doctor of Philosophy
Computer Science
Raleigh, North Carolina 2019
APPROVED BY:
_______________________________ _______________________________ Dr. James C. Lester. Dr. Eric N. Wiebe
Committee Co-Chair Committee Co-Chair
_______________________________ _______________________________ Dr. Thomason W. Price Dr. Bradford W. Mott
DEDICATION
BIOGRAPHY
Bita Akram was born in Tehran, Iran on July 23, 1990. She obtained her Bachelor of Science from Sharif University of Technology in 2013, where she majored in computer engineering. After finishing her undergraduate studies, she immediately started her Master of Science in Computer Science at University of Calgary where her research was focused on devising algorithms for conducting accurate and efficient scientific data visualization.
During her undergraduate and master’s studies, Bita both taught K-12 level mathematics and served as TA for several undergraduate computer science (CS) courses. There she realized her strong passion for education and, in particular, CS education. Therefore, she decided to pursue a PhD in educational technology where she could join her enthusiasm for computer science with her passion for education.
She started her PhD at North Carolina State University in 2013. She later joined the Department of Computer Science and the Intellimedia group to continue her studies under the supervision of Dr. James Lester and Dr. Eric Wiebe. During her PhD studies she remained a research assistant at both Center for Educational Informatics and Friday Institute for Educational Innovation with a research focus on improving access and quality of CS Education by both developing innovative CS curricula and designing advanced learning technologies for
ACKNOWLEDGEMENTS
My special thanks go to my advisors, Drs. James Lester and Eric Wiebe. Their endless support and invaluable guidance during my PhD studies made this possible. They have supported me in doing research in the area I was most excited about and guided me through taking the most intriguing career path. I want to thank them for their numerous hours of support, their belief in my academic path, and the professional model they laid before me.
I also want to thank others who have provided guidance to my academic path. My
committee members: Dr. Thomas Price for his early and insightful directions to my research, Dr. Bradford Mott for his accurate comments in study design and implementation, and Dr. Sarah Carrier for her kindness and flexibility. I also want to express my special gratitude to Drs. Min Chi, Kristy Boyer, Collin Lynch, Tiffany Barnes, Noboru Matsuda, Margareta Thomson, and Roger Azevedo for being invaluable sources of advice at different stages of my research and academic path.
Also, I want to thank senior researchers in the Center for Educational Informatics who have provided valuable advice to my research including Drs. Wookhee Min, Hamoon
Azizsoltani, Jonathan Rowe, Andy Smith, Randall Spain, and Seung Lee. Additionally, special thanks go to my colleagues Andrew Emerson, Dan Carpenter, Nathan Henderson, and Jennifer Houchins for their helpful review of my dissertation. I also want to thank my other colleagues at the Center for Educational Informatic and Friday institute of Educational Innovation at NC State and the LearnDialogue lab at University of Florida for their help, encouragement, and
collaboration. These people include but are not limited to: Niki Gitinabard, Farzaneh
Sarah Reaves, Megan Frankosky, Yihuan Dong, Nick Lytle, Veronica Cateté, Danielle Boulden, Osman Aksit, Cody Smith, Jessica Vandenberg, Zarifa Zakaria, and Arif Rachmatullah.
TABLE OF CONTENTS
List of Tables ... xi
List of Figures ... xii
Chapter 1: Introduction ... 1
1.1 Problem ... 3
1.2 Approach ... 4
1.3 Thesis Statement and Hypotheses ... 7
1.4 Contributions ... 9
1.5 Organization ... 11
Chapter 2: Background and Related Work ... 12
2.1 Computer Science Education ... 12
2.2 Computer Science Assessment ... 13
2.2.1 Evidence-Centered Assessment Design ... 13
2.2.2 Problem-Solving Strategy Assessment ... 14
2.2.3 Text-Based Programming Assessment ... 16
2.2.4 Block-Based Programming Assessment ... 19
2.3 Game-Based Learning Environments ... 23
2.4 Stealth Assessment ... 24
Chapter 3: Stealth Assessment Data Corpora ... 27
3.1 Engage Game-based Learning Environment ... 27
3.2 Corpus A - Binary Challenge ... 29
3.2.1 Backstory and Game Play ... 29
3.3 Corpus B - Bubble Sort Algorithm ... 31
3.3.1 Backstory and Game Play ... 32
3.3.2 Data Collection - Round 1 ... 32
3.3.3 Data Collection - Round 2 ... 34
Chapter 4: Improving Stealth Assessment in Game-based Learning Environments with LSTM-Based Analytics ... 35
4.1 Modeling Students’ Problem-Solving Strategies ... 35
4.1.1 Methodology ... 35
4.1.2 Feature Engineering. ... 36
4.1.3 Clustering ... 37
4.1.4 Interpreting Clusters ... 38
4.1.5 Resulting Strategies ... 41
4.2 Stealth Assessment ... 43
4.2.1 Data Preparation ... 44
4.2.2 Classification Methods... 46
4.2.3 In-game Strategy for Stealth Assessment ... 50
4.3 Discussion ... 51
4.4 Conclusion ... 53
Chapter 5: Assessing Middle School Students’ Computer Science through Programming Trajectory Analyses-1 ... 55
5.1 Modeling CS Competencies ... 55
5.2 Assessment Design ... 56
5.3.1 Computer Science Constructs ... 61
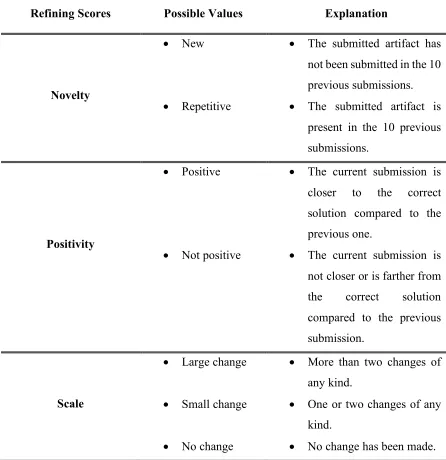
5.3.2 Testing and Refining Programming Artifacts ... 62
5.4 Conclusion and Future Work ... 64
Chapter 6: Assessing Middle School Students’ Computer Science through Programming Trajectory Analyses-2 ... 66
6.1 Rubric Revisions ... 66
6.2 Results and Analysis ... 68
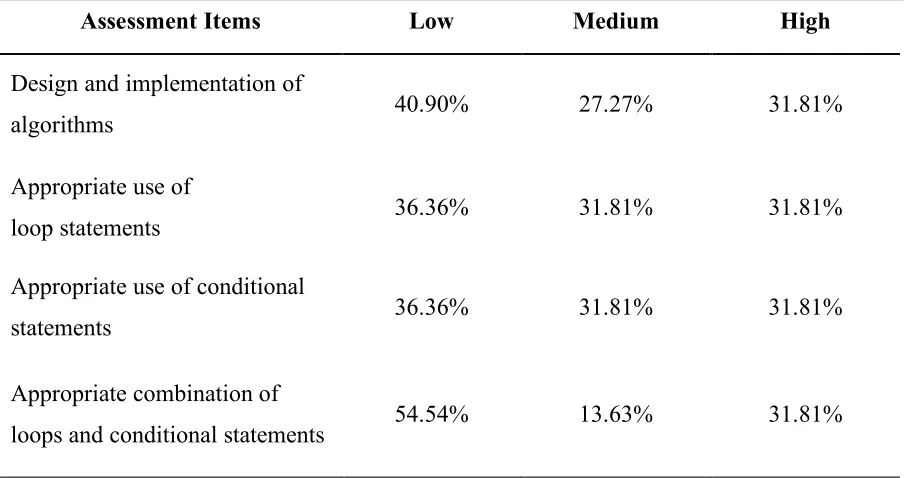
6.2.1 Computer Science Constructs ... 68
6.2.2 Testing and Refining Programming Artifacts ... 72
6.2.3 Problem-Solving Efficiency ... 72
6.3 Discussion ... 73
6.4 Conclusion ... 74
Chapter 7: A Semi-Automated Framework for Assessing Students’ Understanding of Essential CS Constructs Based on Their Programming Artifacts ... 76
7.1. Methodology ... 76
7.1.1 Data Preparation ... 77
7.1.2 Feature Engineering ... 78
7.1.3 Inferring Programming Artifacts' Scores ... 83
7.1.4 Feature selection ... 88
7.1.5 Evaluating the Effectiveness of Structural n-grams ... 89
7.2 Discussion ... 90
7.3 Conclusion & Future Work ... 92
8.1 Summary... 95
8.2 Hypotheses Revisited ... 97
8.3 Limitations ... 102
8.4 Future Directions ... 103
LIST OF TABLES
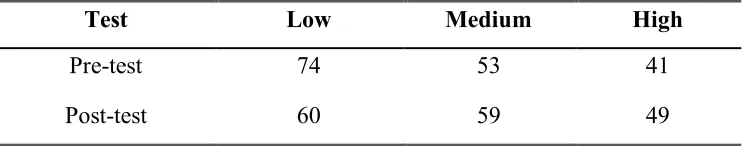
Table 4.1. Pre- post-test performance distribution of students. ... 45
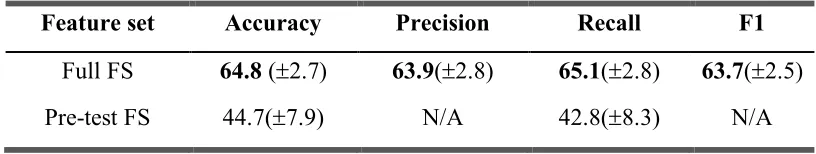
Table 4.2. Performance (± standard deviation) of classifiers. ... 50
Table 4.3. Results for LSTM-based models. ... 50
Table 5.1. CS constructs assessment. ... 58
Table 5.2. Testing and refining assessment. ... 59
Table 5.3. Students’ distribution based on their CS constructs assessment scores... 62
Table 6.1. Revised CS constructs assessment... 69
Table 7.1. Block identification codes. ... 80
Table 7.2. n-gram feature set results. ... 88
LIST OF FIGURES
Figure 2.1. Adapted hypotheses-driven learning analytic framework. ... 22
Figure 3.1. ENGAGE game-based learning environment. ... 28
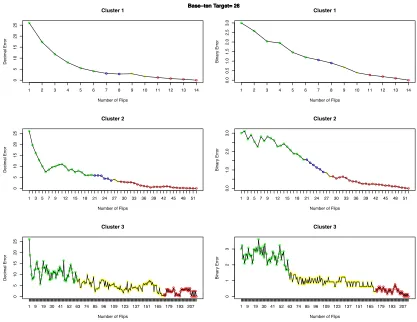
Figure 4.1. Students' average decimal and binary error at each flip when generating binary representation of number 26. ... 39 Figure 4.2. Students' average decimal error when generating binary representation of
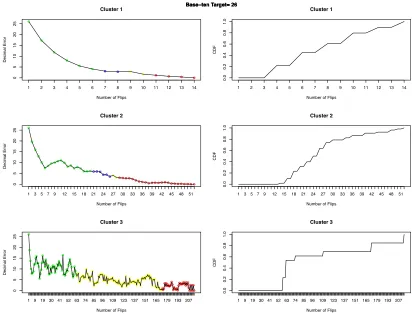
number 26 and the CDF of the present population at each flip. ... 40 Figure 6.1. Students’ distribution based on their CS constructs average scores. ... 71
Figure 7.1. A sample programming artifact submitted for the bubble sort challenge and its corresponding abstract syntax tree. ... 80 Figure 7.2. An AST generated from a sample programming artifact submitted for the
bubble sort challenge and its hierarchical n-gram encoding. ... 82 Figure 7.3. An AST generated from a sample programming artifact submitted for the
CHAPTER 1:
INTRODUCTION
Recent years have seen a growing interest in K-12 computer science curricula. As technology transforms our everyday lives at a rapid rate, it is creating an increasing demand for skilled computer scientists. However, there are not enough students attending and graduating from computer science related fields to fill these positions (2018 State of Computer Science Education Policy and Implementation Advocacy Coalition, 2018). A solution to this rapidly increasing need is to provide appropriate and inclusive CS education to K-12 students to encourage and enable them to join this field. There are many challenges involved in providing effective CS education to students. Designing appropriate curricula, offering sufficient scaffolding and support, providing access to CS education opportunities, and promoting inclusion are some of the important challenges that CS education research aims to answer.
Among the most important challenges faced by CS education research is the
assessment of students’ CS and CT competencies. Effective assessment of students’ CS and CT focal knowledge, skills, and abilities enables educators to provide students with the appropriate scaffolding and support they need. However, due to the dramatic growth in students' interest in computer science, providing every student with individualized, high-quality, and timely support and feedback has become more challenging. Effective automated and semi-automated assessment tools can help bridge the gap between the demand for support and restricted resources by providing adaptive formative and summative feedback.
minority students. An effective way to improve students’ motivation and engagement while learning is to use game-based learning environments (Clark, Tanner-Smith, & Killingsworth, 2016). Recent years have seen significant growth in the design and development of game-based learning environments. A growing body of research is investigating the potential of such environments to foster students’ learning and engagement (Clark et al., 2016; Rowe, Shores, Mott, & Lester, 2011; Sabourin & Lester, 2014). As an example, many studies have shown that learning through game-based environments results in higher motivation for learning compared to learning through conventional methods (Cordova & Lepper, 1996; Shute & Ventura, 2013). Intelligent game-based learning environments can take advantage of motivational elements of games in addition to adaptive learning support of intelligent
tutoring systems (ITSs) (Jackson & McNamara, 2013). Similar to ITSs, intelligent game-based learning environments use data obtained from students’ learning interactions to build models of students’ cognitive, affective, and metacognitive states (Lester et al., 2013; Min, Mott, Rowe, Liu, & Lester, 2016; Wouters, Van Nimwegen, Van Oostendorp, & Van Der Spek, 2013). The resulting learner models can then be used to provide students with adaptive problem-solving scenarios, cognitive feedback, and affective support (Brusilovsky & Millán, 2007; Min et al., 2017).
The process of inferring students’ cognitive, affective, and metacognitive states by collecting performance data from their interactions with an education environment is called stealth assessment (Shute, 2011). Utilizing a stealth assessment framework, we can
feedback to students. Consequently, game-based learning environments provide a robust platform for engaging students in learning CS and CT concepts, while enabling educators to unobtrusively assess their competencies.
Following a stealth assessment approach, we analyze data from students’ interactions with ENGAGE, a well-structured, problem-based, game-based learning environment that is designed to teach middle-school students’ the basics of block-based programming and computational thinking to assess their problem-solving strategies and CS knowledge, skills, and abilities.
1.1 Problem
This work focuses on assessing two important aspects of CS and CT proficiencies: problem-solving strategies as demonstrated in students’ interactions with a computational thinking challenge, and proficiency in CS FKSAs as demonstrated in programming artifacts. Research has shown that problem-solving strategies can profoundly affect students’ learning outcomes (Eagle & Barnes, 2014; Rowe, Baker, Asbell-Clarke, Kasman, & Hawkins, 2014). Further, problem-solving proficiency is an important skill for solving computational thinking problems (Sengupta et al., 2013; Weintrop et al., 2016). For example, problem-solving is introduced as one of the four main practices in Weintrop et al.’s (2016) computational thinking framework.
approach to build a semi-automated framework for assessing students’ programming artifacts’ algorithmic quality based on a training dataset labeled by the devised rubric. Conducting effective assessment is the first step in providing students with the adaptive scaffolding and support they need to thrive in this field. Furthermore, assessing students’ CS and CT competencies provides instructors with summative feedback about their instruction.
In this dissertation, we present a stealth assessment framework for assessing students’ CS and CT competencies as demonstrated through their interactions with the ENGAGE game-based learning environment and resulting programming artifacts. Below, we explain our approach for conducting stealth assessment corresponding to each aspect of CS and CT proficiencies.
1.2 Approach
To identify students’ problem-solving strategies when solving a computational thinking problem, we present an approach to stealth assessment that leverages a novel temporal analytics framework that utilizes students’ problem-solving strategies to infer their post-test performance. Building on findings that show problem-solving strategies significantly influence learning outcomes (Eagle & Barnes, 2014; Rowe et al., 2014), we cluster students based on a set of n-gram encoded features and investigate whether problem-solving strategies identified from clustering students’ interaction patterns can improve the predictive accuracy of evidence models for stealth assessment.
progress through a series of learning tasks, their choice of strategy affects their learning outcomes. For example, if a student incorporates a trial-and-error approach for initial tasks when she is not familiar with the challenge and later switches to a more effective strategy, her strategy shift might be an indicator of learning, as demonstrated through higher post-test scores. We hypothesize that drawing inferences about strategy shifts may serve as an
efficient basis for accurate predictions of learning performance.
Because both strategy and strategy shifts are determined through dependent interactions over time, we propose a strategy-based temporal analytics approach to stealth assessment based on long short-term memory networks (LSTMs). In this approach, we develop predictive models that capture the temporal dependencies between students’ dynamically changing problem-solving behaviors. Findings demonstrate that the strategy-based temporal analytics framework achieves higher predictive accuracy compared to
baseline models that do not capture strategic temporal dependencies. Furthermore, our results show that the strategy-based temporal analytics framework utilizing both student problem-solving behavior traces and pre-test performance outperforms a model that uses only pre-test data. The results suggest that strategy-based temporal analytics can serve as the basis for effective stealth assessment in game-based learning.
assess CS practices, such as generating appropriate algorithms and programming artifacts, debugging and refinement strategies, and appropriate usage of computer science constructs, such as loops and conditionals. Qualitative analyses reveal distinctive patterns in students’ approaches to computational problem solving that can inform middle school instructors of the methods that best promote students’ CS competencies in their classrooms. We further revise the rubric based on preliminary results obtained from piloting the rubric on data collected from students’ paired gameplay. We then apply the refined rubric on data collected from a larger population of students who interacted with the game individually.
One of the goals of this dissertation is to present a semi-automated assessment framework that can evaluate students’ CS competencies based on their submitted
programming artifacts. To this end, we devise a supervised learning approach that utilizes the revised rubric to label a corpus of programming artifacts. Applying this rubric reduces the amount of noise in the training dataset, which results from graders’ subjective opinions about the quality of a programming artifact. Utilizing an ECD-based rubric, we can reduce this noise by guiding instructors to follow a unified approach to assessing programming artifacts.
We further encode programming artifacts as structural n-grams to extract essential structural and semantic information within them. Finally, we utilize a variety of
set. We discuss our proposed stealth assessment framework design and evaluation in details in Chapters 4-7.
1.3 Thesis Statement and Hypotheses
The objective of this dissertation is to build an effective stealth assessment framework to assess students’ CT proficiencies and CS FKSAs while interacting with game-based learning environments. In this dissertation, we aim to investigate the following thesis statement:
Stealth assessment is an effective approach for unobtrusive, effective and accurate evaluation of students’ CT proficiencies and CS focal knowledge, skills, and abilities in game-based learning environments.
To effectively evaluate this thesis statement, the individual components of the framework should be explored.A key challenge posed by stealth assessment is translating the raw data into meaningful representations necessary for modelling students’ skills and performance (Shute & Ventura, 2013). Another important factor that must be considered when addressing this challenge is the dependency among students’ consecutive actions within a learning environment. Focusing on these aspects, the proposed dissertation will specifically investigate the following hypotheses:
• H1. Students’ computational thinking proficiencies can be effectively inferred by
utilizing their problem-solving strategies identified from their interactions with a computational thinking problem in a well-structured game-based learning
o H1.1 Clustering students’ patterns of interaction within a well-structured educational game while solving a computational thinking problem can identify their problem-solving strategies.
o H1.2 Students’ problem-solving strategies over similar tasks can be utilized to infer their knowledge of the corresponding computational thinking
proficiencies.
o H1.3 Utilizing the temporal dependency among students' choice of problem-solving strategies over consecutive, similar tasks can improve the prediction accuracy of the model in regard to students' post-test performance.
• H2. Students’ CS FKSAs can be effectively assessed based on their programming
trajectories.
o H2.1 Students' knowledge of essential CS constructs can be assessed based on their block-based programming artifacts.
o H2.2 Students’ common testing and refining approaches while solving a computational problem using block-based programming can be assessed using their programming trajectories.
o H2.3 The effectiveness of students' testing and refining approaches can be assessed by exploring the relationship between their knowledge of essential CS constructs, in-game behavior, and their testing and refining patterns.
• H3. Utilizing a supervised learning approach, programming artifacts’ algorithmic
programming artifacts when solving an algorithmic problem in a well-structured game-based learning environment.
o H3.1 Important structural and ordinal information within students’ block-based programming artifacts can be preserved by performing appropriate feature engineering.
o H3.2 Students' algorithmic proficiency can be accurately inferred from their submitted programming artifacts encoded as structural n-grams.
o H3.3 The accuracy of the predictive model can be improved by considering the noise in the graded assignments.
1.4 Contributions
We have designed a comprehensive stealth assessment framework to effectively and unobtrusively assess students’ CT proficiencies and CS FKSAs from data collected from their interactions with a computational thinking game-based learning environment. The contributions are as follows:
• A novel strategy-based temporal analytics framework to assess students’ computational thinking knowledge and skills (Akram et al., 2018).
o An assessment framework for identifying students’ problem-solving strategies based on their interactions with a game-based learning environment while solving well-structured computational thinking problems.
o An assessment framework for assessing students’ conceptual understanding of CT concepts based on their identified problem-solving strategies over
• A qualitative assessment framework for assessing students’ CS focal knowledge, skills, and abilities, such as the ability to effectively test and refine their programs, and the ability to develop appropriate algorithms (Akram et al., 2019).
o An assessment framework for assessing students’ knowledge of essential CS constructs such as algorithms, loops, and conditionals.
o An assessment framework for identifying students’ patterns of testing and refining their programming artifacts.
o An assessment framework for assessing students’ problem-solving efficiency.
• A systematic and automated framework for accurate and effective assessment of programming artifacts’ algorithmic quality based on students’ generated block-based programming artifacts. This framework can effectively handle the noise in the training dataset by following a blended hypothesis-driven assessment design
approach for assessing and labeling students’ data and by incorporating a supervised learning technique that can deal with noise.
o A feature-engineering approach for effectively extracting structural features from students’ block-based programming artifacts. To capture hierarchical and ordinal information within the programming artifacts, this approach encodes students generated artifacts as structural n-grams.
regression to assess students’ generated programming artifacts based on previously graded artifacts.
1.5 Organization
The remainder of this dissertation is organized as follows. Chapter 2 discusses background and related work on computer science education, evidence-centered assessment design, problem-solving strategy assessment, programming assessment, game-based learning environments, and stealth assessment. Chapter 3 discusses the stealth assessment data corpora along with the ENGAGE game-based learning environment. Chapter 4 describes the strategy-based temporal analytics framework. Chapter 5 discusses the design and
CHAPTER 2:
BACKGROUND AND RELATED WORK
2.1 Computer Science Education
Computer Science (CS) and Computational Thinking (CT) have become a foundational skill for students to thrive in a digital economy (Hansen et al., 2017; K-12 Computer Science Framework, 2016).To prepare students for future studies and professions in Science, Technology, Engineering, and Math (STEM), it is essential to ensure that they acquire sufficient CS and CT competencies. There is no universally accepted definition of
computational thinking and its practices among researchers and practitioners (Brennan & Resnick, 2012). In this work, we focus on a computational thinking framework proposed by Weintrop and colleagues (Weintrop et al., 2016) that identifies four main practices for computational thinking: data practices, modeling and simulation practices, computational problem-solving practices, and systems thinking practices.
A key strategy for developing CS and CT is through programming. However, learning how to program is challenging for novices, in part because of the intricacies of syntax in text-based programming languages (Grover & Basu, 2017; Grover et al., 2017). Block-based programming environments have emerged as a promising mechanism for introducing computational thinking to novices (Grover & Basu, 2017; Price, Dong, &
such as abstraction, decomposition, and iterative testing and refinement of programming artifacts.
2.2 Computer Science Assessment
To provide students with the most helpful scaffolding and feedback, it is important to build effective assessments that can evaluate their CS and, in particular, programming
competencies (Fields, Giang, & Kafai, 2014; Grover et al., 2017; Meerbaum-Salant, Armoni, & Ben-Ario, 2013). Conducting effective assessment lays the foundation for providing students with adaptive pedagogical strategies such as offering hints, feedback, and appropriate next problems. Consequently, efforts have also begun to develop effective instruments for assessing CS FKSAs (Grover & Basu, 2017; Grover et al., 2017; Seiter & Foreman, 2013).
2.2.1 Evidence-Centered Assessment Design
A particularly promising approach to assessment is evidence-centered design (ECD). ECD has been used successfully to assess students’ skills and knowledge constructs in a broad range of game-based learning environments and simulations (Akram et al., 2018; Min et al., 2017; Mislevy, 2013; Shute, Ventura, & Kim, 2013; Shute, Wang, Greiff, Zhao, & Moore, 2016). The ECD process of assessment development relies on data drawn from students' actions during a learning task to make inferences about students' knowledge and skills (Mislevy & Haertel, 2007; Mislevy, Steinberg, & Almond, 2003). Following an ECD
a conceptual assessment framework to shape the specifications of an assessment of FKSAs. The conceptual assessment framework consists of: 1) the student model, which represents what students know or can do, 2) the evidence model, which contains behavioral evidence that drives the student model, and 3) the task model, which contains tasks that elicit the behaviors of interest that provide evidence (Grover & Basu, 2017). Student actions (i.e., behaviors) during the learning task are used as evidence in the conceptual assessment framework model for representing FKSA goals set in the assessment. An important phase of this work is to match evidence derived from student actions in the game to FKSA goals in the assessment.
In the following sections, we review some of the previous work in assessing CT proficiencies, in particular problem-solving strategies, and programming including block-based and text-block-based programming assessments. Additionally, in each section, we explain in detail how we utilized the evidence-centered assessment design framework for devising the stealth assessment framework within the ENGAGE game-based learning environment. 2.2.2 Problem-Solving Strategy Assessment
are categorized as low, medium, or high. To account for the quality of hypothesis in the final model, the researchers assigned a weight to each of the observations based on the utilized strategy for generating the hypothesis. An evaluation of the predictive accuracy of the final model with regard to within-game and post-game performance showed a higher accuracy when taking the quality of strategies into account compared to a model that considers domain knowledge exclusively.
Another attempt to model strategy focused on selecting features for classifying students’ efficiency in solving challenges (Malkiewich, Baker, Shute, Kai, & Paquette, 2016). In this work, the problem-solving efficiency is determined through badges assigned to students upon completing a task based on the efficiency of their incorporated solution. Efficient solutions receive a gold badge, while non-optimal solutions receive a silver badge. To evaluate the effect of a set of pre-defined features in predicting the efficiency of students’ problem-solving strategies, two J48 decision-tree based classification models were built to predict whether a student will receive a gold or silver badge. A set of pre-defined features are tested in both models to measure their effectiveness in predicting whether a student receives a gold badge (i.e. acquired an optimal strategy) or a silver badge (acquired a non-optimal strategy). Their results demonstrated that features representing students’ general behavior that spans over multiple tasks are more predictive of students’ performance compared to features representing students’ task-specific behaviors.
in-game strategy utilization per task, and then use sequences of in-in-game strategy features over multiple tasks to predict their post-test performance. We use n-grams of students’ sequences of interactions with the game environment to cluster them based on their in-game strategy. n -grams are commonly used in classifying text and temporal data (d’Aquin & Jay, 2013; Xing, Pei, & Keogh, 2010). For example, in one study, the n-gram approach is applied on students’ sequences of actions available in a modeling software to generate features representing their modeling practices (Quigley, Ostwald, & Sumner, 2017). The generated n-grams were then used along with other features including variety and frequency of the performed actions to classify students based on the teacher who led the modeling activity.
2.2.3 Text-Based Programming Assessment
This section presents a review of the work done on automated assessment of text-based programming artifacts. Although block-based programming differs from text-based
programming in syntax and visual representation, they can both be transformed into the same intermediate representation. Therefore, the techniques used for assessing one type of
programming can be adapted to assess the other type of programming. There are two primary categories for assessing text-based programming artifacts: static assessment and dynamic assessment (Ala-Mutka, 2005; Ihantola, Ahoniemi, Karavirta, & Seppälä, 2010).
In dynamic assessment of programming artifacts, programs are executed against pre-defined test data to determine their correctness. Evaluation metrics include successful compilation, consideration of security threats, generation of expected outcome, and
character-by-character comparison between the results generated by students’ submitted code and the expected results. Some other examples of dynamic program assessment systems are CourseMaker (Pratt, 2003), Online Judge (Cheang, Kurnia, Lim, & Oon, 2003) and BOSS (Joy, Griffiths, & Boyatt, 2005). Another category of dynamic assessment is designed to evaluate students’ capability in testing and refining their own code. An example is Assyst (Jackson & Usher, 1997) that assesses students' test data suite by its coverage of all the program’s paths. Another example of this category of dynamic assessment is used by Chen et al. (2004) that assesses a student’s test data suite by running a series of buggy programs against it (Chen, 2004). Although dynamic assessment approaches are very helpful in uncovering execution errors, they fail to assess partial solutions or solutions with bugs.
Another important category of automated assessment is static assessment. Static assessments are capable of assessing programs that are not necessarily complete. To perform a static assessment, an intermediate representation of the program should be selected and generated from the source code. Examples of intermediate representations are textual representations, abstract syntax trees, control flow graphs, and program dependence graphs. After forming the intermediate representation, the representation is analyzed for its
correctness, efficiency, and quality. In static assessments, correctness is usually assessed through character analysis, string analysis, syntax analysis, and semantic analysis. Quality is assessed by software metrics such as number of lines of code, number of variable statements and expressions, and also through plagiarism detection.
Work by Wang and colleagues (Wang, Su, Wang, & Ma, 2007), follows a semantic similarity-based approach to assess the correctness of a C programming artifact by
of program artifacts by conducting a set of program standardizations including expression, control structure, and function invocation standardization. They also remove redundant statements, rename variables and reorder statements to make programs avoid unnecessary variations in students’ codes. Then, they calculate a similarity factor based on size, structure and statement similarity subfactors weighted by grading criteria. The equation for calculating the similarity score of an assignment in comparison to a correct program model is
demonstrated in Equation 2.1.
𝑆𝑒𝑚𝑎𝑛𝑡𝑖𝑐𝑆𝑖𝑚 = 𝜆+,-.× 𝑆𝑖𝑧𝑒𝑆𝑖𝑚 + 𝜆+345× 𝑆𝑡𝑟𝑢𝑐𝑡𝑢𝑟𝑒𝑆𝑖𝑚 +
𝜆+383× 𝑆𝑡𝑎𝑡𝑒𝑚𝑒𝑛𝑡𝑆𝑖𝑚 (2.1)
Two other common applications of automated assessment of programming artifacts are software evaluation and plagiarism detection. In software evaluation, software
verification tools automatically check functional correctness properties of the program, including the absence of bugs that could make memory violations or raise runtime errors. Examples of common software evaluation approaches are symbolic execution (King, 1976), model checking (Clarke, 2008), and abstract interpretation (Cousot & Cousot, 1977).
Plagiarism detection tools use a variety of techniques to measure the similarity of different programming artifacts to warn about possible plagiarism. Some of the common techniques used by plagiarism tools are attribute-based comparison, token-based comparing, and structure-based comparison (Martins, Fonte, Henriques, & da Cruz, 2014). An important example of a plagiarism tool is Moss (Hage, Rademaker, & Van Vugt, 2010), which uses a token-based comparison to identify and present the pieces of codes that are similar.
overall grade that is unable to specify any details on the specific concepts, skills, and knowledge that students are missing. In an educational context, this information is essential for providing students with the appropriate scaffolding and support they need. In order to provide students and their instructors with detailed and interpretable automated assessments, we follow a hypothesis-driven learning analytic approach to assess students’ programming artifacts (Grover et al., 2017). In the following section, we describe this framework in detail. Furthermore, we describe how our devised assessment fits in this framework.
2.2.4 Block-Based Programming Assessment
Block-based programming languages have become an increasingly central part of new K-12 CS/CT curriculum. As a result, it has become important to design effective approaches to assessing CT in block-based programming environments. In early work, Koh presented two metrics for measuring computational thinking using program behavior similarities and
computational thinking pattern graphs in order to compare two programs with respect to their computational pattern similarity (Koh, Basawapatna, Bennett, & Repenning, 2010).
Assessing computational thinking has also been widely investigated for informal learning environments. For example, Xie and Hal explored student skill progression and its
evidence of students’ understanding of certain functions necessary to the context of the programming assignment. Finally, a qualitative analysis of the design patterns leads to an assessment of students’ proficiency in certain computational thinking concepts. In a related approach, Grover et al. presented an ECD-based assessment method to measure novice learners’ misconceptions about loops, variables, and Boolean logic (Grover & Basu, 2017). While these approaches provide great insight on students’ understanding of CS and CT constructs, they require extensive manual analysis. As a result, these approaches are not scalable.
In two parallel efforts, Diana et al. have followed a string analysis approach to assess students’ block-based programming artifacts (Diana et al., 2017a, 2017b). They used a token-based approach to generate code-chunks from the programming artifacts and generated a feature set that contains the count number of each of the code-chunks. They used a ridge-regression model to infer the grades for programming artifacts based on previously graded artifacts. In a follow up work, they used seed-based selection and L1-regularization through lasso regression to perform feature selection. This work does not consider the noise in the training dataset when conducting the prediction. Although they propose an instructor dashboard in their work, their assessment approach can only generate overall reports of the classroom and general grades for each student.
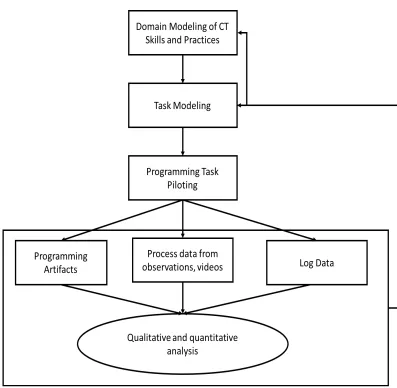
In a broader interdisciplinary effort, Grover et al. proposed a hypothesis-driven
to the domain modeling phase in the evidence-centered assessment design approach in which the FKSAs are identified in collaboration with field experts, instructors, and assessment designers. In the task modeling phase, identified FKSAs guide the design of programming tasks that can provide relevant evidence of students’ competencies, as well as the design of corresponding rubrics that can relate the prior evidence to identified FKSAs. Finally, in the programming task piloting phase, the designed tasks are piloted and multiple datasets are collected in the form of programming artifacts, process data from observations and videos, and log data. The collected data is then analyzed through a variety of quantitative and qualitative approaches and the combined results are utilized for the refinement of the identified FKSAs and programming tasks.
To automatically assess students’ programming artifacts, we use the devised rubric to manually grade students programming artifact submissions. We then transform the block-based programming artifacts to their corresponding abstract syntax trees. Subsequently, we extract structural n-grams to preserve ordinal and hierarchical information that can represent the semantic relationships in a programming artifact. We then use a supervised learning approach to automatically assess newly-submitted programming artifacts based on a corpus of graded artifacts. A similar approach to feature extraction is explored in a work by Zhi et
Figure 2.1. Adapted hypotheses-driven learning analytic framework. The rubric design and learning analytics process for assessing students’ block-based
al. (2018). In their work, they utilize pq-grams (p-1 immediate ancestors of each node and q of its children in an abstract syntax tree) to identify important features within students’ programming artifacts (Zhi, Price, Lytle, Dong, & Barnes, 2018). They use the previously-identified features to reduce the state space of possible solutions. The reduced state space is then used to provide students with adaptive feedback based on the closest successful solution.
2.3 Game-Based Learning Environments
2.4 Stealth Assessment
Stealth assessment can assess learners’ competencies solely based on data obtained from their interactions with the game-based learning environment. This approach enables the ITS to assess learners’ competencies without interfering with their natural flow of learning (Shute, 2011). Stealth assessment uses evidence derived from students’ game-based learning activities to infer students’ competencies with respect to knowledge, skills, and performance, often utilizing evidence-centered design (ECD) (Mislevy et al., 2003).
In game-based learning environments, stealth assessment can build a dynamic
competency model of the student by monitoring his granular behaviors across multiple tasks to generate evidence for the model. Following this dynamic, stealth assessment has been used to unobtrusively assess a wide range of constructs (Wouters et al., 2013). Since stealth
assessment can continuously assess students’ competencies during gameplay, it can provide formative feedback to students and teachers to inform instruction and enhance learning (Chen, Gully, & Eden, 2001; Kerr & Chung, 2012; Shute & Ventura, 2013).
In one attempt to conduct stealth assessment, a directed graphical model was built based on relevant competencies, and related variables were extracted from the observed data to be used as evidence for the targeted competencies (Kim, Almond, & Shute, 2016).
In another approach, Falakmasir and colleagues investigated two hidden Markov models (HMMs) trained for high-performing and low-performing students (Falakmasir, González-Brenes, Gordon, & DiCerbo, 2016). Subsequently, for observed sequences of events, log-likelihoods of belonging to each HMM were calculated. Finally, the difference between the two log-likelihoods was used in a linear regression model to predict post-test scores. This approach reduces the need for labor-intensive domain knowledge engineering.
An alternative approach to stealth assessment is to use artificial neural networks. This approach is offered by DeepStealth, a stealth assessment approach that uses deep neural networks (Min et al., 2015). DeepStealth used a deep feedforward neural network (FFNN) to learn multi-level, hierarchical representations of the input data for evidence modeling. This work leverages a variety of features including domain-expert engineered input features and external learning features. Their results showed the effectiveness of their proposed FFNN in predicting students’ post-test performance. In a subsequent work, they addressed the
structural limitations in the FFNNs using a long short-term memory network-based stealth assessment framework (Min et al., 2017).This work utilizes an end-to-end approach for assessing students’ competencies using raw data obtained from students’ interactions with an educational game environment.
CHAPTER3:
STEALTH ASSESSMENT DATA CORPORA
The data used for this dissertation is collected from students’ interactions with a game-based learning environment named ENGAGE that is designed to develop middle-grade students’ computational thinking competencies and block-based programming skills. In this chapter, we describe the ENGAGE learning environment, its in-game problem-solving challenges that we are using as testbeds for our stealth assessment framework, and the stealth assessment data corpora.
3.1 ENGAGE Game-Based Learning Environment
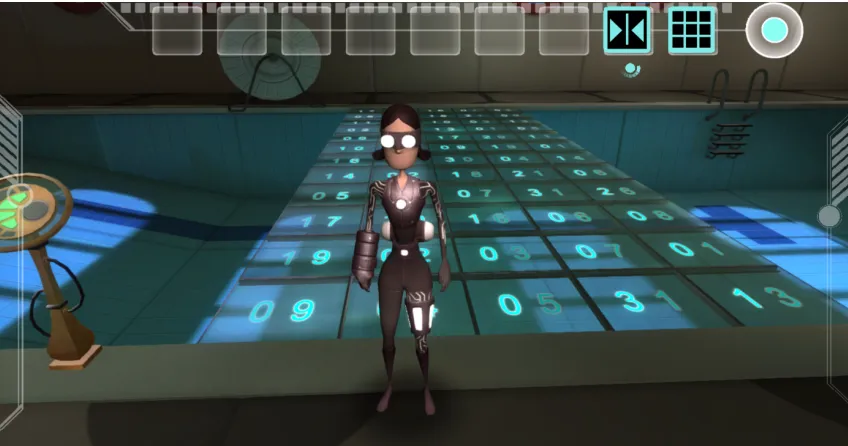
ENGAGE is a game-based learning environment designed to introduce computational thinking to middle school students (ages 11-13). A sample binary to decimal challenge from the ENGAGE game is presented in Figure 3.1. The game was developed with the Unity multi-platform game engine and features a rich, immersive 3D story world for learning computing concepts (Buffum et al., 2016). The game-based learning environment present students with challenges that require problem solving and programming to promote computational thinking skills including abstraction and algorithmic thinking. The computational challenges within the game are designed to prepare middle school students for computer science work in high school, and to promote positive attitudes toward computer science.
Multiracial. The research team worked closely with a similarly diverse group of teachers throughout the project. A subset of teachers helped to co-design the game-based learning activities providing iterative feedback throughout development. Each of the teachers implementing the game in their classrooms attended either one or two summer professional development workshops that introduced computational thinking concepts and the ENGAGE game-based learning environment.
In the game, students play the role of a specialist who is sent to investigate an
underwater research facility that has lost communications with the outside world. As students progress through the game, they discover that Murdock, a rogue scientist, has taken control of the computing devices within the facility. Students navigate through a series of
interconnected rooms and solve a set of computational challenges while interacting with a programming interface that controls devices.
To solve each challenge, students need to operate devices either by programming them or interacting with them in reference to their pre-written programs. Students use a visual block-based programming language to program the devices (Min et al., 2017). Students are accompanied throughout the game by some non-player characters who help them progress through the narrative, and provide them with clues, and positive reinforcement (Min et al., 2015).
To complete the game, students need to finish three major levels: the Introductory Level, in which students learn the basics of the game and simple programming; the Digital World Level, in which students learn how digital data is represented with binary sequences; and the Big Data Level, in which students have the opportunity to work with various datasets and retrieve hidden information by cycling through data and filtering it based on different variables.
3.2 Corpus A - Binary Challenge
This section presents information about the study that is done to analyze our first hypothesis. Following, the backstory and game play for the binary challenges, binary related challenges within the ENGAGE game that are used as the testbed for this study, is described.
3.2.1 Backstory and Game Play
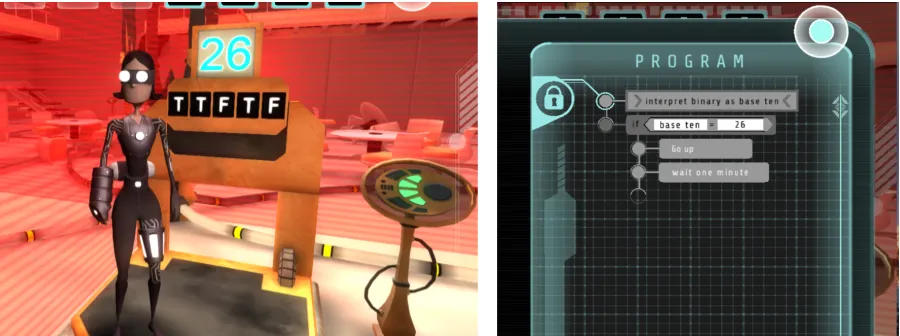
corresponding tile on the tile panel (Figure 3.2, left). The decimal representation of their generated binary number will be presented on a small screen above the panel. Students can find the target number by reviewing an existing program (Figure 3.2, right) associated with the binary lock device. For example, to advance to the next task, students must flip binary tiles on the binary lock device to generate the target decimal number (Figure 3.2, left), execute its program, and unlock the binary device. Similarly, the second set of tasks in the Digital World level features lift devices that are activated when students generate the target base-ten value by flipping binary tiles and execute the program associated with the lift.
Through these tasks, students learn about the concept of bits in binary numbers and the weight assigned to each bit. In the analyses reported here, we used behavior trace data from students’ interactions with 11 binary tasks from the Digital World level, where students learn the weights associated with each of the five bits through the first five tasks and then learn how to combine multiple bits to make more complex numbers with binary
Figure 3.2. Binary challenge. (Left) a binary lock device that students must unlock. The T (true) tiles indicate the bits are 1, whereas F (false) tiles denote 0. The current binary number is 11010 and the corresponding base-ten number, 26, is displayed on the
representations. To teach variations of binary representations, the game enables students to flip tiles between ‘0’ and ‘1’, ‘black’ and ‘white’, and ‘F’ (False) and ‘T’ (True).
3.2.2 Data Collection
We analyzed 244 students’ behavior trace data obtained from a teacher-led study in four public middle school classrooms in the United States. On average, students play throughout the game over the course of two weeks. To support collaborative learning, we collected student behavior trace interaction data from pairs of students in which they took turns serving as navigator (traversing the game) and driver (action planning). Collaboration has shown to positively effects students’ learning in computer science education (Buffum et al., 2016). Pre- and post-test assessments measuring computer science attitudes (Wiebe, Williams, Yang, & Miller, 2003), self-efficacy (Chen et al., 2001) and content knowledge (e.g., binary representation) were completed individually by students before starting the Digital World level (pre-test) and immediately after finishing it (post-test). Both pre-test and post-test are on a scale of 0 to 1.00. Out of 244 students, 168 students completed the pre-test and post-test for content knowledge as well as all 11 binary representation tasks for this level. The results of conducting a paired t-test on students’ content knowledge pre-test (M=0.44, SD=0.20) and post-test (M=0.59, SD=0.24) revealed a significant improvement from pre-test to post-test scores (t (167) =11.24, p<0.001).
3.3 Corpus B - Bubble Sort Algorithm
3.3.1 Backstory and Game Play
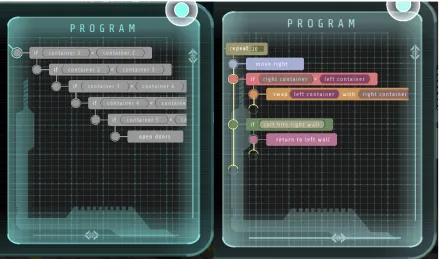
In this study, we focus on students' problem-solving approaches within a specific level of the game where students write a bubble sort algorithm to order a set of radioactive containers (Figure 3.3). This room has two devices: a containment device which holds six randomly positioned containers and a lock device which opens only when the containers are sorted in the increasing order. The player can escape the room through a door by correctly
implementing bubble sort and executing the lock program when the containers are sorted. The lock has a pre-written program that will check the positions of containers and opens if they are in the correct positions (Figure 3.4, left). The containment device provides students with the necessary blocks for implementing a bubble sort algorithm using a small robotic arm inside the device’s protective housing (Figure 3.4, right). Students need to test the correctness of their program in two steps. First, they need to run the bubble sort device to sort the
containers. Second, they need to run the open lock program which checks if the containers are sorted and opens the door accordingly.
3.3.2 Data Collection - Round 1
Figure 3.4. Bubble sort challenge door and containers programs. (Left) the door lock program that opens the door if the containers are sorted. (Right) an example of a bubble
sort algorithm implemented through block-based programming environment. Figure 3.3. Bubble sort challenge. The bubble sort challenge in the game-based learning
content knowledge which were completed individually by the students before and after the game. Both the pre-test and post-test cumulative scores are reported on a scale from 0 to 1. 3.3.3 Data Collection - Round 2
In the second round of the study, we captured similar game-play data from students’ individual game-play. In this round of study, students’ played with the Engage game individually with a new pre- post-test assessment that measure students general
CHAPTER 4:
IMPROVING STEALTH ASSESSMENT IN GAME-BASED LEARNING ENVIRONMENTS WITH
LSTM-BASED ANALYTICS
4.1 Modeling Students’ Problem-Solving Strategies
Students exhibited a broad spectrum of problem-solving strategies while solving the binary challenges in the Digital World level. For example, some students pursued random trial-and-error strategies to find solutions, while at the other end of the spectrum, some students pursued thoughtful systematic approaches to solve the challenge. As would be expected, some students fell in the middle of this spectrum by utilizing more thoughtful trial-and-errors. For each of the 11 consecutive binary challenges, students’ tile-flip sequences are used to cluster them into distinct groups. Subsequently, these clusters are interpreted in terms of the problem-solving strategies exhibited by members of each cluster. Below, we first describe the process of clustering students’ in-game strategies based on their binary tile flip sequences and then describe the most common problem-solving strategy in each cluster. 4.1.1 Methodology
In order to group students based on their problem-solving strategies, features are derived from students’ binary tile flip sequences. The flip sequences are encoded as n-grams, commonly used as a representation for sequential data such as text and speech (Xing et al., 2010), as well as for sequential trace data (Falakmasir et al., 2016). Sequences of n adjacent elements are extracted from the original string. Each unique n-gram is a feature in our feature vector. The value for each n-gram for each flip string is the frequency of the n-gram’s
Since each task differed slightly from the other tasks, students problem-solving behavior were analyzed separately for each task. For each of the 11 binary challenges, students’ behaviors (i.e., the flip sequence generated for that specific task) are clustered based on the extracted n-gram features. This resulted in 11 sequential cluster-memberships per student. In the following sections, we describe how we identified different problem-solving strategies using the proposed clustering method.
4.1.2 Feature Engineering
Students’ problem-solving behavior were analyzed for 11 consecutive binary tasks. Here, each task refers to generating the binary representation of a decimal number determined by a program that operates the device associated to this task (e.g., 16 in Figure 3.2). Each device features a panel with five tiles which is set to 00000 by default representing the binary number. Considering tiles’ indices starting at one from the right most tile, if a student has flipped tile number four (i.e., 01000 with the decimal representation of 8), followed by flipping tile number five (i.e., 11000 with the decimal representation of 24), their tile flip string would become {4, 5}. Students’ interactions with binary flips are extracted in the format of a string containing students’ consecutive flips of the binary tiles for each task.
from each flip string. For example, a total of 2,495 unique n-grams with at least three
occurrences were extracted from the student flip strings generated for one of the tasks. These n-gram feature vectors are then used to cluster students’ in-game strategy use per task, and an n-gram feature vector is generated separately for each of the 11 tasks. Each student’s per-task behavior is represented with an n-gram feature set, in which the value for each feature is the number of occurrences of the specific n-gram in the student’s flip string.
Flip strings provide a fine-grained representation of students’ problem-solving behaviors in solving binary representation challenges and their adopted strategies. As an example, consecutive flips of the same tile (i.e., double flips) by a student can be an indicator of the student’s intention to learn the weight assigned to that binary digit. Further, the overall number of flips conducted to generate the target base-ten value can be used to gauge the students’ overall efficiency in solving the problem.
4.1.3 Clustering
Next, expectation-maximization (EM) clustering (Dempster, Laird, & Rubin, 1977) is
applied on students’ flip behaviors represented by n-gram feature vectors to identify students’ problem-solving strategies. Because each of the 11 tasks in the Digital World level targets a different base-ten number, the binary code needed to solve the task is different.
and nine clusters emerged most frequently when we explored the number of clusters between two to ten. A preliminary investigation on these different number of clusters found that three clusters showed coherent patterns for problem-solving strategies across all tasks, and we thus chose three as the number of clusters for all tasks in this work.
4.1.4 Interpreting Clusters
To interpret students’ problem-solving strategies using the clusters as identified above, two novel methods that consider the error between the target value and the student-generated value are presented. To analyze students’ problem-solving patterns for each cluster of each task, the average error at each flip relative to the solution target for students who belong to the same cluster is calculated. As the default value on each device binary panel is 00000, all of the students start with the same non-zero initial error. For each task, only students who completed the task successfully are included. Hence, the average error for each cluster decays toward zero. We expect to observe distinct error-decay patterns across the three clusters. In addition to decimal error, an error measurement based on the hamming distance between the binary representation of the target value and the students’ generated binary number: the binary error is introduced. Both decimal and binary errors are described in details below.
over time (number of flips) is then plotted where the x-axis shows the flip number and the y-axis shows average error in that flip for students in that cluster. For example, in flip number one, the y-axis shows the average decimal error of everyone in that cluster after the first flip. Because the total number of flips is different for each student in a cluster, the decimal error value of zero is used for students who already completed the task and the average decimal error is calculated over all students in the cluster. For example, suppose there are two
students in a cluster, where student A’s decimal error sequence is {2, 1, 2, 0} and student B’s error sequence is {2, 0}. The task is to generate a base-ten number with the value two using
Figure 4.1. Students' average decimal and binary error at each flip when generating binary representation of number 26. (Left) students' average decimal error at each flip.
(Right) students' average decimal error at each flip.
. 0 5 10 15 20 25
Number of Flips
Decimal Error
1 2 3 4 5 6 7 8 9 10 11 12 13 14
Cluster 1 0.0 0.5 1.0 1.5 2.0 2.5 3.0
Number of Flips
Binar
y Error
1 2 3 4 5 6 7 8 9 10 11 12 13 14
Cluster 1 Base−ten Target= 26
0 5 10 15 20 25
Number of Flips
Decimal Error
1 3 5 7 9 12 15 18 21 24 27 30 33 36 39 42 45 48 51 Cluster 2
0.0
1.0
2.0
3.0
Number of Flips
Binar
y Error
1 3 5 7 9 12 15 18 21 24 27 30 33 36 39 42 45 48 51 Cluster 2
Base−ten Target= 26
0 5 10 15 20 25
Number of Flips
Decimal Error
1 9 19 30 41 52 63 74 85 96 109 123 137 151 165 179 193 207 Cluster 3
0
1
2
3
Number of Flips
Binar
y Error
1 9 19 30 41 52 63 74 85 96 109 123 137 151 165 179 193 207 Cluster 3
A, and reformulate student B’s sequence to {2, 0, 0, 0}. As a result, the average decimal error sequence becomes {2, 0.5, 1, 0}.
The average error at each flip for a particular binary challenge in the game is shown in Figure 4.1. In this task, students are asked to generate the binary representation for the base-ten target number 26. After clustering students’ n-grams for this task, 118 students were grouped in the first cluster, 108 students were grouped in the second cluster, and 19 students were grouped in the third cluster. Because the target value for this task is 26, the average error for students is 26 in the beginning and zero at the end for all three clusters, while decay patterns differ across clusters (Figure 4.1). Students in each cluster solved the problem within
0 5 10 15 20 25
Number of Flips
Decimal Error
1 2 3 4 5 6 7 8 9 10 11 12 13 14
Cluster 1 0.0 0.2 0.4 0.6 0.8 1.0
Number of Flips
CDF
1 2 3 4 5 6 7 8 9 10 11 12 13 14
Cluster 1 Base−ten Target= 26
0 5 10 15 20 25
Number of Flips
Decimal Error
1 3 5 7 9 12 15 18 21 24 27 30 33 36 39 42 45 48 51
Cluster 2 0.0 0.2 0.4 0.6 0.8 1.0
Number of Flips
CDF
1 3 5 7 9 12 15 18 21 24 27 30 33 36 39 42 45 48 51
Cluster 2 Base−ten Target= 26
0 5 10 15 20 25
Number of Flips
Decimal Error
1 9 19 30 41 52 63 74 85 96 109 123 137 151 165 179 193 207
Cluster 3 0.0 0.2 0.4 0.6 0.8 1.0
Number of Flips
CDF
1 9 19 30 41 52 63 74 85 96 109 123 137 151 165 179 193 207
Cluster 3 Base−ten Target= 26
Figure 4.2. Students' average decimal error when generating binary representation of number 26 and the CDF of the present population at each flip. (Left) students' average
a varying number of flips. The error for students who finished earlier is represented with zero. The percentage of students still working on the challenge at each flip is shown using a color-coding scheme. In Figure 4.1, green points mark flips where between 70% to 100% of the population is present, blue points indicate the presence of 50% to 70% of the population, yellow points mark 30% to 50% of the population, and red points indicate flips were less than 20% of the population of that cluster are still working on the problem. These
percentages are derived from the cumulative density functions (CDFs) of clusters’ present population at each flip that are plotted in Figure 4.2 (right). The observed patterns of error decay in different clusters were consistent across all 11 tasks. This suggests that students follow certain problem-solving strategies when solving the binary tasks within the game. Binary error. Binary error incorporates the Hamming distance to measure the distance between the current state of student-generated binary strings and the binary representation of the target base-ten value. Hamming distance is the number of different elements in two strings of the same size. The approach for plotting the binary error is similar to the approach for plotting the decimal error. Figure 4.1 shows binary (right) and decimal (left) error plots for each cluster of the same binary challenge (base-ten target number 26). Same CDFs as in (Figure 4.2, right) hold for binary error plots, as the binary error plots are generated from the same population used for generating decimal error plots.
4.1.5 Resulting Strategies
between the target number and their generated number, the binary error places more emphasis on the representational difference between binary sequences. The binary error focuses on students’ understanding of each bit and its associated weight. The analyses reveal a clear distinction in students’ problem-solving strategies in solving the in-game challenges. After clustering, following distinct strategy groups emerge for all analyzed tasks:
• Thoughtful systematic approaches: Students who completed the task with fewer
trial-and-error attempts. This can be an indicator of students’ systematic thinking while solving the problem.
• Thoughtful trial-and-error: Students who had a moderate number of flips and their
average error decayed continuously toward zero with some sudden spikes that suggest and-error attempts. This pattern could be an indicator of learning through trial-and-errors.
• Random trial-and-error: Students who completed the activity with many more flips
4.2 Stealth Assessment
Students’ choice of strategy has shown to be important in their learning process. Hence, modeling their choice of strategy can contribute to the prediction of their learning outcomes (Eagle & Barnes, 2014; Rowe et al., 2014). As a result, we aim to evaluate the predictive power of models of students’ in-game problem-solving strategies over time to predict their post-test performance. We seek to determine if the in-game strategies derived from students’ interactions with the game environment can be used as evidence for stealth assessment.
Our proposed feature set contains inherent rich temporal dependencies among students’ behaviors over the course of interactions with the ENGAGE game-based learning environment. We expect their gradual learning over consecutive tasks to affect their choice of strategy over time. To effectively model temporal dependencies in the feature set an LSTM-based neural network (Hochreiter & Schmidhuber, 1997) is investigated. After training the LSTM-based neural network based on students’ in-game strategy use over time, the trained network is used to classify their post-test performance. In addition, two well-established classification techniques, random forest (RF) (Breiman, 2001) and support vector machines (SVM) (Cortes & Vapnik, 1995), are examined to predict students’ post-test performance. It is important to note that, in contrast to the LSTM approach, both random forest and the support vector machine treat the in-game strategy features as independent features in their predictions. Hence, they are suitable for evaluating the importance of taking the temporal dependency among features into account when predicting post-test performance.
feature set combining both pre-test performance and in-game strategy. As the in-game strategy features are derived from a dataset that is the result of collaboration between two team-members, the pre-test performance is included in both feature sets as an individualized measurement.
4.2.1 Data Preparation
For the classification task, data from 168 students who finished both pre- and post-tests and also completed all 11 binary challenge tasks within the game us used. The initial dataset included students’ pre- and post-test scores along with their flip sequences. The flip
sequences are then transformed into n-gram features for each of the 11 tasks. Students’ post-test performance is then predicted using students’ in-game strategy features derived from their n-gram features using a clustering approach. In order to keep the train and test set completely separate, before clustering the dataset, it is divided into training and held-out test sets. Clustering is then performed using students’ n-gram data in the training set. After identifying distinct clusters for each challenge in the training set, the Gaussian finite mixture models estimated by the MClust package is used to cluster students’ data in the test set. After this process, students’ data in both the training and test sets include sequences of in-game strategies across the 11 binary-representation tasks in addition to their pre-test perform