ABSTRACT
SIMPSON, JOY ANNA. Antioxidant Properties of Peanut Plant Leaves and Roots and
Contribution of Specific Phenolic Compounds to Antioxidant Capacity. (Under the direction of Dr. T. H. Sanders).
The peanut seeds represent less than 40 % of the total biomass of the peanut plant. Currently, peanut plants are left in the field after harvest or baled for animal feed. The research presented here was the second step in identifying bioactive compounds from peanut plants that may be the source for value added products for the peanut industry. The objective of this work was to determine the antioxidant capacity and total phenolic content for peanut leaves and roots, and to identify and quantify specific phenolic compounds contributing to the total antioxidant activity. Peanut leaves and roots were collected from a North Carolina (NC) research farm. Additional roots were collected from a Texas (TX) farm. Plant parts were freeze dried and extracted with methanol and aqueous methanol.
ANTIOXIDANT PROPERTIES OF PEANUT PLANT LEAVES AND ROOTS AND CONTRIBUTION OF SPECIFIC PHENOLIC COMPOUNDS TO ANTIOXIDANT
CAPACITY
By
JOY ANNA SIMPSON
A thesis submitted to the Graduate Faculty of North Carolina State University in partial fulfillment to the requirements
of the Degree of Master of Science
FOOD SCIENCE
Raleigh, North Carolina
2006
APPROVED BY:
______________________________ ______________________________
Dr. V.D. Truong Dr. L. Boyd
BIOGRAPHY
Joy Anna Simpson was born on October 20, 1982 in Chattanooga, Tennessee. Her parents are Don and Diane Simpson. She has a twin sister who lives in London, UK, as well as, a brother who lives in Rock Hill, SC.
ACKNOWLEDGEMENTS
TABLE OF CONTENTS
Page
List of Tables………... vi
List of Figures………. vii
Introduction………. 1
CHAPTER 1: Literature Review………... 3
Peanut Origin and History………. 3
Peanut Plant Morphology……….. 5
Phytochemicals……….. 8
Oxidation……… 15
Antioxidants………... Antioxidant Methodology……….. 20
Instrumental Methodology………. 25
References……….. 28
CHAPTER 2: Contribution of Specific Phenolic Compounds to the Total Antioxidant Activity of Peanut Leaves and Roots………...…………. 36
Introduction……… 37
Materials and Methodology……… 39
Plant Samples……….... 39
Extraction………..… 39
Chlorophyll Content Analysis………..………. 40
Oxygen Radical Absorbance Capacity……….……. 40
DPPH Radical Scavenging Assay………. 42
Total Phenolics Assay………... 42
Thin Layer Chromatography………. 43
HPLC-DAD Analyses………... 43
HPLC-MS Analyses……….. 44
Statistical Analysis……… 47
Results and Discussion Determination of Antioxidant Properties of Peanut Parts Extracted in Methanol... 48
Oxygen Radical Absorbance Capacity……….. 48
DPPH Radical Scavenging Assay………. 49
Chlorophyll Analysis………. 50
Total Phenolics Assay……… 51
Comparison of Methanol versus Aqueous Methanol (80%) on Antioxidant Properties of Peanut Leaves and Roots……… 53
Oxygen Radical Absorbance Capacity………..… 53
DPPH Radical Scavenging Assay………. 54
Identification and Quantification of Phenolic Antioxidants and Their Contribution to Total Antioxidant Activity of Peanut Leaves and
Roots………..…………. 57
Thin Layer Chromatography ……… 57
HPLC………. 59
HPLC-MS……….. 60
Antioxidant Activity of Phenolic Compounds…………..……… 61
Contribution of Identified Phenolic Compounds to Antioxidant Activity……….. 63
Actual Antioxidant Activity versus Calculated Antioxidant Contribution... 63
Conclusion……… 65
LIST OF TABLES
Page Table 1 HPLC Data for NC Leaves, NC Roots, and TX Roots Extracted with
Aqueous Methanol………...……… 77 Table 2 Quantity of Phenolic Compounds as Determined by HPLC-MS for NC
Leaves, NC Roots, and TX Roots Extracted with Aqueous
Methanol………...……...……….. 77 Table 3 Calculated Contribution of Identified Phenolic Compounds to NC Leaves
Antioxidant Activity as a Percentage of Total Activity………. 79 Table 4 Calculated Contribution of Identified Phenolic Compounds to NC Roots
Antioxidant Activity as a Percentage of Total Activity……….. 79 Table 5 Calculated Contribution of Identified Phenolic Compounds to TX Roots
LIST OF FIGURES
Page Figure 1 Trolox Standard Curve for ORAC Assay………. 71 Figure 2 Total ORAC Values (Lipophilic-ORAC Value plus Hydrophilic-
ORAC Value) for NC Leaves, NC Roots, and TX Roots
Extracted with Methanol……… 71 Figure 3 DPPH Values for NC Leaves, NC Roots and TX Roots Extracted in
Methanol and 80% Aqueous Methanol……….…. 72 Figure 4 Total Phenolics for NC Leaves, NC Roots and TX Roots Extracted in
Methanol and 80% Aqueous Methanol………. 72 Figure 5 ORAC Values for NC Leaves, NC Roots and TX Roots Extracted in
Methanol and 80% Aqueous Methanol………. 73 Figure 6 Correlation between ORAC and DPPH Values for Peanut Leaves
and Roots Extracted with Aqueous Methanol……… 73 Figure 7 Correlation between DPPH and Total Phenolic Values for Peanut
Leaves and Roots Extracted with Aqueous Methanol……… 74 Figure 8 Correlation between T-ORAC and Total Phenolic Values for Peanut
Leaves and Roots Extracted with Aqueous Methanol……… 74 Figure 9 Correlation between ORAC and Total Phenolic Values for Peanut Leaves
and Roots Extracted with Aqueous Methanol……… 75 Figure 10 ORAC Values for Fractions Generated from TLC of NC Leaves…….. 75 Figure 11 ORAC Values for Fractions Generated from TLC of NC Roots………. 76 Figure 12 Values for Fractions Generated from TLC of TX Roots……….. 76 Figure 13 ORAC Values for Phenolic Compounds Identified in NC Leaves, NC
Roots, and TX Roots……… 78 Figure 14 DPPH Values for Phenolic Compounds Identified in Peanut Plant
Samples…... 78 Figure 15 ORAC Values for Phenolic Standard Mixture and Calculated Total
Activity Based on HPLC-MS Results for the Sum of Individual
INTRODUCTION
Phytochemicals are chemicals derived from plant sources. Plants contain hundreds of phytochemicals such as flavonoids and phenolic acids. Research indicates phytochemicals such as polyphenols have high antioxidant activity (Fukumoto and Mazza, 2000).
Free radicals are highly reactive and are generated in the body through normal cellular function (USDA, 2005). Free radicals are believed to cause lipid oxidation leading to cellular membrane damage (Nijveldt et al., 2001).
Antioxidant research is a key topic in both the medical and food industry today. Antioxidants protect the body from reactive species. Research investigating bioactive compounds from plant materials have inversely correlated to the intake of bioactive phytochemicals and disease. Other research has confirmed that peanut and peanut plant parts contain antioxidant compounds (Green, 2004).
Peanuts (Arachis hypogaea L.) are an excellent source of proteins, lipids, and minerals (USDA, 2000a). Recent interest in phytochemicals may provide a new use of peanut leaves and roots (Chen et al., 2002). The peanut is a member of the legume family, which is classified based on root nodulation (Vance, 2002). Compounds of interest from the peanut plant include phenolic compounds such as resveratrol and catechins. High levels of resveratrol have been identified in peanut roots (Chen et al., 2002). Resveratrol has been linked with the deceleration of age-related diseases (Soleas et al., 1997).
LITERATURE REVIEW Peanut Origin and Production
Origin and History
Peanuts, Arachis hypogaea L., were first discovered as a food source in the Western Hemisphere, most likely South America (Woodruff, 1983). Spanish explorers have been credited with spreading peanuts throughout the new world; however, commercial production of peanuts did not start in the United States until about 1876 (Woodruff, 1983).
Economic Importance
Peanuts have been cultivated to grow in varying soils and temperature zones throughout the world. The United States produces approximately 10% of the world’s peanut crop (Acquaah, 2005). In 2002, China was the top producer of peanuts (14 million tons), followed by India (7.6 million tons) and the United States (1.9 million tons) (USDA, 2004). The United States produces higher average yield per acre (2,800-3,00lb/acre) than the rest of the world (800-1,000 lb/acre) due to more efficient and sophisticated production technology (Acquaah, 2005). Nine states account for 99% of the US crop production. They are Georgia, Texas, Alabama, North Carolina, Florida, Oklahoma, Virginia, South Carolina, and New Mexico (Hammons, 1994). Peanut Production
(Woodruff, 1983). Today, many smaller countries still produce peanuts using hand labor or animal drawn equipment (Hammons, 1994).
Peanuts are produced in regions with moderate rainfall, abundant sunlight, and average growing temperatures above 65ºF (Acquaah, 2005). Most varieties require 120-160 days without frost and a growing season rainfall of 42-54 inches per annum. Peanuts are best grown in well-drained, calcium rich, sandy loam with pH between 6.5 and 7.2 (Acquaah, 2005).
Cultural Practices and Harvesting
Generally, peanut production entails tillage, planting, and harvesting. The growth of the peanut industry in the United States is related to increased output and efficiency of production (Woodruff, 1983). Mechanization increased the use of deep tillage and smooth preparation of the soil, broadcasting fertilizers, treating and planting seed, applying herbicides, light multi-row cultivation, digging, windrowing, and drying methods (Woodruff, 1983). Improvements in disease and insect control and peanut varieties also increased production and efficiency.
Peanut harvesting refers to the process of removing peanuts from the soil and separation of the peanuts from the foliage. Physiological maturity, soil type, soil moisture content, and weather dictate digging time. Typically, peanuts are dug when most of the pods are mature (Pattee and Young, 1982); however, there are conditions of disease, weather, and equipment that may override maturity based harvest decisions. In the United States, peanuts are cured or dried to reduce the moisture content for safe storage.
Peanut Foliage
roots) for 2002 would be estimated at 221 million pounds. Currently, plants are either baled for animal feed or left in the field. While little research has been completed on the phytochemical composition of peanut leaves and roots; two studies reported high levels of resveratrol in peanut plant roots (Chen et al., 2002, Liu et al., 2003).
The perennial peanut plant (Arachis glabrata Benth) has been reported as having nutrition equal to alfalfa, which is a major source of livestock feed. The perennial plant differs from other varieties of peanuts in that it produces very few peanuts (French et al., 2006). Peanut plants are good pasture forage, excellent dry hay, and exceptional silage. Over the last few decades, prices of baled perennial peanut have steadily increased (French et al., 2006) ranging from $100 to $1,000 per acre depending on yields and variety (Golden, 2001).
Nutrition
Nutritional information in the USDA database (USDA, 2000b) indicates that peanuts are an excellent source of proteins, lipids, and minerals. A recent report stated that a daily serving of peanut products helps humans meet recommended nutrient requirements and that people who consume peanuts regularly tend to have increased levels of essential vitamins and minerals and leaner bodies (Fuhrman, 2005). Kris-Ehterton et al. (1999) and O’Byrne et al. (1997) studied the effects of diets rich in peanuts. These studies showed that peanut rich diets lowered LDL cholesterol, a significant risk factor for heart disease.
anticancer properties. Resveratrol has been identified in raw peanut seeds, roasted peanuts, peanut butter, and boiled peanuts (Sobolev and Cole, 1999, Sanders, et al., 2000, Huang et al., 2003). Resveratrol is a phytoalexin associated with reducing atherosclerosis and carcinogenesis (Soleas et al., 1997).
Resveratrol has also been isolated and identified in peanut plants (Chung et al. 2003, Wang et al., 2005). Their research suggested that resveratrol production within the plant is associated with increased stresses such as UV light and plant disease. Chen et al. (2002) confirmed resveratrol presence in the peanut plant root. They found the addition of peanut plant root powder inhibited oxidation when added to pork fat patties.
Peanut Plant Morphology
Taxonomy and Plant Morphology
Peanuts are classified in the Fabacea family, which are dicotyledonous herbs or shrubs having fruit that are legumes or loments, bearing nodules on the roots containing nitrogen fixing bacteria. Legumes include peanuts, beans, and peas (Hopkins, 2004). The peanut plant is unusual because it flowers above ground and fruit develop below ground. The plant is annual, with a central upright stem bearing branches that are prostrate to nearly erect and have compound leaves. Varieties in cultivation are grouped based on branching habit, branch length, and fruit location. Bunch peanuts have peanuts which are clustered about the base of the plant, while runner peanuts have fruit along the prostrate branches that spread out from the base of the plant.
valencias, which are selected for large size and light colored shells. Spanish peanuts are used mostly for peanut candy, salted nuts, and peanut butter. Runners are used to make peanut butter. (Acquaah, 2005).
Plant Metabolism
Plants utilize energy from the sun through a process called photosynthesis (Wardlaw et al., 2004). Energy from sugar produced by photosynthesis is utilized in many plant functions (Starr et al., 2004) and leaves are vital for plant metabolism because of photosynthesis.
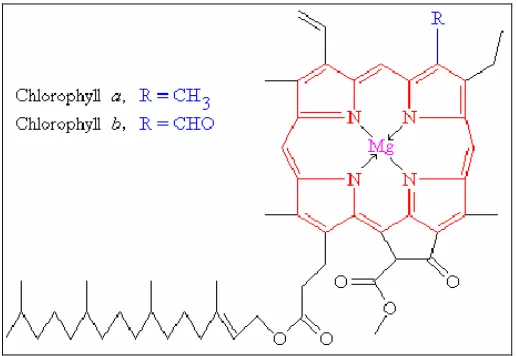
Leaves are rich in photosynthetic pigments that capture sunlight. Pigments can be categorized into three classes: chlorophyll, phycobilin, and carotenoids (Prezelin and Nelson, 1997). Chlorophyll is an essential component of photosynthesis because it absorbs and transfers light. Chlorophyll has a structure of alternating single and double bonds which facilitates absorption of light energy (Figure 1).
Figure 1: Structure of Chlorophyll a and b (May, 2005)
antioxidants (Blankenship, 2002). Carotenoids are photoprotectants because they may reduce singlet oxygen to a less reactive state. Carotenoids are generally considered lipophilic (Wrolstad et al., 2005).
Energy produced by photosynthesis is in the form of adenosine triphosphate (ATP), nicotinamide adenine dinucleotide phosphate (NADPH), and sugars. ATP is an energy source in plants consisting of a nucleotide and ribose sugar with three phosphate groups (Lawlor, 2001). NADPH provides reducing energy for nutrient assimilation within the plant (Starr et al., 2004). Sugars are formed independent of light in the Calvin-Benson cycle (Farabee, 2001).
The fourth most abundant nutrient in plants is nitrogen. Nitrogen is necessary for the formation of proteins, nucleic acids and other plant metabolites. Acquisition and absorption of nitrogen by plants is vital for metabolism (Vance, 2002). Nitrogen is in abundance in the environment in the form of N2 (N≡N). Atmospheric nitrogen cannot be utilized by plants,
because they do not contain the enzyme able to breakdown the triple covalent bond of N2.
Legumes have a symbiotic relationship with Rhizobia bacteria, which form root nodules and produce nitrogenase. Nitrogenase is the enzyme responsible for the reduction of nitrogen gas to ammonia. Legume plants actively utilize ammonia produced by the bacteria. Nitrogen fixation is more energy intensive than the integration of nitrate (NO3-) and ammonium (NH4), which are
other sources of nitrogen found in the environment (Sprent, 1994).
Flavonoids such as luteolin, hesperitin, daidzein, and apigenin isoflavonoids induce nodulation (Figure 2) (Vance, 2002). Isoflavonoids play a vital role in symbiosis and plant disease resistance. Frequent microbial infections induce the accumulation of certain isoflavonoids which act as antibiotics and are also known as phytoalexins. Antibiotic properties limit the growth of invading organisms (Vance, 2002).
3-flavanol
Name R1 R2
Catechin OH H
Epicatechin OH H
Gallocatechin OH OH
Figure 2: Phenolic Compounds: Flavonoids (C6-C3-C6) three rings molecule, two of them
aromatic connected by heterocyclic center ring and major 3-flavanol structures
Phytochemicals
Pigments
Plant pigments are generally classified in the phytochemical category. There are three main categories of plant pigments: chlorophyll, carotenoids, and phycobilins. The plant utilizes pigments for photosynthesis as discussed earlier.
Chlorophyll
Chlorophyll is the most abundant phytochemical pigment in higher plants (Ferruzzi et al., 2002). It is responsible for the green color in the leaves and stem cells of the plant. There are three types of chlorophyll: a, b, and c. Chlorophyll a is found in all plants, algae and cyanobacteria, and is mainly responsible for photosynthesis. Chlorophyll b is found only in green algae and in plants, while chlorophyll c can be found only in aquatic photosynthetic organisms (Wrolstad et al., 2005).
Little is known about the potential or actual function of chlorophyll as an antimutagen or anticarginogen (Negishi et al., 1997). Chlorophyll has been associated with antioxidant and disease preventative functions. Endo et al. (1985) reported that chlorophyll derivatives may act as chain breaking antioxidants, by donating electrons. Epidemiological studies indicate diets high in green raw vegetables may protect against cancer, but research needs to be completed correlating chlorophyll and cancer prevention (Vogel, 2005).
Phenolic Compounds
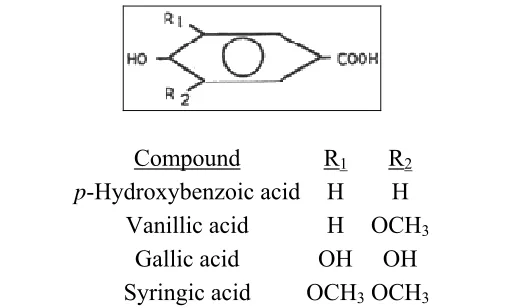
Phenolic compounds are a large, diverse group of secondary plant metabolites that are widespread in the plant kingdom and include phenolic acids, flavonoids, and tannins (Figure 3). Polyphenol compounds may accumulate as end-products from the shikimate pathway and acetate pathways (Carey, 2003). Phenolic acids include hydroxybenzoic acid and hydroxycinnamic
Figure 3: Phenolic Compounds (Novus, 2006)
4) and hydroxycinnamic acids (Figure 5), which are derived from nonphenolic molecules benzoic and cinnamic acid, respectively (Harborne and Williams, 2000).
Research on phenolic compounds has increased significantly in the last decade. Currently, almost 6500 flavonoids are known (Harborne and Williams, 2000). Many foods that are considered as healthy contain relatively high levels of flavonoids (Escarpa and Gonzalez, 2001). An important phenomenon attributing to increase interest in phenolics is known as the “French paradox”. Frankel et al., (1993) credited antioxidant phenolics in red wine with a low coronary heart disease mortality rate in France.
Compound R1 R2
p-Hydroxybenzoic acid H H Vanillic acid H OCH3
Gallic acid OH OH Syringic acid OCH3OCH3
Figure 4: Phenolic Compounds: Benzoic acid derivatives (C6-C1)
Compound R1 R2
Cinnamic acid H H p-Coumaric acid H OH Caffeic acid OH OH Ferulic acid OCH3OH
Figure 5: Phenolic Compounds: Cinnamic acid derivatives (C6-C3)
and scavenging activity of phenolic compounds (Escarpa and Gonzalez, 2001). Antioxidant properties of phenolic acids play a vital role in the stability of food products, as well as in the antioxidative defense mechanisms of biological systems (Macheix and Fleuriert, 1998). Plant polyphenols can act as reducing agents by donating hydrogen and quenching singlet oxygen. Flavanoids, particularly catechin, quercetin, kaempferol, and their glycosides have been found in teas and wine (Nijveldt et al., 2001). Common phenolic include caffeic acid, chlorogenic acid, resveratrol, catechin, epicatechin, and p-hydrobenzoic acid.
Caffeic acid
Figure 6: Structure of caffeic acid
Caffeic acid is a hydroxycinnamic acid commonly found in many fruits, vegetables, seasonings and beverages (Figure 6). Caffeic acid is an antioxidant in vitro and may contribute to the prevention of cardiovascular disease (Olthof et al., 2001). Olthof et al. (2001) found that caffeic acid is absorbed by the body. Caffeic acid has been reported at a high level in fresh raspberries and pears (Escarpa and Gonzalez, 2001). Caffeic acid appears to contribute to the resistance of roots to microbial infections, fungi, and insects (Harrison et al., 2003).
Chlorogenic acid
Chlorogenic acid is an ester of caffeic acid and quinic acid (Figure 7). Chlorogenic acid is a major phenolic compound in coffee and has been isolated from the leaves and fruits of plants (Escarpa and Gonzalez, 2001). Chlorogenic acid is an antioxidant in vitro, which may contribute to reduction of diseases (Olthof et al., 2001). Like caffeic acid, Olthof et al. (2001) found that chlorogenic acid is absorbed by the body.
Resveratrol
Figure 8: Structure of resveratrol
and Cole, 1999; Sanders, et al., 2000). Also, boiled peanuts had a higher concentration of resveratrol, followed by peanut butter, and roasted peanuts (Sobolev and Cole, 1999).
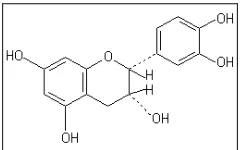
Catechin
Figure 9: Structure of catechin
Catechins are classified as proanthocyanidins (Figure 9). Catechin has been deemed a powerful antioxidant because it is easily oxidized (Nijveldt et al., 2001). Common sources of catechin include white tea, green tea, chocolate and apples (Escarpa and Gonzalez, 2001). Epicatechin
Figure 10: Structure of epicatechin
Epicatechin is a flavanol, which has been classified as an antioxidant (Figure 10). High concentrations of epicatechin have been found in cocoa, particularily dark chocolate (Mayer and Stern, 2003). Epicatechin concentration in cocoa may contribute to the higher antioxidant activity compared to green tea and wine (Lee, et al. 2003).
Figure 11: Structure of p-hydroxybenzoic acid
p-hydroxybenzoic acid (Figure 11) is a phenolic derivative of benzoic acid. It is
primarily known as the basis for the preparation of its esters, which are used as preservatives in cosmetics. One study indicated p-hydroxybenzoic acid acts as an antioxidant against peroxyl radicals (Yeh and Yen, 2003).
Ferulic Acid
Figure 12: Structure of ferulic acid
Ferulic acid is a phenolic acid belonging to the hydroxycinnamic group (Figure 12). Ferulic acid is found in the leaves and seeds of many plants including whole wheat, oats, coffee, apples, peanuts, and pineapples (Escarpa and Gonzalez, 2001). Ferulic acid is an antioxidant which neutralizes free radicals (Graf, 1992). Ferulic acid seems to reduce the risk of many types of cancer (Mori et al., 1999). One study showed that both dietary caffeic acid and ferulic acid may play a key role in defending against carcinogenesis (Kuenzig et al., 1984).
Oxidation Free Radicals
Oxidation
Oxidation is the process in which electrons are removed from atoms or pairs of atoms (Fennema, 1996). The oxidized molecule looses an electron, while the reduced molecule receives an electron. Oxidation is a concern because some reactions become uncoupled and free radicals are formed (Lee et al., 2003).
Reactive oxygen species (ROS) are oxygen-centered free radicals (Pietta, 2000). Experimental evidence has suggested that there are six major reactive oxygen species (ROS) responsible for oxidative damage (Huang et al., 2005). Living cells have a natural defense composed of enzymatic antioxidants that change ROS to harmless species. No enzymatic antioxidant is known to scavenge ROO·, HO·, 1O2, and ONOO-. Defense against these ROS
relies on nonenzymatic antioxidants such as vitamins C and E and many phytochemicals (Huang et al., 2005).
In the body, ROS function in energy production, regulation of cell growth, and synthesis of compounds (Pietta, 2000). ROS reactions are believed to accelerate aging and lead to cancer and heart disease. Cellular damage is believed to be a product of lipid oxidation due to damage to the cellular membranes (Nijveldt et al.., 2001).
listed below, assuming one antioxidant scavenges two radicals and oxygen is in large excess (Fennema, 1996).
Initiation
RH + (light, metal, heat) Æ R· + H· (Equation 1.0)
Production of the alkyl radical is thermodynamically complex, so initiation begins with a catalyst such as hydroperoxide decomposition, light, metal ions or heat (Fennema, 1996). Alkyl radicals are highly reactive and will interact with atmospheric oxygen (O2) to form unstable peroxyl radicals in the propagation step.
Propagation
R· + O2Æ ROO· (Equation 1.1)
ROO· + RH Æ ROOH + R· (Equation 1.1.1)
Peroxyl radicals are highly unstable and may withdraw hydrogen atoms from other fatty acids (RH) to produce hydroperoxides (ROOH) and new alkyl radicals. Propagation continues until termination begins.
Termination
R· + R· Æ RR (Equation 1.2)
R· + ROO· Æ ROOR (Equation 1.2.1)
ROO· + ROO· Æ ROOR + O2 (Equation 1.2.2)
Antioxidants
The Institute of Medicine of the National Academies defines antioxidants as “a substance in foods that significantly decreases the adverse effects of reactive species, such as reactive oxygen and nitrogen species, on normal physiological function in humans” (Panel on Dietary Antioxidants, 2000). Antioxidants can scavenge reactive oxygen species to stop radical chain reactions or inhibit the radical production (Huang et al., 2005).
Inhibition
LOO· + AH (antioxidant) Æ LOOH + A· (Equation 2.0)
Antioxidants can be classified into two types: preventative and chain-breaking. Preventative antioxidants chelate metals and/or decompose peroxides in order to stall the initiation of free radicals before oxidation (Fennema, 1996). Citric acid, ethylenediaminetetraacetic acid (EDTA), and polyphosphates are common preventative antioxidants because they chelate metal ions. Research on antioxidants has been focused on the action of free radical acceptors because food systems are very complex and it is nearly impossible to remove all trace metals and peroxides (Huang et al., 2005).
inhibitor is commonly regarded as an antioxidant and is the most widely studied antioxidant mechanism (Wright et al., 2001).
Hydrogen Atom Transfer
ROO· + ArOH Æ ArO· + ROOH (Equation 2.1)
The aromatic radicals remain stable by aromatic ring stabilization and a hydroperoxide is the product.
Another antioxidant pathway is single electron transfer (ET). As an antioxidant is added to a system, the antioxidant inhibits propagation of the peroxy radical by hydrogen atom transfer, and then will follow a single electron transfer pathway for antioxidant activity (Wright et al., 2001).
Single Electron Transfer
ROO· + ArOH Æ ROO- + ArOH+· (Equation 2.2)
ROO- + AROH+· Æ ArO· + ROOH (Equation 2.2.1)
Single electron transfer involves the antioxidant molecule donating an electron to stabilize the peroxy radical. This process creates a peroxy radical with a negative charge due to an over abundance of electrons on the oxygen. A positively charged aromatic free radical is available to donate a proton (H+) to quench the charged hydroperoxide. The single electron transfer pathway is very dependent upon solvent due to stabilization of charged species (Wright et al., 2001).
(Pietta, 2000). The wide number of phytochemicals implies that plants may contain many unidentified antioxidant compounds.
Prooxidants
Prooxidants can be defined as components that lower the activation energy for the initiation of lipid oxidation (Labuza, 1971). Krinsky (1998) also determined that radical initiators may be classified as pro-oxidants. A compound may display both antioxidant and prooxidant proprieties depending on concentrations and experimental conditions. Aruoma (1990) noted that lipid antioxidants act as prooxidants in nonlipid systems.
Antioxidant Methodology Extractions
Antioxidant Assays
Numerous methods have been developed to measure the antioxidant capacity of compounds and extracts. Antioxidant methods may focus on scavenging of oxygen and hydroxyl radicals, reduction of lipid peroxyl radicals, chelation of metal ions, or inhibition of lipid peroxidation. Antioxidant methods generally focus on one mechanism of the action. A number of methods verify the capacity of an antioxidant to scavenge free radicals generated by the system, for instance the Oxygen Radical Absorbance Capacity (ORAC) (Cao and Prior, 1999), Total Reducing Ability of Plasma (TRAP) (Ghiselli, et al., 1995), and Trolox Equivalent Antioxidant Capacity (TEAC) (Miller et al., 1993). Methods such as DPPH• (2,2-diphenyl-1-picrylhydrazyl) (Brand-Williams et al., 1995) and ABTS• (2,2’-azinobis(3-ethylbenzothiazoline-6-sulfonic acid)) (Re et al., 1999) measure the capacity of antioxidants to scavenge free radicals. Other methods have been established to evaluate antioxidants by quantifying lipid peroxidation products, for instance malonaldehyde by Thiobarbituric Acid Reactive Substances (TBARS) (Plumb et al., 1996) and volatile organic acid decomposition products in the Oxidative Stability Index (OSI) (Firestone, 1992).
Oxygen Radical Absorbance Capacity
The ORAC method was adapted from the work by Cao and colleagues (1993) utilizing
the fluorescent capacity of β-phycoerythrin and the inhibition of deterioration by antioxidant
compounds after addition of 2,2′-azobis(2-amidino-propane) (AAPH). Ou et al. (2001) reported
that β-phycoerythrin reacted with polyphenols, which are commonly known for their antioxidant
lipophilic extracts resulted in erroneous data. In order to test lipophilic extracts, 7% (w/v) randomly methylated β-cyclodextrin (RMCD) in acetone:water (1:1) was incorporated.
Compounds or extracts were suspended into the RMCD solution, which increased the solubility of the antioxidants into the ORAC buffer solution (Huang et al., 2002). Initial development of the ORAC assay was performed on the COBAS FARA II analyzer (Roche Diagnostic Systems, Inc, Branchburg, NJ), which Davalos et al. (2004) adapted for a 96-well fluorescent plate reader.
The ORAC assay involves the deterioration of fluorescein, a synthetic non-protein probe, by free radicals. AAPH is an azo compound (R-N≡N-R), which undergoes spontaneous
decomposition. Dinitrogen (N2) and two molecules of AAPH• radical (Equation 3.0) are
generated at a constant rate upon AAPH disintegration.
R-N≡N-R Æ 2R• + N2 (Equation 3.0)
Unstable fatty acid radicals (R•) quickly react with atmospheric oxygen (O2) to form peroxy
radicals (ROO•). The loss of fluorescent intensity of fluorescein indicates oxidation by peroxy radicals. Addition of antioxidants inhibits propagation of the peroxyl radical (ROO•) and thus, reducing the loss of florescent intensity over time. The phenoxy radical (ArO•) may react with the fluorescein to inhibit deterioration, but reacts more with peroxyl radicals (ROO•) that deteriorate fluorescein (Ou et al., 2002).
2,2-Diphenyl-1-picrahydrazyl (DPPH)
DPPH solution changes from a deep purple to a light yellow and absorbance at 515 nm decreases (Brand-Williams et al., 1995). Figure 13, shown below, is an illustration of the structure of the DPPH and reduction by an antioxidant.
Figure 13: Structure of DPPH and reduction by an antioxidant (Prakash, 2001)
Brand-Williams et al. (1995) found that certain antioxidant compounds elicited different reaction kinetics with DPPH•. In the study, antioxidants such as BHT and protocatechuic acid did not reach steady state, or the reaction endpoint, until three and two hours respectively, whereas with compounds like ascorbic acid, isoascorbic acid, and isoeugenol steady state was achieved within one minute. At steady state, the DPPH• reaction has been shown to have a stoichiometric correlation with the quantity of antioxidant present. Caffeic acid, gentistic acid and gallic acid exhibited the highest antiradical activity with stoichiometry of 4.54, 5.6, and 6.25 reduced DPPH• molecules per molecule of antioxidant, respectively, while one molecule of phenol, ascorbic acid, α-tocopherol, and BHT reduced <1, 1.85, 2, and 2.63 molecules of
DPPH•, respectively (Brand-Williams et al., 1995).
intramolecular transfer of H•, consequently reacting further with DPPH radicals. Both pathways depend on molecular structure of the antioxidants in regards to stability and reaction potential. Total Phenolics
The total phenolic method was first adapted to assay food products by Singleton and Rossi (1965). The assay consists of a colorimetric method based on the chemical reduction of the reagent, Folin-Ciocalteau (Wrolstad et al., 2005). Total phenolics methodology consists of the addition of Folin-Ciocalteau reagent to a sample held in the dark for two hours, followed by measurement of the absorption. Folin-Ciocalteau reagent contains metal oxide which is reduced by phenols, with a light absorption maximum at 765 nm. Intensity of the light absorption is directly proportional to the concentration of phenols (Wrostlad et al., 2005). A standard curve is generated by plotting the concentration of a standard phenolic compound, in this case gallic acid, versus absorption (Figure 14). Results are then calculated as Gallic Acid Equivalents (GAE) of a sample using the standard curve. Gallic acid is used as the reference compound because it is only present in small amounts in the plant material, and it is a stable, pure, inexpensive substance (Wrostlad et al., 2005). Gallic acid standard solutions have been determined to lose less than 5% of their value over two weeks when refrigerated (Waterhouse, 2006).
Instrumental Methods Chromatography
Chromatography is a process in which a chemical mixture is separated into components based on differences between solutes (Sherma and Fried, 2003). Chromatography is widely used to separate individual components of a mixture of related substances. Compound separation is based upon different components of the mixture traveling at different speeds due to affinity for the medium, solubility in the solvent, and molecular weight (Rouessac and Rouessac, 2000). One theory of chromatographic separation is retention separation, where retention is a measure of the distance at which a substance moves in a chromatographic system (Sherma and Fried, 2003). For systems such as thin layer chromatography, retention is measured as the retention factor, Rf, as defined in Equation 4.0).
Rf = Distance moved by compound (Equation 4.0)
Distance moved by solvent
In systems where the compounds are eluted with an eluant, the retention is determined as retention time Rt or tR, the time between injection and detection. Retention of a compound may differ between experiments and laboratories due to variations of the eluant, stationary phase, temperature, and setup. Standard compounds must be tested under identical conditions in order for valid comparisons to be made (Wagner and Bladt, 2001). Separation techniques include liquid-solid chromatography, liquid-liquid chromatography, liquid chromatography, gas-solid chromatography, and supercritical fluid chromatography.
Thin Layer Chromatography
composed of a solvent or solvent mixture. TLC is usually conducted in a closed chamber (Wagner and Bladt, 2001). The solvent, or mobile phase, travels up the stationary phase by capillary action, moving the components of the sample at various rates due to differing degrees of interaction with the solvent (Fried, 1996). Non-polar compounds will travel to the top of the plate because the compounds will dissolve into non-polar solvents and will not interact with the polar stationary phase. Components may be tentatively identified by comparing the distances traveled with those of known reference materials in the same system (Fried, 1996).
Visualization of compounds on the TLC plates is common in order to determine the location of specific compounds on the plate as spots of color, due to their natural color or a reaction with reagents (Fried, 1996). Chen and Chen (1992) used TLC to separate carotenoids and chlorophylls in flowering plants that live in water (convolvulus). Bailey and Chen (1988) developed a method to prepare neoxanthin and violaxanthin standards from saponified spinach extracts.
High Performance Liquid Chromatography
absorption measurements at characteristic wavelengths (Robards and Antolovich, 1997). Flavonoids characteristically have two absorption bands; where Band I has a maximum absorption in the range of 300 to 550 nm and Band II has a maximum absorption in the range of 240 to 285 nm (Wrolstad et al., 2005).
Liquid Chromatography-Mass Spectrometry
Numerous analytical methods are available to analyze the composition of phenolic compounds by liquid chromatography mass spectrophotometry (LC-MS). Liquid chromatography-mass spectrometry (LC-MS) is a technique that combines the physical separation capabilities of liquid chromatography with the mass analysis capabilities of mass spectrometry. LC-MS is used to identify and verify the structures of components that have already been separated by HPLC. LC-MS is widely used for numerous purposes due to high sensitivity and specificity (Kasimu et al., 1998). The LC-MS is used for detection and identification of chemicals in complex mixtures.
REFERENCES
1. Acquaah, G. (2005). Principles of Crop Production: Theory, Techniques, and Technology. New Jersey: Pearson Education Inc.
2. Ahmed, E., Young, C. (1982). Composition, quality, and flavor of peanuts. In Pattee, H., Young, C. (eds.) Peanut Science and Technology. Yoakum, Texas: American Peanut Research and Education Society.
3. Aruoma, O., Evan, P., Kaur, H., Sutcliffe, L., Halliwell, B. (1990). An evaluation of the antioxidant activity and potential pro-oxidant properties of food additives Trolox C, vitamin E, and probucol. Free Radical Res. Comm. 10, 143-157.
4. Awad, A., Chan, K., Downie, A., Fink, C. (2000). Peanuts as a source of β- sitosterol, as sterol with anticancer properties. Nutrition and Cancer, 36(2), 238-241.
5. Awika, J., Rooney, L., Wu, X., Prior, R., Cisneros-Zevallos, L. (2003). Screening methods to measure antioxidant activity of Sorghum (Sorghum bicolor) and Sorghum products. J. Agric. Food Chem., 51, 6657-6662.
6. Bailey, C., Chen, B. (1988). Simultaneous separation and identification of cartotenoids and chlorophylls in turf Bermuda grass by high performance liquid chromatography. J. Chromatogr., 445, 396-400.
7. Benbrook, B. (2005). Elevating Antioxidant Level in Foods through Organic Farming and Food Processing. Organic Center State of Science Review. January.
8. Blankenship, R. (2002). Molecular Mechanisms of Photosynthesis. Oxford UK: Blackwell Science Ltd.
9. Brand-Williams, W., Cuvelier, M., Berset, C. (1995). Use of a free radical method to evaluate antioxidant activity. Lebensm. Wiss. Technol. 28, 25-30.
10.Buratti, S., Pellegrini, N., Brenna, O., Mannino, S. (2001). Rapid electrochemical method for the evaluation of the antioxidant power of some lipophilic food extracts. J. Agric. Food Chem., 49, 5136-5141.
11.Carey, F. (2003). Organic Chemistry 5th Edition. New York: McGraw-Hill Co.
12.Cao, G., Allessio, H., Cutler, R. (1993). The measurement of oxygen radical absorbance capacity assay for antioxidants. Free Radical Biol. Med. 14 (3), 303-311.
14.Chen, B., Chen, Y. (1992). Determination of carotenoids and chlorophylls in water convolvulus (Ipomoea aquatica) by liquid chromatography. Food Chemistry. 45, 129-134.
15.Chen, R., Wu, P., Chiou, R. (2002). Peanut roots as a source of resveratrol. J. Agric. Food Chem. 50, 1665-1667.
16.Chung, I., Park, M., Chun, J., Yun, S. (2003). Resveratrol accumulation and resveratrol synthase gene expression in response to abiotic stresses and hormones in peanut plants. Plant Science, 164, 103-109.
17.Dakora, F., Phillips, D. (2002). Root exudates as mediators of mineral acquisition in low nutrient environments. Plants and Soil, 245, 35-47.
18.Davalos, A., Gomez-Cordoves, C., & Bartolome, B. (2004). Extending the applicability of the oxygen radical absorbance capacity (ORAC-Flourescein) assay. J. Agric. Food Chem., 52, 48-54.
19.Endo, Y., Usuki, R., Kandena, T. (1985). Antioxidant effects of chlorophyll and pheophytin on the autooxidation of oils. Journal of the American Oil Chemists Society, 62, 1375-1390.
20.Escarpa, A., Gonzalez, M. (2001). An overview of analytical chemistry of phenolic compounds in foods. Critical Reviews in Analytical Chemistry, 31(2), 57-139. 21.Farabee, M. (2001). Cellular Metabolism. Retrieved June 1, 2006:
http://www.emc.maricopa.edu/faculty/farabee/BIOBK/BioBookGlyc.html.
22.Fennema, O. ed. (1996). Food Chemistry. New York: Marcel Dekker. 23.Ferruzzi, M., Bohm, V., Courtney, P., Schwartz, S. (2002). Antioxidant and
antimutagenic activity of dietary chlorophyll derivatives determined by radical
scavenging and bacterial reverse mutagenesis assay. J. Food Science Food Chemistry and Toxicology, 67, 2589-2595.
24.Firestone, D. (ed.). (1992). Official Methods and Recommended Practices of the American Oil Chemists’ Society. Champaign, IL: AOCS. Method Cd 12b-92.
25.Frankel, E., Kanner, J., German, J., Parks, E., Kinsella, J. (1993). Inhibition of oxidation of human low-density lipoprotein by phenolic substances in red wine. Lancet,
341(8843), 454-457.
27.Fried, F. (1996). Practical Thin-Layer Chromatography: A Multidisciplinary Approach. Boca Raton: CRC Press, Inc.
28.Fuhrman, E. (2005). Good for you – naturally: nuts not only taste good in products, but they are also good for you. Candy Industry, 170(1), 52-55.
29.Fukumoto, L., Mazza, G. (2000). Assessing antioxidant and prooxidant activities of phenolic compounds. J. Agric. Food Chem., 48, 3597-3604.
30.Ghiselli, A., Serafini, M., Maiani, G., Azzini, E., & Ferro-Luzzi, A. (1995). A fluorescence-based method for measuring total plasma antioxidant capability. Free Rad. Biol. Med. 18, 29-36.
31.Golden, P. (2001). Perennial Profit. Farm Progress, Sept., 12-14.
32.Graf, E. (1992). Antioxidant potential of ferulic acid. Free Rad. Biol. Med., 13(4), 435-448.
33.Green, R. (2004). Antioxidant Activity in Peanut Plant Tissues. Master’s Thesis submitted to NCSU Department of Food Science.
34.Hammons, R. (1994). The Origin and History of the Groundnut. In J. Smart (Ed.). The Groundnut Crop – A Scientific Basis for Improvement. London, UK: Chapman & Hall.
35.Harborne, J., Williams, C. (2000). Advances in flavonoid research since 1992. Phytochemistry, 55(6), 481-504.
36.Harrison, H., Peterson, J., Snook, M., Bohac, J., Jackson, D. (2003). Quantitation and potential biological activity of caffeic Acid in sweet potato [ipomoea Batatas (L.) LAM.] storage roots. J.Agric. Food Chem.. 51(10):2943-2948.
37.Hopkins, W., Huner, N. (2004). Introduction to Plant Physiology 3rd Ed. Hoboken, NJ: John Wiley & Sons, Inc.
38.Houghton, P., Raman, A. (1998). Laboratory Handbook for the Fractionation of Natural Extracts 1st ed. New York, NY: Chapman & Hall.
39.Huang, D., Ou, B., Hampsch-Woodill, M., Flanagan, J., Deemer, E. (2002) Development and validation of oxygen radical absorbance capacity assay for lipophillic antioxidants using randomly methylated cyclodextrin as the solubility enhancer. J. Agric. Food Chem. 50, 1815-1821.
41.Huang, S., Yen, G., Chang, L., Yen, W., Duh, P. (2003). Identification of an
Antioxidant, Ethyl Protocatechuate in Peanut Seed Testa. J. Agric. Food Chem. 51, 2380-2383.
42.Kasimu, R., Tanaka, K., Tezuka, Y., Gong, Z., Li, J., Basnet, P., Namba, T., Kadota, S. (1998). Comparative study of seventeen Salvia plants: aldose reductase inhibitory activity of water and MeOH extracts and liquid chromatography-mass spectrometry (LC-MS) analysis of water extracts. Chem. Pharm. Bull., 46(3), 500-504.
43.King, R., Bomser, J., Min, D. (2006). Bioactivity of Resveratrol. Comprehensive Reviews in Food Science and Food Safety. In Press.
44.Krinsky, N. (1998). The antioxidant and biological properties of the carotenoids. Ann. NY Acad. Sci., 854, 443 -7.
45.Kris-Etherton, P., Pearson T., & Wan, Y. (1999). High-monounsaturated fatty acies diets lower both plasma cholesterol and triacylglycerol concentrations. Amer. J. of Clin. Nutr. 70, 1009-1015.
46.Kuenzig, W., Chan, J., Norkus, E., Holowaschenko, H., Newmark, H., Mergens, W., Conney, A. (1984). Caffeic and ferulic acid as blockers of nitrosamine formation. Carcinogenesis, 3(5), 309-313.
47.Labuza, T.P. (1971). Kinetics and Lipid Oxidation in Foods. CRC. Critical Reviews in Food Technology.
48.Lawlor, D. (2001). Photosynthesis. Hertfordshire, UK: IACR-Rothamsted.
49.Lee, K., Kim, Y., Lee, H., Lee, C. (2003). Cocoa Has More phenolic phytochemicals and a higher antioxidant capacity than teas and red wine. J. Agric. Food Chem., 51 (25), 7292 -7295.
50.Liu, C., Chiou, Y., Wang, J., Chiou, K., Robin, Y. (2003). Comparative characterization of peanuts grown by aquatic floating cultivation and field cultivation for seed and resveratrol production. J. Agric. Food Chem. 51: 1582-1585.
51.Lough, W., Wainer, I. (1996). High Performance Liquid Chromatography: Fundamental Principles and Practice. Glasgow: Chapman & Hall.
52.Macheix, J., Fleuriet, A. (1998). Flavonoids in health and disease. Marcel Dekker Inc, New York.
53.Machlin, L., Bendich, A. (1987). Free radical tissue damage: protective role of antioxidant nutrients. FASEB J. 1, 441-445.
54.May, P. (2005). Chlorophyll. Retrieved June 1, 2006.
55.Mayer, J., Stern, F. (2003). USDA Database for the Flavonoid Content of Selected Foods. USDA-ARS Beltsville Human Nutrition Research Center, Beltsville, Maryland.
56.McLafferty, F., Turecek, F. (1993). Interpretation of Mass Spectra. University Science Books. 4th edition.
57.Miller, N., Rice-Evans, C., Davies, M., Gopinathan, V., Milner, A. (1993). A novel method for measuring antioxidant capacity and its application to monitoring the antioxidant status in premature neonates. Clin. Sci. 84, 407-412.
58.Mori, H., Kawabata, K., Yoshimi, N., Tanaka, T., Murakami, T., Okada, T., Murai, H. (1999). Chemopreventive effects of ferulic acid on oral and rice germ on large bowel carcinogenesis. Anticancer Res. 19(5A), 3775-8.
59.Nijveldt, R., Nood, E., Hoorn, D., Boelens, P., Norren, K., Leeuwen, P. (2001). Flavonoids: a review of probable mechanisms of action and potential applications. Amer. J. Clin. Nutr., 74, 418-425.
60.Negishi, T., Haruki, R., Hayatsu, H. (1997). Antigenotoxic activity of natural chlorophylls. Fund. Mol. Mech. Mutag., 376: 97-100.
61.Novus Research (2006). Phenolic Compounds in Plants. Gilbert, Arizona. Retrieved October 14, 2006: http://www.organicashitaba.com/pc.html.
62.O’Byrne, D., Knauft, D., Shireman, R. (1997). Low-fat monounsaturated diets
containing high-oleic peanuts improve serum lipoprotein profiles. Lipids, 32, 687-695. 63.Olthof M., Hollman P., Katan M. (2001). Chlorogenic acid and caffeic acid are
absorbed in humans. J Nutr., 131(1), 66-71.
64. Ou, B., Hampsch-Woodill, M., Prior, R. (2001). Development and validation of an improved oxygen radical absorbance capacity assay using flourescein as the fluorescent probe. J. Agric. Food Chem., 49, 4610-4626.
65.Ou, B., Huang, D., Wampsch-Woodill, M., Flanagan, J., Deemer, E. (2002). Analysis of antioxidant activities of common vegetables employing Oxygen Radical Absorbance Capacity (ORAC) and Ferric Reducing Antioxidant Power (FRAP) assays: A
comparative study. J. Agric. Food Chem., 50, 3122-3128.
66.Panel on dietary antioxidants and related compounds, Standing Committee on the
67.Pattee, H., Young, C. (1982). Peanut Science and Technology. American Peanut Research and Education Society, Inc.: Yoakum, Texas.
68.Pietta, P. (2000). Flavonoids as antioxidants. J. Nat. Prod., 62, 1035-1042.
69.Plumb, G., Lambert, N., Chambers, S., Wanigatunga, S., Heaney, R., Plumb, J.A., Aruoma, O., Halliwell, B., Williamson, G. (1996). Are extracts of purified
glucosinolates from cruciferous vegetables antioxidants? Free Rad. Res., 25, 75-86. 70.Prakash, A. (2001). Antioxidant Activity. Medallion Laboratories Analytical Progress,
19, 2.
71.Prezelin, B., Nelson, N. (1997). The formation of ATP and reducing power in the light. In Dennis, D., Turpin, D., Lefebvre, D., and Lyzell, D., eds., Plant Metabolism 2nd ed. Essex, England: Addison Wesley Longman, 274-285.
72.Re, R., Pellegrini, N., Proteggente, A., Pannala, A., Yang, M., Rice-Evans, C. (1999). Antioxidant activity applying and improved ABTS radical cation decolorization assay. Free Rad. Biol. Med., 26, 1231-1237.
73.Robards, K., Antolovich, M. (1997). Analytical chemistry of fruit bioflavonoids. Anal., 122, 11R-34R.
74.Rouessac, F., Rouessac, A. (2000). Chemical Analysis: Modern Instrumentation Methods and Techniques. West Sussex, England: Wiley.
75.Sanders, T., McMichael, R., Hendrix, K. (2000). Occurrence of Resveratrol in edible peanuts. J. Agric. Food Chem., 48 (4), 1243 -1246, 2000.
76.Schmidt, K. (2000). Lipids: Functional Properties. In Christen, G., and Smith, J. (Eds.), Food Chemistry: Principles and Applications. West Sacramento, CA: Science
Technology System.
77.Sherma, J., Fried, B. (2003). Handbook of Thin Layer Chromatography. Boca Raton, Fl:CRC, Inc.
78.Sobolev, V., Cole, R. (1999). trans-Resveratrol content in commercial peanuts and peanut products. J.Agr. Food Chem., 47, 1435-1439.
79.Soleas, G., Diamondis, E., Goldberg, D. (1997). Resveratrol: A molecule whose time has come? And gone? Clin.Biochem., 30, 91-113.
81.Stampfer, M., Hennekens, C., Manson, J., Colditz, G., Rosner, B. and Willett, W. (1993). Vitamin E consumption and the risk of coronary disease in women. NE J. of Med. 328, 1444-1449.
82.Starr, C., Taggart, R. (2004). Biology: The Unity and Diversity of Life, 3rd Ed. Belmont, CA: Thomson.
83.US Department of Agriculture (USDA), Agricultural Research Service & Iowa State University. (2000a). USDA-Iowa State University Database on the Nutrient Content of Foods, Release 1.3—2002. Retrieved April 18, 2005 from the Nutrient Data
Laboratory Home Page on the World Wide Web:
http://www.nal.usda.gov/fnic/foodcomp.
84.USDA Center for Nutrition Policy and Promotion. (2000b). Nutrition Insights: The Role of Nuts in a Healthy Diet. Washington, DC. Retrieved April 24, 2005.
www.usda.gov/cnpp
85.USDA, FAS, Production Estimates and Crop Assessment Division (2004). Peanut area, yield, and production. April, 2005. Table 13.
86.USDA, Natural Resource Conservation Service, Plants Database (2005). Retrieved August 21, 2005 from Plants Database on the World Wide Web:
http://plants.usda.gov/cgi_bin/topics.cgi?earl=plant_profile.cgi&symbol=ARHY
87.Vance, C. (2002). Root-Bacteria interactions: Symbiotic N2 fixation. In Waisel, Y.,
Eshel, A., & Kafkafi, U. (Editors), Plant Roots, The Hidden Half 3rd ed. Rev. and Exp. New York, NY: Marcel Dekker, Inc., 839-868.
88.Vogel, J., Jonker-Termont, D., Lieshout, E., Katan, M.B., Meer, R. (2005). Green vegetables, red meat and colon cancer: chlorophyll prevents the cytotoxic and hyperproliferative effects of haem in rat colon. Carcinogen., 26(2), 387-393.
89.Wagner, H., Bladt, Sabine (2001). Plant Drug Analysis: A Thin Layer Chromatography Atlas. Berlin: Spring-Verlag.
90.Wardlaw, G. Hampl, J., DiSilvestro, R. (2004). Perspectives in Nutrition. Boston: McGraw Hill.
91.Wang, K., Lai, Y., Chang, J., Ko, T., Shyu, S., Chiou, R. (2005). Germination of peanut kernels to enhance Resveratrol biosynthesis and prepare sprouts as a functional
vegetable. J. Agric. Food Chem., 53, 242-246.
93.Wright, J., Johnson, E., Carpenter, D. (2001). Predicting the activity of phenolic antioxidants: theoretical method, analysis of constituent effects, and application to major families of antioxidants. JACS, 123, 1173-1183.
94.Woodruff, J. (1983). Peanuts: Production, Processing, and Products 3rd Ed. Westport, CT: AVI Publishing Co.
95.Womach, R. (2003). Comparing Quota Buyout Payments for Peanuts and Tobacco. CRS Report for Congress. Retrieved October 14, 2006:
http://216.239.51.104/search?q=cache:_XtsJbqk5TgJ:www.nationalaglawcenter.org/as sets/crs/RS21642.pdf+estimated+peanut+production+in+united+states+per+year&hl=e n&gl=us&ct=clnk&cd=1
96.Wrolstad, R., Acree, T., Decker; E., Penner; Reid, D., Schwartz, S., Shoemaker, C., Smith, D., Sporns, P (2005). Handbook of Food Analytical Chemistry. John Wiley & Sons: Hoboken, NY.
CHAPTER 2
INTRODUCTION
Peanuts (Arachis hypogaea L.) are an economically important crop for the United States, especially for the southeast. The United States produces approximately 10% of the world’s peanut crop (Acquaah, 2005). Nine states in the United States account for 99% of the US crop production. Those states are: Georgia, Texas, Alabama, North Carolina, Florida, Oklahoma, Virginia, South Carolina, and New Mexico (Acquaah, 2005). Peanuts are an excellent source of nutritional compounds.
The peanut plant accounts for approximately 40% of the peanut biomass. Peanut leaves and roots can be considered a byproduct of peanut production and have low economic value (French et al., 2006). Currently, plants are either baled for high protein animal feed or left in the field.
Little research has been completed on the phytochemical composition of peanut leaves and roots. Two studies reported high levels of resveratrol in peanut plant roots (Chen et al. 2002, Liu et al. 2003). Chen et al. (2002) reported different levels of resveratrol in peanut plant roots from different growing seasons. Phytochemical research has increased over the past ten years; because, phytochemicals are natural bioactive compounds found in plant foods which are believed to protect against disease. Numerous studies have associated phytochemicals, especially phenolic compounds, with a decrease in cardiovascular disease, cancer, and other degenerative diseases (Wrolstad et al., 2005). At least 8,000 phytochemical compounds have demonstrated antioxidant properties (Pietta, 2000). Total phenolics of food products were first assayed by Singleton and Rossi (1965).
generated by the system, and DPPH (2,2-diphenyl-1-picrylhydrazyl) (Brand-Williams et al., 1995) which measure the capability of the antioxidant compound to scavenge stable free radicals.
Green (2004) determined the antioxidant ability for peanut leaves, roots, and stems. Sampling date, drying method, extraction methodology, and extraction technique were variables analyzed for all three peanut plant parts. The highest antioxidant activity level was found in the leaves, followed by the roots, and low activity was determined for the stems. Methanol extracts exhibited the highest antioxidant activity. Green’s (2004) work was an initial study to determine whether peanut plants contain bioactive compounds that provide the basis for value added products.
MATERIALS AND METHODS Plant Samples
Peanut plants (Arachis hypogaea L.) were collected from the Upper Coastal Plain Research Station in Rocky Mount, NC on October 2, 2005. Peanut roots (var FlavoRunner 458) were collected from a farm in Seminole, Texas on October 19, 2005 in order to compare root antioxidant activity and phenolic composition from two different locations. Peanut plant parts were separated and rinsed with water to remove all visible soil before storage at –45°C in
separate sealed plastic containers.
Peanut plant parts were removed from cold storage and placed into a Virtis Freeze Dryer
(Model No. FFD-40-WS, Gardiner, NY). The refrigeration condenser was set at -15.5°C. The
shelf temperature was set at 15.5°C for the first 24 hours, 38°C for the second 24 hour period,
and 57°C for the final 24 hour period of drying. Samples were ground in a Krups 3 oz. household
coffee mill (Krups North America, Closter, NJ) to a coarse powder. The peanut plant powder
was then stored in screw capped glass jars at –20°C until extraction.
Extraction
hexane was used as the extraction solvent. Extracts were stored in amber vials which were sealed with Teflon lined screw-caps and held at –20 °C until further analysis.
Chlorophyll Content Measurement
Chlorophyll content was determined according to methods in the Handbook for Food Analytical Chemistry (Wrolstad et al, 2005). Half a gram of plant powder was ground using a mortar and pestle with 3 ml of methanol, the mortar was rinsed with 1.5 ml methanol, and the final volume was adjusted to 5 ml with methanol. Chlorophyll extracts were then transferred to a Damon/IEC International Centrifuge and centrifuged at 1075 rpms for 5 minutes. Two hundred
µL of the supernant was transferred to a 96 microwell plate and absorbance was read using a
SAFIRE plate reader with the Magellan V 4.00 software (TECAN, Raleigh, NC). Absorbance was determined at 665 nm and 652 nm. Absorbance values were used to calculate the concentration of chlorophyll a (Ca) and b (Cb) from equations based on the Lambert-Beer law
and absorbance coefficients taken from the literature (Wrolstad, 2005):
Ca (µg/ml) = 16.72 A665 – 9.16 A652 (Equation 1.0)
Cb (µg/ml) = 34.09 A652 – 15.28 A665 (Equation 1.1)
Oxygen Radical Absorbance Capacity Assay
Haen, Milwaukee, WI) solution stock was stored at 4°C for no longer than one week as 15 mL
aliquots which were diluted to the final concentration of 70 nM daily. 2,2′-azobis
(2-methylpropionamidine) dihydrochloride (AAPH) (Sigma, St. Louis, MO) was prepared daily. For the lipophilic extracts, a solution of 7% randomly methylated cyclohexane (RMCD) (Sigma, St. Louis, MO) was used as a blank, dilution solvent, and Trolox solvent (Huang et al., 2002a).
The total volume of liquid in the microwell was 200µL. Sample extracts and standards,
both at 20µL, were added to the well followed by 120µL of fluorescein. The plate containing
only the samples and fluorescein was incubated in the SAFIRE for 15 minutes at 37°C ± 2°C,
before 60µL of the AAPH solution was added. Prior to beginning measurements, a high-intensity three second linear shaking was performed by the SAFIRE followed by one second of settling time. Data points were acquired over eighty minutes as relative fluorescent units (RFU) ranging from 0-60000 RFU using the Magellan V 4.00 software (TECAN, Raleigh, NC) and exported into Microsoft Excel for further analysis. Measurement parameters were set to fluorescent excitation at 485 nm and fluorescent emission at 520 nm for the SAFIRE.
The antioxidant activity, or ORAC, is expressed in Trolox Equivalents by using a
standard curve calculated from Trolox standards 3.125, 6.25, 12, 25, 50 µM well concentrations.
The Trolox standard curve describes the change in the area under the curve (AUC) with concentration. The AUC of the sample is calculated as:
AUC = (0.5 + ƒ5 / ƒ4 + ƒ6 / ƒ4 + ƒ7 / ƒ4… + ƒi / ƒ4) ] x CT (Equation 5.0)
Where ƒ4 is the initial fluorescence reading at cycle 4, and is the fluorescence reading at cycle i,
and CT is the cycle time in minutes. The AUC is then expressed as µM Trolox Equivalents/gram of sample by way of the standard curve linear regression:
The net area under the curve was obtained by subtracting the blank value from that of the sample or standard. The net area under the curve value is then input into the y = mx + b equation format. The m and b signify the slope and intercept respectively from the standard curve results.
Each sample was analyzed in triplicate. Antioxidant activity was reported in µM Trolox
Equivalents per gram of dry powder. DPPH Radical Scavenging Assay
The method of Brand-Williams et al. (1995) was adapted for testing the radical scavenging of the extracts using the stable free radical 2,2-diphenyl-1-picrahydrazyl (DPPH•)
(Sigma, St. Louis, MO). All spectrophotometric data were acquired using absorbance measurements made by the Safire monochromator based microplate reader equipped with a Magellan V4-W reader software (Tecan USA, Raleigh NC). The samples were loaded on Costar polystyrene flat-bottom translucent 96-well plate (Corning, Acton, Massachusetts).
Extracts and standards were diluted with ethanol. A 0.1 ml aliquot of the diluted sample was added to 3.9 ml of DPPH solution (6x10⁻⁵ M). Absorbance was measured at 515 nm each minute for 180 minutes. Once the absorbance reached a plateau, the reaction was complete. The reaction time of 60 minutes was used for the DPPH analysis. The blank was 95% ethanol. Trolox concentrations of 0, 0.1, 0.2, 0.3, 0.4 and 0.5 mM were used as the standards. Each
sample was analyzed in triplicate. Antioxidant activity was reported in µM Trolox Equivalents
per gram of dry powder. Total Phenolic Assay
diluted with distilled water to a volume of 5.0 ml. Half a milliliter of Folin-Ciocalteau reagent (Fisher Scientific, Fairlawn, NJ) was added to extracts or standards and allowed to react at room temperature for 3 minutes. One milliliter of 1 N sodium carbonate was added and the mixture was incubated in the dark, at room temperature for an hour. Absorbance was measured at 725 nm with the Safire monochromator based microplate reader equipped with a Magellan V4-W reader software (Tecan USA, Raleigh, NC).
Thin Layer Chromatography
Peanut plant powder extracted with aqueous methanol was fractionated by thin layer chromatography in duplicate for pigment separation and to determine the location of antioxidant compounds based on solvent differences. The mobile phase used was 70:25:10:5 (v/v/v/v) hexane/acetone/chloroform/methanol (Chen and Chen, 1992). Five hundred microliters of extract was spotted in a line on the chromatography plate. The mobile phase was added to the TLC chamber thirty minutes prior to addition of the plate, in order to for the chamber to reach equilibrium. Visualization of phenolic compounds was done utilizing a method developed by Pratt and Miller (1984). Equal volumes of ferric chloride (1%) and potassium chloride (1%) (Sigma, St. Louis, MO) were mixed, resulting in an orange-brown solution. TLC plates were sprayed with the solution. Phenolic compounds were visualized as a blue color, which developed upon reduction of the visualization mixture.
HPLC-DAD Analyses
Synergi Polar Reverse Phase 4µ 4.6 x 250 column (Phenomenex, Torrance, CA). The analysis was monitored at 255 and 326 nm and the absorption spectra of the analyzed compounds were recorded between 200 and 600 nm. Solvent A was 0.1% Formic acid and 100% methanol was employed as solvent B. A gradient was used starting at 95% A and 5% B, then decreased to 75% A in 50 minutes, and then increased to 95% A in 5minutes and re-equilibrated for 10 minutes. The operating conditions were set to an injection volume of 20 µl, flow rate of 1 ml per minute and a column temperature of 35ºC. The UV spectra of the different compounds were recorded with the diode array detector. Identification of phenolic compounds was tentatively based on retention time and UV spectra maxima absorption curves as compared to phenolic standard compounds which were prepared at 1 mM concentration for HPLC analysis.
HPLC-MS Analyses
Three replicates of powder for each of the plant parts extracted with aqueous methanol were analyzed using HPLC-MS. Resveratrol, catechins, and other phenolics were analyzed with differing HPLC conditions. For phenolics, samples were filtered through 0.02 µm Anotop 10 membrane filters (Whatman Corp., Clifton, NJ), before injection onto a Thermo Finnegan Surveyor HPLC system (San Jose, CA) interfaced with a LQC Duo mass spectrometer. The HPLC was equipped with a quaternary gradient pump, photo diode array detector, autosampler, and Xcalibur chromatography software (Version 3.1, Thermo Electron Corp.). Separation was achieved using a Phenomenex Synergi Polar Reverse Phase 4µ, 80 Å, 250 mm x 2.0 mm column (Phenomenex, Torrance, CA). Analysis was monitored at 280 and 325 nm and the absorption spectra of the analyzed compounds were recorded between 200 and 600 nm. Solvent A was 0.1% Formic acid in acetonitrile and 0.1% Formic acid in H2O was employed as solvent B. A
minutes, held five minutes then decreased to 5% A in 1 minute and re-equilibrated at 5% A for 5 minutes. The operating conditions were set to an injection volume of 10 µl, flow rate of 200 µl per minute and a column temperature of 30ºC. Electrospray Ionization (ESI) MS was completed in the negative mode, with the exception of ferulic acid analysis which was analyzed in the positive mode. Spray voltage was set to 4.5 kV, capillary voltage was 14V, and the capillary temperature was 200ºC. The lens positions and offsets were optimized for each compound analyzed. Nitrogen was used as the sheath gas at a flow rate of 60 arbitrary units, helium was used as the auxiliary gas at 10 arbitrary units.
Extracts for resveratrol analysis were prepared as described by Sanders et al. (2000). Aqueous methanol extracts were injected onto a Thermo Finnegan Surveyor HPLC system (San Jose, CA) equipped with a quaternary pump, diode array detector (DAD), and autosampler. Separation was achieved using a Phenomenex Synergi Hydro-RP 4µ, 80 Å, 150 mm x 2.0 mm column (Phenomenex, Torrance, CA). Analysis was monitored at 280 and 305 nm and the absorption spectra of the analyzed compounds were recorded between 200 and 600 nm. One hundred percent methanol was used as solvent A and 5% methanol in H2O was employed as
solvent B. Isocratic HPLC was employed with 40% solvent A and 60% solvent B. Operating conditions were set to an injection volume of 10 µl, flow rate of 150 µl per minute and column oven temperature of 30ºC. Electrospray Ionization (ESI) MS was completed in negative mode with a spray voltage of 4.5 kV, capillary voltage was 29V, capillary temperature was 200ºC, and tube lens offset 30V. Nitrogen was used as the sheath gas at a flow rate of 60 arbitrary units, helium was used as the auxiliary gas at 10 arbitrary units.
Surveyor HPLC system (San Jose, CA) equipped with a quaternary pump, diode array detector (DAD), autosampler, and Xcalibur chromatography software (Version 3.1, Thermo Electron Corp.). Separation was achieved using an Acentis RP-Amide, 5µ, 150 mm x 4.6 mm column (Supelco, Bellafonte, PA). Analysis was monitored at 254 and 280 nm and the absorption spectra of the analyzed compounds were recorded between 200 and 600 nm. Solvent B was 0.1% Formic acid in acetonitrile and 0.1% Formic acid in H2O was employed as mobile phase A.
A gradient was used starting at 15% A and 85% B, then increased to 45% A in 10 minutes, and then decreased to 15% A in 2 minutes and re-equilibrated for 8 minutes. Operating conditions were set to an injection volume of 10 µl, flow rate of 1000 µl per minute and a temperature of 30ºC. Electrospray Ionization (ESI) MS was completed in negative mode. Spray voltage was set to 4.5 kV, capillary voltage was 10V, and capillary temperature was 150ºC. Nitrogen was used as the sheath gas at a flow rate of 60 arbitrary units, helium was used as the auxiliary gas at 20 arbitrary units.
Preparation of Identified Compounds for Antioxidant Assays
Caffeic acid, chlorogenic acid, catechin, epicatechin, epigallocatechin gallate, ferulic acid, gallic acid, gallocatechin gallate, resveratrol, and p-hydroxybenzoic acids (Sigma, St. Louis, MO) standards were prepared to make comparisons with sample extracts. Butylated hydroxytoluene (BHT) (Sigma, St. Louis, MO) was used as a known standard comparison for the ORAC and DPPH methods. BHT was prepared at 1 mM concentration and diluted appropriately for each assay.
Statistical Analysis