Visualization Pipeline for Medical Datasets on Grid Computing Environment
Aboamama Atahar Ahmed
*1, Muhammad Shafie Abd Latiff
*
1,
Kamalrulnizam Abu Bakar
*
1, Zainul Ahmad Rajion
*
21
Department of Computer Systems and Communications
Faculty of Computer Science and Information Technology
Universiti Teknologi Malaysia, 81310 UTM Skudai Malaysia
[email protected]
,
[email protected]
,
[email protected]
2
School of Medical Sciences, Health Campus
Universiti Sains Malaysia
16150 Kubang Kerian, Kelantan, Malaysia
[email protected]
Abstract
Distance visualization of large datasets often takes the direction of remote viewing and zooming techniques of stored static images. However, the continuous increase in the size of datasets and visualization operation causes insufficient performance with traditional desktop computers. Additionally, the visualization techniques such as Isosurface depend on the available resources of the running machine and the size of datasets. Moreover, the continuous demand for powerful computing powers and continuous increase in the size of datasets results an urgent need for a grid computing infrastructure. However, some issues arise in current grid such as resources availability at the client machines which are not sufficient enough to process large datasets. On top of that, different output devices and different network bandwidth between the visualization pipeline components often result output suitable for one machine and not suitable for another. In this paper we investigate how the grid services could be used to support remote visualization of large datasets and to break the constraint of physical co-location of the resources by applying the grid computing technologies. We show our grid enabled architecture to visualize large medical datasets (circa 5 million polygons) for remote interactive visualization on modest resources clients.Keyword: Visualization, Grid computing, Medical datasets, visualization techniques, thin clients, Globus toolkit, VTK.
1.
Introduction
Scientific Visualization is becoming increasingly important in analyzing and interpreting numerical and complex datasets. However, the datasets generated by medical detectors or simulations is growing in size and complexity.
This makes analyzing and interpreting the datasets more cumbersome using traditional desktop computers, where the conventional computer will be overwhelmed with intensive processing of large datasets even with the latest development of visualization techniques. This is due to limited memory and computational powers available in the machines. Additionally, designing visualization system to run on a single machine always results in specialist high cost supercomputers. These high-end resources are expensive and often based in secure location with limited access privileges. Several methods and techniques were introduced in the past few years to tackle the problem of providing computational power required for visualization operations. The introduced techniques suffer most often in building a cluster of nodes to provide the necessary computational power [1], [2], [3], [4]. Other techniques suggest the utilization of remote visualization requester machine to do the rendering which is normally lack of required computational resources. Unlike clusters, grid methods are designed to deal with unreliable resources where the cluster is a group of similar resources attached together to build extra computational power. Grid computing [5] is a term used to describe the process of sharing geographically distributed resources. This distributed computing infrastructure allows the sharing of processing power, memory, storage and high performance graphics in heterogeneous environment. This paper investigates the integration of grid services with scientific visualization and we support our findings with practical implementation of grid enabled remote visualization prototype for large medical datasets. We give an overview of our grid visualization architecture and describe our implementation and the results obtained. Our initial results show the performance of rendering large datasets located remotely.
Fifth International Conference on Computational Science and Applications
0-7695-2945-3/07 $25.00 © 2007 IEEE DOI 10.1109/ICCSA.2007.92
565
Fifth International Conference on Computational Science and Applications
0-7695-2945-3/07 $25.00 © 2007 IEEE DOI 10.1109/ICCSA.2007.92
567
2.
Previous Work
The scientific data visualization was sparked by landmark NSF report ‘Visualization in Scientific Computing’ by McCormick [6]. The introduced visualization concept was based on breaking down the dataflow of the visualization process to smaller distributed processes. The smaller processes can be placed on distributed locations which are interconnected by network to form a modular visualization. Each part can contribute as an independent modular to form the overall visualization process. However, the existing grid enabled visualization systems are in the direction of translating the existing dataflow concept presented by Haber and McNabb [7] as described in Figure [1].
Figure [1] Haber-McNabb Visualization Pipeline
The existing visualization systems such as AVS Express [8], VTK [9], IBM Data Explorer, OpenGL VizServer [10] and IRIS Explorer [11] are generally available today and used to visualize avariety of large volume of data including medical data. For example, a system such as VTK is making use of wide range of visualization algorithms and VTK supports parallelism through the use of threads. However, these visualization systems are generally designed to work in single high capabilities hardware machine. Despite the fact that VTK was designed in an object oriented fashion, during the design of this system there were no considerations to be supported in the grid environment. Other projects are in a direction to extend the capabilities of these visualization systems. For instance, gViz project was designed to extend IRIS Explorer. However, the possible integration in grid environment should be based on the design of internal components of these systems. Therefore, the challenge now is in providing a flexible and effective mechanism to support remote access to the resources. Current implementations of grid enabled visualization are often tied to expensive hardware and powerful graphic support. In addition to that, the different network bandwidth and different output devices between the rendering location and presentation location produces output suitable for one device and not suitable for another. On the other hand, the existing grid visualization applications often make assumptions on the available resources ‘render local and render remote methodologies’. The following are some of Grid enabled visualization applications and projects.
RAVE [12] is a grid enabled visualization system that reacts and responds to available heterogeneous resources. RAVE implements techniques to make use of both remote and local resource according to the participating machines from high capabilities machines to Small PDA’s.
The gViz project [13] is another grid enabled visualization application. The idea was to incorporate the grid in the internal components of the IRIS Explorer [11].
The E-Demand [14] is another grid enabled visualization project focusing on the use of Grid services to support stereoscopic visualization in a distributed environment. The E-demand application considered as PSE “problem solving environment” on the grid. OGSA [5] presents each model as an entity. Multi rendering services can be deployed to form a collaborative environment.
The SuperVise [15] is another grid implementation. In SuperVise Project, the phases of visualization pipeline such as filtering and geometry transformation are distributed across the grid. The user selects the data then the SuperVise selects the appropriate resources and form the visualization pipeline.
The Distributed Visualization System [16] is visualization application that uses frameless buffer for rendering to distribute the pixel images between several machines. Each machine receives subset of the pixels to render it and submit the rendered part to create the full image, but each machine must have the original copy of the full image.
Some other visualization applications do not relay totally on software in their implementations for instance Visapult [1] is a visualization framework with the ability to render a huge amount of datasets (of the order of 1-5 Tb). Visapult uses parallel rendering hardware to carry out the high speed rendering processes. Using Cactus [17] the data are distributed amongst many parallel nodes for volume rendering, the rendered subset 2D image sent to the client for local rendering.
Engel_vis [18] is another application that combines Local and Remote Visualization Techniques for Interactive volume rendering in medical applications. The application was implemented using java, java 2D and java 3D based on the client which communicate with a server implemented in C++ and OpenInventor. The methodology followed is to load the datasets from the client side. Clients send the datasets to slicing tool. The slicing tool inspects slices in axial, coronal directions, and transfers the volume data to the server application. The server, a stand-alone application that utilizes 3D texture mapping hardware renders images off-screen and sends back compressed images to the clients. The methodology presented will not work well for clients with limited capabilities for local rendering and geometry transformation. However, most of the mentioned grid enabled visualization applications are well structured and designed to solve specific problem. Some of the applications provide the participating machines with no ability to do the rendering processes such as COVISE. Others assume that the participating machines support the rendering resources such as OpenGL VizServer 3.1. In addition, the other newly implemented techniques are trying to solve the rendering and resources support such as RAVE visualization application. RAVE is trying to develop a mechanism to figure out which machines support the Filter
Data Map Render
566 568
rendering tasks and which machines have limited support for the rendering.
3.
A Framework for Volumetric Visualization on
the Grid Environment
3.1
Visualization Toolkit
VTK [9] is an open source library for 3D computer graphics and image processing and visualization. It is object oriented implementation of over 700 C++ classes and more than 350000 lines of code. The library created by Ken Martin, Will Schroeder and Bill Lorensen. This library organized in a form of kits. The kits are used to build application in sequential modules with related functionality. VTK supports a variety of dataset formats and visualization algorithms. The object oriented design of VTK allows the C++ library to be accessed with wrappers built in TCL, java or Python. We are using two algorithms provided by VTK Marching Cubes [19] for extracting the Isosurface from the datasets to produce the polygons and Decimation algorithm [20] to simplify the mesh and reduce the number of polygons produced by Marching Cubes stage.
3.2
Grid Services
The motivation for implementing the grid services in the architecture is to allow the automatic discovery of the resources. For that purpose, we utilize the Globus toolkit [21] components such as MDS (Monitoring and Discovery Services) and Globus GRAM (Grid Resources allocation Manager). The architecture should have globus installed on each node except for the display clients. However, the display clients should have COG Kit installed to allow the RSL script to map the GRAM jobs to other grid nodes. In addition to globus installation, we separately implemented the installation of VTK modules on each node. That is by breaking out the visualization operations into small subtasks to be run as network connected modules. This way we achieved the distribution of workload between the grid nodes and avoid the visualization operations to overwhelm one single machine. For the display client, we must have VTK java packages as a jar file to give a flexible implementation of the interaction features and to allow real-time interaction with the scene. With this backend architecture components VTK and Globus, we only need to promote our services as grid services with WSDL and to discover these services as the visualization requirements. From the display client, the user will need to perform the grid mapping task as a mouse click to map the jobs to which resources. Unlike other grid applications where the implementation of grid resources discovery use manual selection of resources, the resources discovery in our architecture is done in automatic way and the users are not required to have detailed knowledge of the grid nodes and the users will not worry about manual mapping and
selection for resources. In our configurations, MDS is used to query the resources available and register them in the resources directory. However, we wrote java program to map the sufficient resources according to the size of our datasets. WSDL contain the address location and the services provided by the node. These web services are distributed as visualization modules, where some nodes are equipped with Isosurface extraction or data reader in addition to other information about the node such as current CPU load and available memory and status of the storage. With this information, we implement our automatic resources selection mechanism. The result of the selection process is to assign which task to be sent to which node in the grid without having user’s interaction and worry about this underlying configurations.
3.3 Grid Visualization Pipeline Architecture
Our grid visualization pipeline architecture is divided into several stages as follow Reader, Iso-surface extractor, Maper, renderer and Display.
Figure 2Automatic formation of Visualization Pipeline on the grid
567 569
3.3.1 Data Reader
Data reader was designed to read different type of datasets, such as ASCII binary files or Raw datasets format. The reader was selected according to specified datasets and the data reader is able to read data from more than one location and append the data to one or more Iso-surface extractor. The datasets size is calculated at this stage.
3.3.2 Isosurface extractor
For extracting 3D grid from the datasets, we used The Marching Cubes algorithm [19]. We have chosen this particular algorithm for geometry generation for several reasons. Firstly, modeling the dynamic changes of the visualization operations on the grid is a great challenge. However, for our particular Isosurface algorithm case, different Isovalue with the same datasets produces different number of generated polygons. Additionally, different quantities of polygons produced by the same Isovalue even with the same datasets with different time step. The quantity of generated polygons causes different performance of the entire extraction process and over all the performance of the pipeline. Secondly, this scenario is providing dynamic changes in the environment where the load is not fixed throughout the distributed visualization pipeline. The visualization requirements (datasets location and Isovalue) passed from the user is located at remote location to the starting server of the pipeline. Then, the pipeline is formed according to selected dataset size and generated polygons. Figure3, the initial Isosurface drawing requests contain datasets address location and Isovalue. These parameters are passed to the starting pipeline server. The source of the datasets can be from static file or life feed from external programs. After reading and calculating the datasets size the server serialize the datasets to the assigned
to one or two Isosurface extractor according to datasets size and the capacity of the extracting machine. The Isosurface extractor then deserializes the data and appends the datasets with vtkappendFilter implemented as grid service used to append datasets from several data extracting instances. After extracting the polygons from the datasets the extractor then serialize the resulted datasets to mapping service. The decimation process takes a place after the extraction for datasets size reduction by reducing the number of polygons.
3.3.4 Data Mapper
Mapping service is responsible for taking datasets produced by Isosurface extractor and deserializes the data and maps it to one or more rendering service. Mapping and Isosurface extraction may be implemented as a single service. The resulted datasets serialized to the rendering service. The importance of mapping is to allow the discovery of grid available resources by querying the Globus MDS. The result of the query is used to assign the proper rendering nodes. The mapping service is also responsible for partitioning the resulted geometric datasets.
3.3.5 Renderer
Rendering is a process of transforming the geometric data into images. The rendering process is known to consume the available resources memory and storage. This particular problem is common for standard desktop computers where the rendering of large geometric datasets will consume CPU and available memory. For these reasons, our technique uses rendering services in the form of grid services. Each rendering services is registered in UDDI server and advertises itself to other services. The Globus MDS is used to discover the rendering resources in the grid. Then the render receives the assigned chunk of the datasets.
Figure 3 Redraw process requests of an isosurface
568 570
4. Grid Visualization Pipeline Features
This section describes the gird visualization features and the advantages of spreading the visualization pipeline on the grid.
4-1 Heterogeneous support
The implementation of our pipeline as grid services allows different hardware and different operating systems to communicate and exchange the data without worrying about underlying configuration. As an example, for our testbed, we have Linux RedHat 9 and fedora implemented as data reader and Isosurface extractor respectively which are able to communicate with Windows XP.
4.2 Efficient Resources Utilization
The technique of distributing the visualization operations offers chance to other users to utilize the resources where the workload is divided to several machines, unlike other grid enabled visualization systems such as stated in [13] in their implementation the visualization operations take over the memory of the entire used machine and the user will have to wait for the operations to complete. Resources utilization is an important concept in the grid concept. In our architecture, we implemented resources utilization in two main points. The first point is to divide the visualization task as connected pipeline that helped us in distributing the load and avoid our machines to be overwhelmed with several operations in one node. The second point is in our implementation of automatic discovery of resources. Where we first discover the proper resources and we make best use of them.
4.3 Automatic Resource Discovery
For resources discovery, we utilize Globus MDS. Our resources discovery mechanism starts from the display client node as the user executes the grid mapping task provided in GUI. The MDS then query the resources available in the grid and registers the resources in the system. The resulted of the query is information of current load of each node and the memory, storage and CPU. For that purpose we wrote java client program for selection mechanism that is done by comparing our calculated datasets size and the power of the available nodes. On the other hand, our system is publically available to other users. The resources are advertised as grid services and registered in UDDI server. This allows automatic discovery of resources and give the system flexibility to add or remove services to the pipeline as required.
5.
Testbed Implementation
The resources we used for testbed implementation include 2 HP workstations equipped with NVidia GeForce 4MX Go graphics, 512 MB of RAM and 2.87 GHz CPU, running on Linux RedHat 9 and Linux Fedora core 3 respectively. At the client user, we used HP Notebook equipped with Intel(R)Pentium(R)4 CPU 2.80GH, Graphic Adapter ATI Mobility IGP 340M/345M , 512 MB of RAM and ST94011A 40 GB disk drives running on windows XP Professional. All the machines were linked with LAN cable 100MB Ethernet LAN. During the implementation there was extra demand for memory during the rendering process.
6.
Experimental Results
For our initial results, we used test models (CT scan of facial bone) in raw format that were obtained from Hospital Universiti Sains Malaysia and second model was the UNC head dataset converted to ASCII VTK Binary format was taken from public datasets archive Table 1 shows the models used in our experiment.
Figure 4 A – Isosurface with Isovalue of 1200 Figure 4 B- Isosurface with Isovalue of 600
569 571
Table 1: Models used in benchmarks
Model Name Number of Polygons Size of Data File
Skeleton head 4.28 million 15.1MB
3D full head 11.17 million 23.1MB
The raw skeleton consists of 121 slices of 256*256 * 256 producing file size 15.1MB as reported in the table. The datasets were processed by marching cubes and a polygon decimation algorithm. The two models are shown in the screenshots from the visualization client in Figure 5.
The used algorithms in our architecture are vtkmarchingcubes to extract the Isosurface and vtkDecimatePro to reduce the number of produced polygons from the first step. (Figure 4 A) shows Isosurface of 15.1 MB datasets at client with Isovalue 1200. (Figure 4 B) shows the Isovalue 600. And it is enough for skin surface for this particular datasets. Figure 5 shows graph Isosurface characteristics and usage of different Isovalue along the resulted number of polygons. To analyze and exchange our datasets via the pipeline, we used VTK at each node of the pipeline installed along with GT4. In our architecture, the implemented VTK java classes imports GT4 packages for easy programs integration. WSDL are used to advertise our services, such as render services. Our implementation is not restricted to particular platform. Our visualization pipeline components are distributed and advertized as grid services then published by UDDI server. Users only need to query the MDS for available services. However, for our initial implementation for resources discovery we utilize MDS included with GT4 installation. From the users perspective this underlying configuration is hidden. The only task for client user is to pressed on map grid function to query the resources available and map
the proper resources as showing in Figure 7.
7.
Pipeline Performance
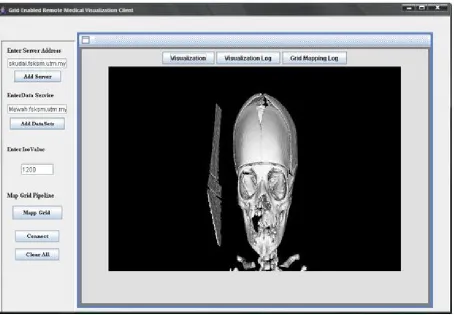
Figure 6 shows the distributed pipeline performance which we used the tools supplied in Linux RedHat 9 to capture the CPU and memory usage for each machine. However, there some other technologies we are putting into consideration such as NWS Network Weather Services [22] and NetLogger [23] for measurements in distributed systems. For now, we are utilizing the performance model as analytical approach based on [24] Performance Modeling technique where the overall pipeline performance is calculated by calculating individual machines. The reason for choosing this method is that, in order to have accurate performance modeling for sequential pipeline as in our case the performance of an Isosurface algorithm, we notice that different numbers of polygons and points with different Isovalue even with the same datasets. Therefore, the number of produced polygons results in radically different performance characteristics for the entire pipeline execution. Figure 7 shows an interface of Isosurface of 15.1 MB datasets located at our (Skudai.fsksm.utm.my) starting pipeline node for reading then datasets passed to Isosurface extraction node (Mewah.fsksm.utm.my) and then passed to rendering service then to client display (HP_Mobile.fsksm.ut.my) notebook.
8.
Resources Mapping and Discovery
The grid mapping is used to map the resources. Our current implementation of mapping is done by using RSL script as GRAM implementation of GT4.as showing in the Figure 7 Figure 5 Isosurface characteristics for different Isovalue
570 572
A- Skudai server extracting the datasets B - Mewah Isosurface Extractor C- HP_Mobile client renderingthe datasets
Figure 6 Pipeline performance
Figure 7 Java Swing Client Display of Isosurface of remote located Medical datasets with Isovalue 1200
571 573
the user only need to specify the starting node of the pipeline and the location of the datasets that he or she needs to visualize and the Isovalue required for visualization. The rest of the operation will be done automatically without having the user worry about extra configuration.
9.
Conclusion and Future Works
We presented our implementation of grid enabled remote visualization architecture. We gave a brief description of our technical implementation and showed the possible integration of grid services and valuable support for scientific visualization particularly on medical datasets. We decomposed the visualization pipeline in distributed machines and developed our visualization services as grid services registered and published to public UDDI server. We show the usefulness of distributing the workload between several machines and how to utilize the Globus GRAM services to automatically launch the pipeline. Our next aim is to distribute the rendering process. Specifically, we are interested in applying parallel algorithms for this implementation. We were able to interactively visualize large number of polygons circa 9 million polygons at the client with java installed on modest resources machine.
10. References
[1] Bethel .W, Tierney. Brian, Lee . J, Gunter .D, Lau S (2000): Visapult Using High-Speed WANs and Network Data Caches to Enable Remote and Distributed Visualization, 2000 IEEE.
[2] Xiaoyu Zhang, Chandrajit Bajaj, William Blanke : 2001 Scalable Isosurface Visualization of Massive Datasets on COTS Clusters : Proceedings of the IEEE 2001 symposium on parallel and large-data visualization and graphics
[3] Engel K Sommer .O, Ernst C, Ertl T. (2000): Remote 3D Visualization using Image- Streaming Techniques. 2000
[4] Brett Beeson1,2, Mark Dwyer1, David 2005 : Server-side Visualization of Massive Datasets Thompson3 Proceedings of the First International Conference on e-Science and Grid Computing (e-e-Science’05)
[5] Foster, C. Kesselman, Nick .K. M., Tuecke .S (2002): The Physiology of the Grid: An Open Grid Services Architecture for Distributed Systems Integration. Technical report, Globus, February 2002.
[6] McCormick B. H., DeFanti T. A., Brown M. D. (1987), “Visualization in Scientific Computing”, Computer Graphics 21 1-14.
[7] Haber, R.B. and McNabb, D.A. 1990. Visualization Idioms: A Conceptual Model for Scientific Visualization Systems. In: Visualization in Scientific Computing,
Shriver, B., Neilson, G.M., and Rosenblum, L.J., Eds., IEEE Computer Society Press, 74-93.
[8] Upson, C., Faulhaber, T., Kamins, D., Schlegel, D., Laidlaw, D., Vroom, J., Gurwitz, R. and van Dam, A. 1989. The Application Visualization System: a Computational Environment for Scientific Visualization, IEEE Computer Graphics and Applications 9, 4, 30- 42.
[9] Will Schroeder, Ken Martin, and Bill Lorensen, The Visualization Toolkit: An Object-Oriented Approach To 3D Graphics. Second Edition. Prentice Hall. Upper Saddle River, NJ. 1998.
[10] SGI. SGI OpenGL VizServer 3.1. Data sheet, SGI, March 2003.
[11] Walton, J.P.R.B. (2004). NAG’s IRIS Explorer. In: Visualization Handbook, Johnson, C.R. and Hansen, C.D., Eds., Academic Press (in press). Available at http://www.nag.co.uk/doc/TechRep/Pdf/tr2_03.pdf [12] Walker D. W. , Grimstead .I (2004): Resource aware visualization environment.
http://www.wesc.ac.uk/projects/rave/.2004
[13] Wood. J, Brodlie, K., J. Walton. (2003) gViz – visualization and steering for the grid. In Proceedings of the UK All Hands Meeting 2003, http://www.nesc.ac.uk/events/ahm2003/AHMCD/pdf/0 30.pdf. , http://www.visualization.leeds.ac.uk/gViz. [14] Charters, S., Holliman, N.S. and Munro, M. 2003.
Visualization in e-Demand: Grid Service Architecture for Stereoscopic Visualization, Proceedings of UK e-Science Second All Hands Meeting.
[15] Osborne .J, Wright .H, (2003) SuperVise: Using Grid Tools to Support Visualization. In Proceedings of the Fifth International Conference on Parallel Processing and Applied Mathematics (PPAM 2003),
[16] Mahovsky .J, Benedicenti. L (2003): Architecture for Java-Based Real-Time Distributed Visualization. IEEE Transactions on Visualization and Computer Graphics, 9(4):570 – 579, October December 2003.
[17]Allen .G, Benger. W, Goodale. T, Hege H.-C, Lanfermann . G , Merzky . A, Radke. T , Seidel .E, Shalf .J (2000): The Cactus Code: A Problem Solving Environment for the Grid. In Proceedings of the Ninth International Symposium on High Performance Distributed Computing (HPDC’00), pages 253–262. IEEE, August 2000
[18] Engel K. et al.. (2000): Combining Local and Remote Visualization Techniques for Interactive Volume Rendering in Medical Applications. 2000
[19] Lorensen, William and Harvey E. Cline. Marching Cubes: A High Resolution 3D Surface Construction Algorithm. Computer Graphics (SIGGRAPH 87 Proceedings) 21(4) July 1987, p. 163-170) http://www.cs.duke.edu/education/courses/fall01/cps12 4/resources/p163-lorensen.pdf
[20] William J. Schroeder , Jonathan A. Zarge , William E. Lorensen, Decimation of triangle meshes, ACM
572 574
SIGGRAPH Computer Graphics, v.26 n.2, p.65-70, July 1992
[21] Thomas Sandholm and Jarek Gawor. Globus Toolkit 3 Core - A Grid Service Container Framework. Globus Toolkit 3 Core White Paper, July 2003.
[22] Rich Wolski 2003 : Experiences with Predicting Resource Performance On-line in Computational Grid Settings ( ACM SIGMETRICS Performance Evaluation Review, Volume 30, Number 4, pp 41--49, March, 2003.
[23] Daniel K. Gunter, Keith R. Jackson, David E. Konerding, Jason R. Lee and Brian L. Tierney, 2005 : Essential Grid Workflow Monitoring Elements , The 2005 International Conference on Grid Computing and Applications (GCA'05) , LBNL-57428
[24] Ian Bowman 2004 Performance Modeling for 3D Visualization in a Heterogeneous Computing Environment : available online
http://vis.lbl.gov/Publications/2004/Bowman-PGV-LBNL-56977.pdf
573 575
![Figure [1] Haber-McNabb Visualization Pipeline](https://thumb-us.123doks.com/thumbv2/123dok_us/1280859.1160618/2.612.59.291.244.282/figure-haber-mcnabb-visualization-pipeline.webp)