UNIVERSITI TEKNOLOGI MALAYSIA SEQUENCE OF IMAGE ENHANCEMENT OF FLAT
ELECTROENCEPHALOGRAPHY USING INTUITIONISTIC FUZZY SET
SUZELAWATI BINTI ZENIAN
.
ELECTROENCEPHALOGRAPHY USING INTUITIONISTIC FUZZY SET
FEBRUARY 2018 Faculty of Science Universiti Teknologi Malaysia A thesis submitted in fulfilment of the requirements for the award of the degree of
ACKNOWLEDGEMENT
First and foremost, praise be to Allah for giving me good health, strength and
patience throughout these years to complete this thesis and for that I would like to
express my greatest gratitude. Throughout this journey, many individuals have come along and assisted me into completing this thesis with success. My warmest and sincerest appreciation and gratitude to my supervisor, Prof. Dr. Tahir Ahmad and
co-supervisor, Dr. Amidora Idris for the continuous guidance, support, encouragement,
and always been a great source of inspiration throughout the research. They have led me into their world and coach me from the beginning until now.
I would like to gratefully thank Prof. Dr. Reza Saatchi and Assoc. Prof.
Dr. Normah Maan for their guidance through valuable comments in producing a
good thesis. My appreciation is also extended to Mr (Dr) Mohd. Sofan Zenian, Neurosurgeon, Neurosurgery Department, Queen Elizabeth Hospital, Kota Kinabalu,
for his valuable advice and suggestions. Thank you so much to my beloved family for their endless support. There are simply no words to describe my appreciation for all the help and guidance you have given me from the very beginning of my career until
now. Without your guidance, I would not have been where I am today.
My heartfelt thank you to the Ministry of Higher Education Malaysia and Universiti Malaysia Sabah for granting the scholarship and permission to pursue my studies under SLAI. Also to all the members of the Fuzzy Research Group (FRG),
Department of Mathematics, and Ibnu Sina Institute for Scientific and Industrial
Research, Universiti Teknologi Malaysia whom I have the honour to work with during my time in UTM. Special thanks to my colleagues and friends. To everyone mentioned above, you have inspired me to be a better person through your excellence and
ABSTRACT
This study focused on contrast enhancement of Flat Electroencephalography
(fEEG) image during epileptic seizure. The main interest is in visualizing the path of brainstorm in the brain that occur during seizure. Selected techniques that are
involved ranging from classical, ordinary fuzzy, and advanced fuzzy namely the intuitionistic fuzzy sets (IFS). Different techniques may result in different output of
fEEG image. The methods in classical approach are Power Law Transformation, Histogram Equalization, and Image Size Dependent Normalization. The intensifier
operator is implemented in the fuzzy contrast enhancement technique. For the IFS approach, the Window Based Enhancement Scheme (WBES) and its revised version
(RWBES) are applied. The RWBES gives better results compared to the WBES whereby the vague boundary of the cluster centres are reduced resulting in a smaller
area of the vague boundary. The vague boundary represents the strength of the electrical potential of the foci of seizure. Next, the quality of the output image is
measured via the objective measure such as mean squared error (MSE), peak-signal-to-noise-ratio (PSNR), universal image quality index (UIQI), and structural similarity
index measure (SSIM). In IFS, the sum of membership and non-membership is not necessarily equal to one. Thus, there exists hesitancy in deciding the degree to which
an element satisfies a particular property. Moreover, the sequence of enhanced fEEG images are demonstrated by varying the value of parameter, namely λ, that also
influence the hesitation value π. In addition, the Sugeno type intuitionistic fuzzy generator which is used to compute the non-membership value ν has been extended
to the concept of fuzzy limit. Hence, by implementing the definition of fuzzy limit, different values of will be tested in obtaining the values of integer N that will
determine the value of λ and hence the value of hesitation π. The relationship between membership, non-membership, and hesitation values are also demonstrated
ABSTRAK
Kajian ini memfokuskan kepada penambahbaikan kontras bagi imej
Elektroensifalografi Meleper (fEEG) semasa serangan sawan. Kepentingan utama adalah untuk menggambarkan laluan ribut otak dalam otak semasa berlakunya sawan.
Teknik-teknik terpilih yang terlibat berbagai-bagai dari klasik, kabur biasa, dan kabur lanjutan iaitu set kabur intuisinistik (IFS). Teknik berbeza akan memberikan
imej output fEEG yang berbeza. Kaedah pendekatan klasik adalah Transformasi Hukum Kuasa, Penyamaan Histogram, dan Normalisasi Berdasarkan Saiz Imej.
Pengoperasi keamatan diimplementasi dalam teknik penambahbaikan kontras kabur. Untuk pendekatan IFS, Skim Penambahbaikan Berasaskan Tetingkap (WBES) dan
versinya yang disemak semula (RWBES) digunakan. RWBES memberikan keputusan yang lebih baik berbanding WBES yang mana sempadan kabur bagi pusat gugusan
dikurangkan, lalu menghasilkan kawasan yang lebih kecil bagi sempadan kabur tersebut. Sempadan kabur tersebut mewakili kekuatan potensi elektrik bagi pusat
sawan. Seterusnya, kualiti imej output diukur menerusi ukuran objektif seperti min ralat kuasa dua (MSE), nisbah isyarat puncak kepada hingar (PSNR), indeks kualiti
imej universal (UIQI), dan ukuran indeks kesamaan struktur (SSIM). Dalam IFS, hasil tambah keahlian dan bukan keahlian tidak semestinya bersamaan dengan satu. Oleh
itu, keraguan wujud dalam menentukan darjah bagi suatu unsur memenuhi sesuatu sifat tertentu. Selanjutnya, jujukan imej fEEG yang telah ditambahbaik dipamerkan dengan
mengubah-ubah nilai parameter, iaituλ, yang juga akan mempengaruhi nilai keraguan π. Tambahan pula, penjana intuisinistik kabur jenis Sugeno yang digunakan untuk
mengira nilai bukan keahlianνtelah dilanjutkan kepada konsep had kabur. Seterusnya, dengan mengimplementasi definisi had kabur, nilai yang berbeza akan diuji untuk
memperolehi nilai integerN yang akan menentukan nilai bagiλ dan seterusnya nilai keraguan π. Hubungan antara nilai keahlian, bukan keahlian, dan keraguan turut
TABLE OF CONTENTS
CHAPTER TITLE PAGE
DECLARATION ii
DEDICATION iii
ACKNOWLEDGEMENT iv
ABSTRACT v
ABSTRAK vi
TABLE OF CONTENTS vii
LIST OF TABLES xi
LIST OF FIGURES xii
LIST OF SYMBOLS xvii
LIST OF ABBREVIATIONS xix
LIST OF APPENDICES xx
1 INTRODUCTION 1
1.1 Introduction 1
1.2 Research Background 1
1.3 Problem Statement 3
1.4 Research Questions 4
1.5 Research Objectives 4
1.6 Scope of Research 5
1.7 Significant Contributions 5
2 LITERATURE REVIEW 10
2.1 Introduction 10
2.2 Human Brain 10
2.3 Seizures 19
2.3.1 Classification based on type 19
2.3.2 Classification based on etiology 20
2.3.3 Classification based on epileptic syndromes 21
2.3.4 Pathophysiology of seizure 22
2.4 Digital Image Processing 23
2.5 Fuzzy Image Processing 31
2.6 Intuitionistic Fuzzy Image Processing 33
2.7 Image Enhancement 37
2.8 Noise 41
2.9 Medical Imaging 42
2.10 Electroencephalography 47
2.11 Implementation of Intuitionistic Fuzzy Set in
Medical Images 52
2.12 Conclusion 59
3 MATHEMATICAL BACKGROUND 60
3.1 Introduction 60
3.2 Classical Set 61
3.3 Fuzzy Set 62
3.4 Intuitionistic Fuzzy Set 63
3.5 Sequence of Fuzzy Numbers 66
3.6 Flat EEG (fEEG) 67
3.7 Digital fEEG 71
3.8 Image Quality Assessment 77
3.8.1 Mean Square Error (MSE) 78
3.8.2 Peak-Signal-to-Noise Ratio (PSNR) 78
3.8.4 Structural Similarity Index Measure (SSIM) 80
3.9 Conclusion 81
4 ENHANCING fEEG IMAGE 82
4.1 Introduction 82
4.2 Contrast Enhancement of fEEG Image 82
4.3 Classical Approach 85
4.3.1 Power Law (Gamma) Transformation 85
4.3.2 Histogram Equalization 86
4.3.3 Image Size Dependent Normalization 86
4.4 Fuzzy Approach 87
4.5 IFS Approach 89
4.5.1 The WBES Procedure 89
4.5.2 Revised Version of WBES Procedure 90
4.6 Conclusion 92
5 DEMONSTRATION OF fEEG IMAGE 93
5.1 Introduction 93
5.2 fEEG Input Image 93
5.3 fEEG Output Image by Using Classical Approach 102
5.3.1 Power Law (Gamma) Transformation
Output Image 102
5.3.2 Histogram Equalization Output Image 105
5.3.3 Image Size Dependent Normalization
Output Image 106
5.4 Fuzzy Approach Output Image 107
5.5 IFS Approach Output Image 108
5.5.1 WBES Output Image 108
5.5.2 RWBES Output Image 112
5.6 Results for Other Datasets 121
6 fEEG IMAGE QUALITY TEST 123
6.1 Introduction 123
6.2 Performance Comparisons 123
6.3 Analysis and Discussion of Quality Test 126
6.4 SSIM Index Map for fEEG Output Image 128
6.5 Conclusion 136
7 DETERMINATION OF HESITATION VALUE 137
7.1 Introduction 137
7.2 Hesitation Value via Fuzzy Limit 137
7.3 Conclusion 143
8 CONCLUSION 145
8.1 Introduction 145
8.2 Summary of Thesis 145
8.3 Significance of Research 147
8.4 Future Work 147
REFERENCES 149
LIST OF TABLES
TABLE NO. TITLE PAGE
5.1 The location and electrical potential of cluster centres
on fEEG (patientA) 100
6.1 Performance comparison for Power Law
Transformation,t= 1 124
6.2 Performance comparison for Histogram Equalization,
t = 1 124
6.3 Performance comparison for Image Size Dependent
Normalization,t= 1 124
6.4 Performance comparison for Fuzzy Approach,t= 1 124
6.5 Performance comparison for WBES with 4 partitioned
windows,t = 1 125
6.6 Performance comparison for WBES with 16 partitioned
windows,t = 1 125
6.7 Performance comparison for RWBES with no partitioned window; fuzzification by Equation 4.6,
t = 1 125
6.8 Performance comparison for RWBES with 4 partitioned
windows; fuzzification by Equation 4.6,t= 1 125
6.9 Performance comparison for RWBES with no partitioned windows; fuzzification by Equation
4.7,t = 1 126
6.10 Performance comparison for RWBES with 4 partitioned
windows; fuzzification by Equation 4.7,t= 1 126
7.1 Values of Parameters 140
LIST OF FIGURES
FIGURE NO. TITLE PAGE
1.1 Research contribution on fEEG image 7
1.2 Research framework 9
2.1 Human brain [7] 11
2.2 (a) Dorsal portion (b) Lateral portion [11] 12
2.3 (a) Ventral portion (b) Insular lobe [11] 12
2.4 Medial portion [11] 13
2.5 Specific brain functions based on cerebral lobes [9] 14
2.6 Cortical layers and neuronal organizations [9] 15
2.7 Neuronal action potential and depolarization [8] 16
2.8 Graph of action potential of the neurons [8] 17
2.9 Broadmann area of the brain [13] 17
2.10 Cortical Homunculus [11] 18
2.11 Uncinate seizure origin [11] 22
2.12 Jacksonian seizure origin [11] 22
2.13 Pixel quantization in digital image [21] 25
2.14 Image digitization [18] 26
2.15 Illustration of image sampling and quantization. (a) Original image, (b) Image under sampling, (c) Image
under quantization [24] 26
2.16 An example of the digital image acquisition process. (a) Energy (illumination) source, (b) An element of a scene, (c) Imaging system, (d) Projection of the scene onto the
image plane, (e) Digitized image [18] 26
2.17 Fundamental steps in digital image processing [18] 27
2.19 (a) Original image, (b) Restored image [18] 28
2.20 An RGB image. (a) RGB image, (b) R component, (c)
G component, (d) B component [18] 29
2.21 Original image and compressed images with different
coefficients [18] 29
2.22 (a) Original image, (b) Image segmented by Sobel edge
detector, (c) Image segmented by Prewitt edge detector [18] 30
2.23 Structure of fuzzy image processing [22] 33
2.24 Intuitionistic fuzzy image processing framework [32] 36
2.25 Transformation of imagef into imagegusingT [35] 38
2.26 Improving image contrast by adjusting the image
histogram [39] 38
2.27 (a) Original image, (b) Edge of the image [40] 39
2.28 Noise reduction examples [41] 39
2.29 Image enhancement for brightness transformation 40
2.30 (a) Original image, (b) With added salt and pepper noise [43] 42
2.31 (a) Original image, (b) Image corrupted by Gaussian
noise [24] 42
2.32 CT scan device [44] 43
2.33 CT scan images of the brain [45] 43
2.34 Medical images. (a) Ultrasound, (b) X-ray, (c) MRI [27] 44
2.35 Imperfections in medical images [47] 45
2.36 Medical image methods [47] 46
2.37 Brain imaging methods hierarchy [47] 46
2.38 An EEG system [49] 47
2.39 Post synaptic dendritic potential (current dipole)
measure by EEG [52] 49
2.40 Functional magnetic resonance imaging (fMRI) [58] 50
2.41 Magnetoencephalography (MEG) [59] 50
2.42 Positron Emission Topography (PET) [60] 51
2.43 Video EEG (V-EEG) [63] 52
2.44 (a) Blood cell image, (b) FCM cluster, (c) Intuitionistic
2.45 (a) CT scan brain image, (b) Enhancement using fuzzy method, (c) Enhancement using intuitionistic fuzzy method, (d) Enhancement using proposed intuitionistic
fuzzy set [64] 54
2.46 (a) Original image, (b) Otsu method (nonfuzzy method), (c) Bustince method (IFS method), (d) Robert method (nonfuzzy method), (e) Couto method, (f) Chaira and Ray method, (g) Vlachos method, (h) Proposed method
by Chaira [66] 55
2.47 (a) Brain image, (b)-(d) Chaira method, (e) Canny’s
method [68] 56
2.48 (a) Hestain image, (b) Bustince method, (c) Proposed
Chaira’s method [68] 57
3.1 Category of uncertainty [71] 61
3.2 Geometrical representation of Atanassov’s IFS [33] 64
3.3 Flat EEG at different time (in seconds) [88] 68
3.4 EEG coordinate system [4] 69
3.5 EEG projection [4] 70
3.6 EEG signal [4] 71
3.7 Analyzed EEG signal [4] 71
3.8 Transfomation of EEG signal 72
3.9 Voronoi digitization on fEEGx-axis [6] 73
3.10 fEEG pixels [6] 74
3.11 Fuzzy neighborhood of each cluster centrecjof a fEEG [6] 76
3.12 fEEG image [6] 76
4.1 Classical approach 84
4.2 Fuzzy approach 84
4.3 IFS approach 85
4.4 Fuzzy contrast enhancement 88
4.5 Flowchart of the RWBES process 92
5.1 A sample of EEG signal for patientA 95
5.2 The fEEG and fEEG image for patietAat timet= 1to
t = 16 99
5.4 Membership value of fEEG image at time 1 of size11×11 101
5.5 (a) fEEG image at time 1 of size201 ×201 (b) Image
histogram 101
5.6 fEEG output image forγ = 0.5, (a) Output image (b)
Image histogram 102
5.7 fEEG output image forγ = 1, (a) Output image (b)
Image histogram 103
5.8 fEEG output image forγ = 2, (a) Output image (b)
Image histogram 103
5.9 fEEG output image forγ = 3, (a) Output image (b)
Image histogram 103
5.10 fEEG output image forγ = 4, (a) Output image (b)
Image histogram 104
5.11 fEEG output image forγ = 8, (a) Output image (b)
Image histogram 104
5.12 fEEG output image forγ = 10, (a) Output image (b)
Image histogram 104
5.13 fEEG output image forγ = 20, (a) Output image (b)
Image histogram 105
5.14 Using global histogram equalization, (a) fEEG output
image (b) Image histogram 105
5.15 Using local histogram equalization, (a) fEEG output
image (b) Image histogram 106
5.16 Using Image Size Dependent Normalization, (a) fEEG
output image (b) Image histogram 106
5.17 Fuzzification by using Equation 4.6, (a) fEEG output
image (b) Image histogram 107
5.18 Fuzzification by using Equation 4.7, (a) fEEG output
image (b) Image histogram 107
5.19 fEEG output image by using WBES with 4 partitioned
windows 109
5.20 Histogram by using WBES with 4 partitioned windows 110
5.21 fEEG output image by using WBES with 16 partitioned
windows 111
5.23 fEEG output image with no partitioned window
(fuzzification by Equation 4.6) 114
5.24 Histogram of Figure 5.23 115
5.25 fEEG output image by using 4 partitioned windows
(fuzzification by Equation 4.6) 116
5.26 Histogram of Figure 5.25 117
5.27 fEEG output image with no partitioned window
(fuzzification by Equation 4.7) 118
5.28 fEEG output image with 4 partitioned windows
(fuzzification by Equation 4.7) 119
5.29 Histogram of Figure 5.27 120
5.30 Histogram of Figure 5.28 121
6.1 SSIM index map using Power Law Transformation 129
6.2 SSIM index map using global histogram equalization 129
6.3 SSIM index map using local histogram equalization 130
6.4 SSIM index map using Image Size Dependent Normalization 130
6.5 SSIM index map using fuzzy approach (fuzzification by
Equation 4.6) 130
6.6 SSIM index map using fuzzy approach (fuzzification by
Equation 4.7) 131
6.7 SSIM index map using WBES with 4 partitioned windows 131
6.8 SSIM index map using WBES with 16 partitioned windows 132
6.9 SSIM index map for RWBES using fuzzification by
Equation 4.6 with no partitioned window 133
6.10 SSIM index map for RWBES using fuzzification by
Equation 4.6 with 4 partitioned windows 134
6.11 SSIM index map for RWBES using fuzzification by
Equation 4.7 with no partitioned window 135
6.12 SSIM index map for RWBES using fuzzification by
Equation 4.7 with 4 partitioned windows 136
7.1 Relationship between membership, non-membership, and hesitation for tested λ (a) λ = 2, (b) λ = 5, (c)
λ= 10, (d)λ= 46, (e)λ= 92 142
LIST OF SYMBOLS
Na - Sodium ion
K
- Potassium ionCa
- Calcium ionCl
- Chloride ionij
x
- Gray level at pixel
i j,
I
x
ij
- Membership value of the gray level xijI
- An image ofM N
pixelo
- Object function that denotes the object or scenep
- Point-spread functionn - Additive noise-nondeterministic function
X
- A set of elementx
i
A
x
- The degree of non-determinacy or hesitation
A
v x
- Non membershipv x
A
N
- Total number of pixelx
- Standard deviations of xy
r
- Input pixel values
- Output pixel valuec
- Scaling constant
- Positive valueh
- Frequency valueK
- Enhancement variablei
t
- Time ati
seconds- Real number
- Less than or equal to - Member of
-
LIST OF ABBREVIATIONS
EEG - Electroencephalography
EEG
C
- EEG coordinate systemFTTM - Fuzzy Topographical Topological Mapping IFS - Intuitionistic fuzzy set
IFIP - Intuitionistic fuzzy image processing fEEG - Flat Electroencephalography
MSE - Mean square error
PSNR - Peak signal to noise ratio UIQI - Universal image quality index SSIM - Structural similarity index measure
WBES - Window Based Enhancement Scheme
RWBES - Revised Version of Window Based Enhancement Scheme
PET - Positron Emission Topography
MEG - Magnetoencephalography
I-EEG - Intracranial Electroencephalograph
ECoG - Electrocorticography
fMRI - Functional magnetic resonance image
CT - Computerized tomography
LIST OF APPENDICES
APPENDIX TITLE PAGE
A Implementation of Patient A 158
B Implementation of Patient B 194
C Approval Letter of Using EEG System at Hospital Kuala Lumpur
266
INTRODUCTION
1.1 Introduction
The human body functions are generally controlled by two most important
systems which are the nervous system and the endocrine system. Human nervous system is a very complex system, well organized, highly sophisticated with estimated at least about 100 billion of neurons and 100 trillion of interconnections or synapses
involve in its networking system. It can be divided anatomically into central nervous system (CNS) which comprises the brain and spinal cord, and the peripheral nervous
system (PNS) which forms the cranial and spinal rootlets. It also can be classified base
on the functional status into somatic nervous system which innervates the structures of the body wall such as skin, muscles and mucous membranes or the autonomic nervous system (ANS) which innervates the smooth muscles, internal organs, blood vessels
and glandular system. These systems work together to maintain body homeostasis and
internal milieu state within the acceptable normal physiological condition in order to allow the hormones, enzymes, metabolism and other vital functions for life able to operate in the most optimal condition [1].
1.2 Research Background
Epilepsy is a general term used for a group of disorders that cause disturbances
in electrical signalling in the brain. It is not a disease but a symptom that originated in the brain. A seizure refers to a single event of abnormal and excessive electrical
condition which is epilepsy. Epileptic foci refer to the location of the current sources
that generate the corresponding magnetic fields. Electroencephalography (EEG) has been used as a system that measures and records electrical activity of the brain in
graphic form [2]. It is a method of visualizing physiology to discover the hidden causes of epilepsy such that it reads voltage differences on the head relative to a given point [3].
In the preliminary study by Fuzzy Research Group (FRG) of Universiti Teknologi Malaysia (UTM) in 1999, the data sources is based only on the data
collected from epileptic patients from Hospital Kuala Lumpur (HKL) and Hospital Universiti Sains Malaysia (HUSM) Kubang Kerian, Kelantan. Previous study by
Zakaria [4] showed the transformation of the EEG signal during epileptic seizure into Flat Electroencephalography (fEEG) via flattening method. It is a mathematical
technique that involved the mapping from high dimensional signal (i.e, EEG signal) into low dimensional space (i.e, fEEG) whereby clustering process was carried out
in the study. Then the signals were transformed into discrete data by using Nicolet One software. The EEG signal was then processed by using Fuzzy c-means (FCM)
clustering to cluster the discrete data at every second. Finally, the optimal number of clusters were obtained via cluster validity.
Moreover, previous study by Abdy [5, 6] showed the transformation of fEEG into digital fEEG and finally into image. Digitization process of fEEG by using
the Voronoi digitization is implemented in obtaining the digital fEEG. Next, fuzzy approach is applied in assigning the membership value for each pixel via the
quantization pixel process. Finally, the membership value is transformed into gray level value such that an image of fEEG is obtained. The main aim of the previous
research by Zakaria [4] and Abdy [6] is to visualize and to trace the electrical pulses paths of the brainstorm event right from the scalp of the head to the point where they
started (i.e. the foci).
In the literature, most of the images or specifically medical images are captured
by using medical devices such as X-ray, MRI, CT scan, ultrasound, 3D imaging systems and so forth. The occurrence of noise in an image may be caused by the system
images of fEEG are obtained without using any image processing system devices. It is
a challenging task since the abnormalities are detected non-invasively.
1.3 Problem Statement
In the process of imaging and transformations such as fEEG, it is hard to avoid the inheritance of different kinds of noise during recording of the EEG signals. Since
the regions of clusters in fEEG are not always defined, uncertainty might arise within every transformations. In this study, the noise is defined as the uncertainty that occur in
transforming the EEG signal into image. Furthermore, the digital fEEG itself is a fuzzy object which has been proven in details in Abdy [6]. In the process of determining the
membership value, uncertainty might arise due to the lack of information or knowledge which lead to the unclear boundaries of the epileptic foci.
In Abdy [6], the boundary area of the epileptic foci which is represented in the shades of gray is not well-defined. The shades of gray spread out widely since
it considered the electrical potential strength. Thus, in the presence of noise, pre-processing steps such as image enhancement is needed. The objectives of image
enhancement are to remove noise, to smooth non impulsive noise, and to enhance the edges or other salient structures on fEEG.
Besides that, in order to have a clearer boundary, unwanted background or
unwanted object in the scene should be eliminated. Hence, enhancement is carried
out in order to obtain an improved image of fEEG. Since the focus of this study is to enhance the boundary of the epileptic foci, therefore, the unwanted object or background which is the electrical potential strength will be suppressed or reduced.
Previous study by Abdy [6] has implemented fuzzy set in determining the membership
value of the pixels. Therefore, it is more realistic to acquire a more comprehensive element rather than ordinary fuzzy set since the ordinary fuzzy set only considers the
membership value of an element. The enhancement technique that is implemented in this study is based on the intuitionistic fuzzy set (IFS) approach which considered
handling the inherent uncertainty carried by image pixels. Hence, in dealing with noise
and to obtain more accurate results, more advanced techniques that considered more parameters other than membership value is needed.
1.4 Research Questions
Some of the research questions are as follows:
1. How to reduce the vague boundary of the epileptic foci?
2. How to measure the image quality of fEEG?
3. How does implementing different approaches might affect the fEEG output image?
4. To what extent the enhancement methods may help in visualizing the path of brainstorm during seizure?
5. How to determine the hesitation value via fuzzy limit?
1.5 Research Objectives
The main objectives of this study are as follows:
1. To enhance the contrast of fEEG input images in determining the epileptic foci
by classical and non-classical approaches.
2. To investigate the fEEG output images by various methods such as classical and non-classical approaches.
3. To evaluate the quality of the output images via different image quality
assessment.
1.6 Scope of Research
The research focused mainly on enhancing the contrast of fEEG input images
during epileptic seizures. The IFS approach is implemented on fEEG input images via Window Based Enhancement Scheme (WBES) and Revised Version of WBES
(RWBES). Furthermore, the results are compared with selected classical and ordinary fuzzy approaches. Data that is used in this research is based on the secondary data of
epileptic patients that obtained from Hospital Universiti Sains Malaysia (HUSM) and Hospital Kuala Lumpur (HKL).
1.7 Significant Contributions
In this digital era, everything is seemed to be computerized due to the
rapid development in advanced technologies. The environment of medical imaging has changed dramatically from analogue to digital technology. It is important in assisting medical practitioners to diagnose different medical condition without having
to undergo surgical procedure to look into various organs and areas in the body.
The contributions of the research particularly in the fEEG image is described briefly in Figure 1.1. Figure 1.1 begins with the technique of EEG whereby small and non-invasive electrode is placed on the patient’s head. EEG is an aid in characterizing
epilepsy and plays important role in localizing the damaged tissue. The type of the
activity such as abnormal patterns (e.g. spikes and sharp waves) can be seen in the EEG signals recording.
This study has built on previous related work by Zakaria [4] and Abdy [6]
which indicates the continuity of research work. Furthermore, this research adopts the
techniques of image processing in enhancing the contrast of fEEG images in different domains which are the classical and non-classical. The non-classical are the ordinary fuzzy and advanced fuzzy approaches. Different contrast enhancement techniques
show different fEEG output images. Fuzzy theory based technique is designed in this
together medical field, mathematics, signal and image processing. It is expected
to contribute greatly in these fields. This study contains a mixture of theoretical development and practical investigation.
Besides that, the RWBES is proposed in obtaining better fEEG output images. In RWBES there are two different ways of fuzzification that have been done for the
fEEG input images. The RWBES able to reduce the vague boundaries of the cluster centres. It also able to preserve information of the clusters as the value ofλincreased.
The outcome of the fEEG images may help in determining or improving the visibility of a sharp boundary of the epileptic foci. It is expected from the results that a clearer
view of the path is able to be visualized during seizure. Moreover the Sugeno type intuitionistic fuzzy generator is extended to the concept of fuzzy limit which highlights
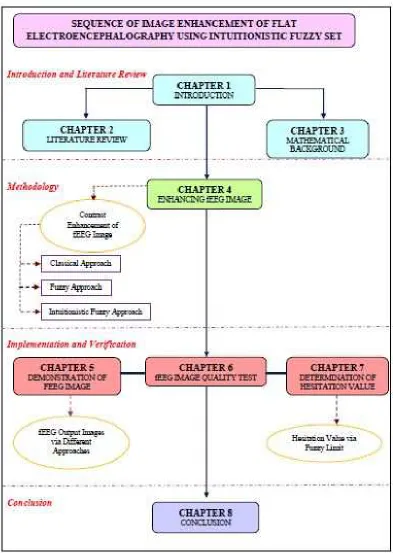
1.8 Research Framework
This research consists of eight chapters and the summary of framework is
shown in Figure 1.2. The first chapter serves as an introduction to the whole thesis. This chapter provides the general information about the research background,
problem statement, research questions, research objectives, scope of the research, and significant contributions. Chapter 2 presents the literature review of this research
which contains of information on human brain, seizure, digital image processing, fuzzy image processing, intuitionistic fuzzy image processing, image enhancement, medical
imaging, and electroencephalography.
The mathematical background of fEEG image is demonstrated in Chapter 3.
Moreover, the mathematical concepts of classical set, fuzzy set, intuitionistic fuzzy set, sequence of fuzzy number, fEEG, digital fEEG, and image quality assessment are
discussed in this chapter. The enhancement process of fEEG image is discussed in Chapter 4. It focused on contrast enhancement which covers the classical, fuzzy, and
intuitionistic fuzzy approaches. The selected methods and algorithms are presented in details in this chapter. The implementation of the enhancement methods is given in
Chapter 5. The fEEG input image that is presented in this chapter is for patientA at timet= 1with size of201×201, which is a grayscale image. Different enhancement
methods will give different output images.
Chapter 6 demonstrates some image quality indices that are applied to the
input and output images which consist of the error based and structural based metrics. Additionally, in Chapter 7, the concept of Sugeno type intuitionistic fuzzy generator in
the non-membership function is extended to the concept of fuzzy limit. Some values of εare tested to obtain the values of integerN. Hence the values ofλand hesitationπare
1. DiFrancesco, M. W., Holland, S. K. and Szaflarski, J. P. Simultaneous
EEG/Functional Magnetic Resonance Imaging at 4 Tesla: Correlates of Brain Activity to Spontaneous Alpha Rhythm During Relaxation. Journal of Clinical
Neurophysiology: Official Publication of the American Electroencephalographic
Society. 2008. 25(5): 255.
2. Rudman, J.EEG Technician. National Learning Corporation. 2012.
3. Shorvon, S. D., Andermann, F. and Guerrini, R. (Eds.). The Causes of Epilepsy
(Common and Uncommon Causes in Adults and Children). Cambridge University
Press. 2011.
4. Zakaria, F. Dynamic Profiling of EEG Data During Seizure Using Fuzzy
Information. Ph.D. Thesis. Universiti Teknologi Malaysia; 2008.
5. Abdy, M. and Ahmad, T. Transformation of EEG Signals into Image Form During Epileptic Seizure.International Journal of Basic & Applied Sciences. 2011. 11(2): 18–23.
6. Abdy, M. Fuzzy Digital Topological Space and Image of Flat
Electroencephalography During Seizure. Ph.D. Thesis. Universiti Teknologi
Malaysia; 2014.
7. Snell, R. S.Clinical Neuroanatomy Book. Lippincott Williams & Wilkins. 2006.
8. Waxman, S. G. Clinical Neuroanatomy Book. McGraw-Hill Medical New York.
2010.
9. Adel, K. A. and Ronald, A. B. Functional Neuroanatomy: Text and Atlas.
Functional Neuroanatomy: Text and Atlas. 2005.
11. Sofan, M. Z. Neurosurgeon, Neurosurgery Department, Queen Elizabeth Hospital,
Kota Kinabalu, Sabah, 2016.
12. H¨am¨al¨ainen, M., Hari, R., Ilmoniemi, R. J., Knuutila, J. and Lounasmaa,
O. V. Magnetoencephalography: Theory, Instrumentation, and Applications to Noninvasive Studies of the Working Human Brain. Reviews of Modern Physics.
1993. 65(2): 413.
13. Brodmann, K. and Garey, L. J.Brodmann’s: Localisation in the Cerebral Cortex.
Springer Science & Business Media. 2007.
14. Weaver, D. F. Epilepsy and Seizures: Everything You Need To Know. Firefly
Books. 2001.
15. Hunt, K. A.The Art of Image Processing with Java. CRC Press. 2010.
16. Joshi, M. A. Digital Image Processing: An Algorithm Approach. PHI Learning Pvt. Ltd. 2006.
17. Burdick, H. E. Digital Imaging: Theory and Applications. McGraw-Hill, Inc. 1997.
18. Gonzalez, R. C. and Woods, R. E.Digital Image Processing. Prentice Hall Upper Saddle River, NJ. 2008.
19. Zhang, Y.Image Engineering. Publishing House of Tsinghua University. 2009.
20. Solomon, C. and Breckon, T. Fundamentals of Digital Image Processing: A Practical Approach with Examples in Matlab. John Wiley & Sons. 2011.
21. Kumar, M. and Singh, R. Digital Image Processing of Remotely Sensed Satellite Images for Information Extraction. InConference on Advances in Communication
and Control Systems (CAC2S 2013). 2013.
22. Acharya, T. and Ray, A. K.Image Processing: Principles and Applications. John
23. Lakshmi, J. K. and Punithavalli, M. A Survey on Skeletons in Digital Image
Processing. InInternational Conference on Digital Image Processing. IEEE. 2009. 260–269.
24. Zhou, H., Wu, J. and Zhang, J.Digital Image Processing: Part I. Bookboon. 2010.
25. Awcock, G. J. and Thomas, R.Applied Image Processing. McGraw-Hill, Inc. 1995.
26. Frank, Y. S.Image Processing and Pattern Recognition. John Wiley & Sons. 2010.
27. Chaira, T. and Ray, A. K.Fuzzy Image Processing and Applications with MATLAB.
CRC Press, Inc. 2010.
28. Pal, S. K. Fuzzy Sets in Image Processing and Recognition. InIEEE International
Conference on Fuzzy Systems. IEEE. 1992. 119–126.
29. Hanmandlu, M., Jha, D. and Sharma, R. Color Image Enhancement by Fuzzy
Intensification.Pattern Recognition Letters. 2003. 24(1): 81–87.
30. Chaira, T. and Ray, A. Segmentation Using Fuzzy Divergence.Pattern Recognition Letters. 2003. 24(12): 1837–1844.
31. Vlachos, I. K. and Sergiadis, G. D. Intuitionistic Fuzzy Image Processing. InSoft Computing in Image Processing. Springer. 2007. 383–414.
32. Vlachos, I. K. and Sergiadis, G. D. Intuitionistic Fuzzy Information–Applications to Pattern Recognition.Pattern Recognition Letters. 2007. 28(2): 197–206.
33. Vlachos, I. K. and Sergiadis, G. D. The Role of Entropy in Intuitionistic Fuzzy Contrast Enhancement. In Foundations of Fuzzy Logic and Soft Computing.
Springer. 2007. 104–113.
34. Chaira, T. Medical Image Thresholding Scheme Using Atanassov Intuitionistic
Fuzzy Set. In Proceeding of International Conference on Methods and Models in
Computer Science, 2009. ICM2CS 2009.. IEEE. 2009. 1–5.
36. Petrou, M. and Petrou, C. Image Processing: The Fundamentals. John Wiley &
Sons. 2010.
37. Marques, O. Practical Image and Video Processing Using MATLAB. John Wiley
& Sons. 2011.
38. Chaira, T. A Rank Ordered Filter for Medical Image Edge Enhancement and
Detection Using Intuitionistic Fuzzy Set. Applied Soft Computing. 2012. 12(4): 1259–1266.
39. Jahne, B. Digital Image Processing: Concepts, Algorithms, and Scientific Applications.Berlin, Heildelberg: Springer-Verlag. 1997.
40. Rakesh, R. R., Chaudhuri, P. and Murthy, C. Thresholding in Edge Detection: A Statistical Approach.IEEE Transactions on Image Processing. 2004. 13: 927–936.
41. Van De Ville, D., Nachtegael, M., Van der Weken, D., Kerre, E. E., Philips, W. and Lemahieu, I. Noise Reduction by Fuzzy Image Filtering.IEEE Transactions
on Fuzzy Systems. 2003. 11(4): 429–436.
42. Mythili, C. and Kavitha, V. Efficient Technique for Color Image Noise Reduction. The Research Bulletin of Jordan, ACM. 2011. 1(11): 41–44.
43. McAndrew, A. An Introduction to Digital Image Processing with Matlab.School of Computer Science and Mathematics, Victoria University of Technology. 2004:
1–264.
44. Mayoclinic. (2017, March 1). CT Scan Slices. Retrieved from website:
http://www.mayoclinic.org/tests-procedures/ct-scan/multimedia/ct-scan-slices/img-20008348.
45. Mayoclinic. (2017, March 1). CT Scan Images of the Brain. Retrieved from website:
http://www.mayoclinic.org/tests-procedures/ct-scan/multimedia/ct-scan-images-of-the-brain/img-20008347.
46. Chaira, T. Intuitionistic Fuzzy Set Theory in Medical Imaging. International
47. Yasmin, M., Sharif, M., Masood, S., Raza, M. and Mohsin, S. Brain Image
Enhancement-A Survey. World Applied Sciences Journal. 2012. 17(9): 1192– 1204.
48. Nunez, P. L. and Pilgreen, K. L. The Spline-Laplacian in Clinical Neurophysiology: A Method to Improve EEG Spatial Resolution. Journal of
Clinical Neurophysiology. 1991. 8(4): 397–413.
49. Michel, C. M. and Murray, M. M. Towards the Utilization of EEG as a Brain
Imaging Tool.Neuroimage. 2012. 61: 371–385.
50. Benbadis, S. R., Husain, A. M., Kaplan, P. W., Tatum, W. O., Tatum, W., Benbadis,
S., Husain, A. and Kaplan, P. Handbook of EEG Interpretation. Demos Medical Publishing. 2007.
51. Klein, S. B. and Thorne, B. M.Biological Psychology. Macmillan. 2006.
52. Niedermeyer, E. and Da Silva, F. L. Electroencephalography: Basic Principles,
Clinical Applications, and Related Fields. Lippincott Williams & Wilkins. 2005.
53. Khalil, B. A. and Misulis, K. Atlas of EEG & Seizure Semiology. Elsevier, Butterworth Heinehmann Edition, Philadelphia. 2006.
54. Schenck, J. F. The Role of Magnetic Susceptibility in Magnetic Resonance Imaging: MRI Magnetic Compatibility of the First and Second Kinds. Medical
Physics. 1996. 23(6): 815–850.
55. Murphy, K. J. and Brunberg, J. A. Adult Claustrophobia, Anxiety and Sedation in
MRI.Magnetic Resonance Imaging. 1997. 15(1): 51–54.
56. O’Regan, S., Faul, S. and Marnane, W. Automatic Detection of EEG Artefacts
Arising from Head Movements. InEngineering in Medicine and Biology Society (EMBC), 2010 Annual International Conference of the IEEE. IEEE. 2010. 6353–
6356.
57. Yasuno, F., Brown, A. K., Zoghbi, S. S., Krushinski, J. H., Chernet, E.,
C. C. The Pet Radioligand [11C] Meppep Binds Reversibly and with High
Specific Signal to Cannabinoid CB1 Receptors in Nonhuman Primate Brain. Neuropsychopharmacology. 2007. 33(2): 259–269.
58. What is fMRI? (2017, March 1). Retrieved from website: http://fmri.ucsd.edu/Research/whatisfmri.html.
59. Magnetoencephalography. (2017, March 1). Retrieved from website: http://www.supraconductivite.fr/en/index.php.
60. PET Scan. (2017, March 1). Retrieved from website: http://www.nhs.uk/Conditions/PET-scan/Pages/Introduction.aspx.
61. Schl¨ogl, A., Slater, M. and Pfurtscheller, G. Presence Research and EEG. In Proceedings of the5thInternational Workshop on Presence. 2002. 9–11.
62. Laufs, H., Kleinschmidt, A., Beyerle, A., Eger, E., Salek-Haddadi, A., Preibisch, C. and Krakow, K. EEG-Correlated fMRI of Human Alpha Activity.Neuroimage.
2003. 19(4): 1463–1476.
63. What is Video EEG Monitoring? (2017, March 1). Retrieved from website: http://www.seizuretheday.org/2014/04/what-is-video-eeg-monitoring.html.
64. Chaira, T. Medical Image Enhancement Using Intuitionistic Fuzzy Set. In 1st International Conference on Recent Advances in Information Technology
(RAIT-2012), March 15–17. IEEE. 2012. 54–57.
65. Chaira, T. A Novel Intuitionistic Fuzzy c-Means Clustering Algorithm and Its
Application to Medical Images.Applied Soft Computing. 2011. 11(2): 1711–1717.
66. Chaira, T. Intuitionistic Fuzzy Segmentation of Medical Images. IEEE
Transactions on Biomedical Engineering. 2010. 57(6): 1430–1436.
68. Chaira, T. and Chaira, T. Intuitionistic Fuzzy Set: Application to Medical Image
Segmentation. In Computational Intelligence in Medical Informatics. Springer. 2008. 51–68.
69. Chaira, T. and Anand, S. A Novel Intuitionistic Fuzzy Approach for
Tumor/Hemorrhage Detection in Medical Images. Journal of Scientific and
Industrial Research. 2011. 70(6): 427–434.
70. Chaira, T. and Ray, A. A New Measure Using Intuitionistic Fuzzy Set Theory and Its Application to Edge Detection.Applied Soft Computing. 2008. 8(2): 919–927.
71. Ross, T. J.Fuzzy Logic with Engineering Applications. John Wiley & Sons. 2009.
72. Halpern, J. Y.Reasoning About Uncertainty. MIT Press Cambridge. 2005.
73. Mukaidono, M.Fuzzy Logic for Beginners. vol. 34. World Scientific. 2001.
74. Negnevitsky, M. Artificial Intelligence: A Guide to Intelligent Systems. Pearson Education. 2005.
75. Zadeh, L. A. Fuzzy Sets.Information and Control. 1965. 8(3): 338–353.
76. Atanassov, K. T. Intuitionistic Fuzzy Sets. J. Fuzzy Sets and Systems. 1986. 20:
87–96.
77. Wang, L. X.A Course in Fuzzy Systems. Prentice-Hall Press, USA. 1999.
78. Grzegorzewski, P. and Mr´owka, E. Some Notes on (Atanassov’s) Intuitionistic
Fuzzy Sets.Fuzzy Sets and Systems. 2005. 156(3): 492–495.
79. Atanassov, K. Answer to D. Dubois, S. Gottwald, P. Hajek, J. Kacprzyk and H. Prade’s Paper Terminological Difficulties in Fuzzy Set Theory: The Case of
Intuitionistic Fuzzy Sets.Fuzzy Sets and Systems. 2005. 156(3): 496–499.
80. Atanassov, K. T. Intuitionistic Fuzzy Sets: Past, Present and Future. InEUSFLAT Conference. 2003. 12–19.
81. Deschrijver, G. and Kerre, E. E. On the Relationship between Some Extensions of
82. Deschrijver, G. and Kerre, E. E. On the Position of Intuitionistic Fuzzy Set Theory
in the Framework of Theories Modelling Imprecision.Information Sciences. 2007. 177(8): 1860–1866.
83. Gerstenkorn, T. and Ma´nko, J. Bifuzzy Probabilistic Sets.Fuzzy Sets and Systems. 1995. 71(2): 207–214.
84. Bustince, H. and Burillo, P. Vague Sets are Intuitionistic Fuzzy Sets. Fuzzy Sets and Systems. 1996. 79(3): 403–405.
85. Nikolova, M., Nikolov, N., Cornelis, C. and Deschrijver, G. Survey of the Research on Intuitionistic Fuzzy Sets. InProceedings of the6thJoint Conference
on Information Sciences. Association for Intelligent Machinery. 2002. 117–120.
86. Savas, E. A Note on Sequence of Fuzzy Numbers. Information Sciences. 2000.
124: 297–300.
87. Nanda, S. On Sequences of Fuzzy Numbers. Fuzzy Sets and Systems. 1989. 33:
123–126.
88. Ahmad, T., Abdullah, J., Fauziah, F., Mustapha, F. and Zabidi, H. Tracking the Storm in the Brain.J. Quantitative Methods. 2006. 2: 1–9.
89. Ahmad, N. Theoretical Foundation for Digital Space of Flat Electroencephalogram. Ph.D. Thesis. Universiti Teknologi Malaysia; 2009.
90. Wang, Z., Bovik, A. C. and Lu, L. Why is Image Quality Assessment So Difficult?
In IEEE International Conference on Acoustics, Speech, and Signal Processing
(ICASSP). IEEE. 2002. 4: 3313–3316.
91. Wang, Z., Bovik, A. C., Sheikh, H. R. and Simoncelli, E. P. Image Quality
Assessment: From Error Visibility to Structural Similarity.IEEE Transactions on Image Processing. 2004. 13(4): 600–612.
92. Dosselmann, R. and Yang, X. D. Existing and Emerging Image Quality Metrics.
In Canadian Conference on Electrical and Computer Engineering. IEEE. 2005.
93. Hore, A. and Ziou, D. Image Quality Metrics: PSNR vs. SSIM. In 20th
International Conference on Pattern Recognition (ICPR). IEEE. 2010. 2366–2369.
94. Wang, Z. and Bovik, A. C. A Universal Image Quality Index.Signal Processing
Letters, IEEE. 2002. 9(3): 81–84.
95. Zohair, A., Sulong, G., Johar, M. G. M. Enhancing the Contrast of CT Medical