CloudBridge: A Cloud-Powered System Enabling Mobile
Devices to Control Peripherals Without Drivers
Seungeun Chung, Kyunghan Lee, Shuiqing Wang, Injong Rhee
Department of Computer Science North Carolina State University
Raleigh, NC 27695, USA
{
schung5, klee8, swang24, rhee
}@ncsu.edu
ABSTRACT
Smart devices including smart phones and tablets are getting more powerful and become versatile enough to replace con-ventional personal computers. Despite the rapid evolution of capabilities of such devices, controlling peripherals such as networked printers is infeasible due to lack of dedicated drivers to communicate with peripherals. To immediately enable smart devices to operate peripherals, we propose a cloud-powered system, CloudBridge. CloudBridge user ap-plication running on a smart device works as a TCP bridge relaying packets between two TCP tunnels connected to a networked peripheral on one side and a cloud server on the other. Through the bridge, it is possible to issue operations from a smart device without having dedicated drivers by ask-ing the cloud server to interpret the operations to a language that the peripheral can understand. CloudBridge further op-timizes user experience through data compression which is adaptively applied based on decision functions. The system is implemented on Android devices and a Linux server, and we demonstrate that it perfectly controls networked print-ers on smart devices. The decision functions are shown to provide optimized QoE metrics such as response time and energy consumption though extensive evaluations.
1.
INTRODUCTION
Smart devices are becoming prevalent in our lives. Ac-cording to a report [3], the total shipments of smart phones and tablets during 2011 were 550.9 million units. The num-ber is higher than 351.4 million units, the total shipments of conventional personal computers (PCs) including desktop, laptop, and netbook. While the market for smart devices is growing dramatically, the capabilities of such devices have also been revolutionized during recent years. Many sur-vey results from business sectors [2, 3, 13] show that smart devices started to replace conventional computers in daily computing leveraging their unique strengths such as dedi-cated applications, faster operations via finger touches, lighter weight, and longer battery time. However, there is a critical limitation of smart devices in replacing conventional com-puters. That is lack of peripheral support. Smart devices are not able to communicate with peripherals such as
net-(a) Cloud Server (b) Smart Device
(c) Networked Peripheral Local network
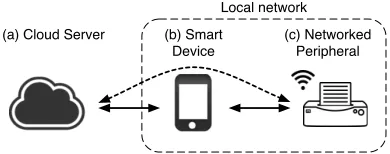
Figure 1: The smart device in the middle works as a bridge connecting a cloud server and a networked pe-ripheral in local at each side through TCP tunnels.
worked printers, scanners, cameras because the manufac-turers of such peripherals do not provide dedicated drivers for smart devices. The limitation can be mitigated by wait-ing the manufactures to release dedicated drivers or portwait-ing drivers developed for PCs to smart devices. However, both approaches are not universally applicable to all peripherals. To address this problem, we propose a networked system leveraging cloud computing, which we call CloudBridge for smart devices.
CloudBridge enables peripheral support in smart devices in a way that is universally applicable and completely
inde-pendent from local PCs. It also provides indistinguishable
experiences to users when controlling peripherals comparing to that from a conventional PC. CloudBridge system consists of an user application for smart devices and a daemon for a cloud server. As shown in Figure 1, the application running on a smart device sets up TCP sockets with a networked pe-ripheral and a cloud server. Using the sockets connecting both sides, CloudBridge makes a smart device as a trans-parent bridge allowing the cloud server with an appropriate driver to communicate with the peripheral. Since the cloud server is assumed to have drivers for most of the peripherals in the market and is controlled by the application, the pe-ripherals become immediately accessible from smart device users. We apply the proposed system to operate networked printers throughout this paper, but one should note that this technique is not limited to printing but applicable to wide variety of peripherals equipped with networking capability.
Cloud-Bridge encounters a critical challenge for its practicality. The cloud server which operates as an interpreter between the user application and the peripheral interprets a file into a print stream written in the printer language, PCL (printer command language), using a proper driver that the target printer can understand. A challenge observed here is that the size of the generated print stream becomes huge ranging from several times to a few hundred times of the original file size. Given that our system relies on networking to deliver the stream to the printer, the increased size directly affects the user experiences such as total print time and energy con-sumption on the smart device.
To address the challenge, we investigate the character-istics of print stream and adopt a compression technique, which shows the best compression efficiency for the print streams. Applying compression brings trade-off between the total print time and the energy consumption because com-pression and decomcom-pression demand time as well as energy. For the optimal use of compression, we model decision func-tions which determines whether to apply compression or not based on two aforementioned criteria. We perform exten-sive experiments with more than a thousand printer models from major printer vendors, whose drivers are installed in our cloud server. The results show that the ratio between the total print time of our system and the time using a
con-ventional PC converges toBp/Bc+ 1 as the file size gets
larger, whereBp andBc denote the network bandwidth to
the printer and to the cloud server, respectively. Also, our decision functions are verified to provide satisfactory user experience in 95% of the time.
Our contributions in this paper include the followings.
• We propose a cloud-powered network system,
Cloud-Bridge, enabling peripheral support in smart devices.
• We implement the system in Android smart devices
and a Linux server, and demonstrate the efficacy of the system for printing.
• We identify a challenge in the system and suggest a
practical solution by adopting a compression technique and its optimal decision function.
The paper is organized as follows. In Section 2, we sum-marize existing approaches which target peripheral support in smart devices. We present detailed system architecture and implementation issues of CloudBridge in Section 3. In Section 4, we validate our implemented system through ex-tensive evaluation and analysis, and introduce compression technique in Section 5 for system optimization. Finally, we conclude the work in Section 6.
2.
RELATED WORK
In this section, we focus on techniques providing a spe-cific peripheral support, printing from smart devices. There have been various techniques enabling printing from smart devices, but the existing techniques do not perfectly achieve
our goals, independent, complete, and universal peripheral support for smart devices. We survey the techniques and discuss about them in detail.
Printer driver is a software that converts digital data into bit streams, which can be understood by a printer. To oper-ate a printer on a PC, the driver should be installed before-hand. If the printer vendors do not provide dedicated drivers to smart devices, there is no intuitive way to operate printers directly from smart devices. To address the problem, vari-ous approaches have been tried. The fact that there are over 300 printing applications in Android Market shows high de-mand of a solution from users. Printing solution available in the market are classified into three categories: 1) printing through a PC connected to a printer, 2) printing through a mobile driver ported from PC, and 3) directly printing using a special printer.
(1) Printing via a PC.
Most of the applications listed in mobile application mar-kets make use of a local PC directly connected with a printer via wired or wireless connection. Such applications send a file to the computer and ask to issue print command. Ap-ple’s AirPrint [1] and Google’s CloudPrint [5] adopt this approach. Many Android applications that support mobile printing exploit the CloudPrint service. This approach re-quires setup procedure in advance and the relaying PC to be always turned on waiting for the request. We consider this approach does not meet our goal, independence.
(2) Using ported drivers.
To enable independent operation from PC when printing from smart devices, several companies such as PrinterShare [11] and Samsung [12] provide applications which contain printer drivers ported for smart devices. This approach immediately allows smart devices to operate printers, but the number of supported printer models is very limited. Also, functional limitations may exist since the drivers are not dedicated es-pecially when the conversion is not provided by the vendors. Some proprietary functions may not be accessible. This ap-proach lacks universal support.
(3) Using driver-less printers.
Solutions Independence from PC Complete file type support Universal printer support
Printing via a PC [1, 5] × ◦ ◦
Using ported drivers [11, 12] ◦ × ×
Driver-less printers [4, 6, 9] ◦ × ×
CloudBridge ◦ ◦ ◦
Table 1: Mobile printing solutions in the market and their characteristic classification based on three criteria. Cloud-Bridge satisfies all key features: it provides independent, complete, and universal peripheral support.
Print Server
Smart Device Application
Local Printer
t1
Automatic discovery Manual discovery
TCP connection 1
5. Type conversion
4. File transmission
1. Discovery request 2. Discovery response
6. Print stream generation
7. Stream forwarding
8. Stream forwarding TCP connection 2
9. Error check
t2
t3
t4
t5
Compression (Optional)
Decompression (Optional)
3. User input
Figure 2: The communication sequence of CloudBridge.
RTF), image (BMP, JPEG), but not the advanced formats widely used, e.g., Encapsulated PostScript (EPS), Windows Metafile (WMF), and Adobe Photoshop (PSD).
Table 1 summarizes features of the existing printing tech-niques compared with CloudBridge system. As shown in the table, our approach relying on the cloud server satisfies all key features: it provides independent, complete, and univer-sal peripheral support.
3.
CLOUDBRIDGE SYSTEM
CloudBridge contains two major entities: an user appli-cation for smart devices and a daemon running on a cloud server. In our system, the bidirectional TCP bridge lying between two entities is the key component. Through this bridge, the user application can control the networked pe-ripherals with the help from the cloud server.
3.1
Operations
CloudBridge consists of 9 steps of operations between a CloudBridge user application, a server daemon, and a printer as illustrated in Figure 2. (1) A smart device broadcasts a discovery request to all hosts on the same subnet or sends query directly to an IP designated host. (2) On receiving the query, printers send responses back containing their device information. (3) On receiving the responses, the application asks the user to select a printer and a file to print, and (4) de-livers them all together to the cloud server. (5) On receiving the file and the printer information, the daemon first checks the file type. If the file type is of advanced applications, the
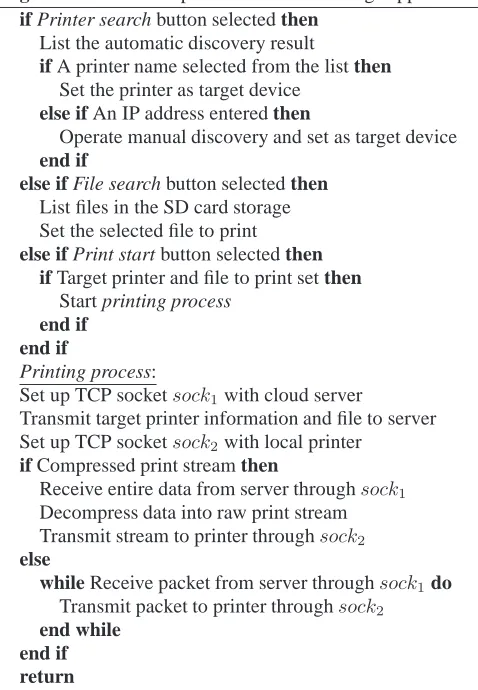
Algorithm 1 Pseudo operations of CloudBridge application if Printer search button selected then
List the automatic discovery result
if A printer name selected from the list then Set the printer as target device
else if An IP address entered then
Operate manual discovery and set as target device end if
else if File search button selected then List files in the SD card storage Set the selected file to print else if Print start button selected then
if Target printer and file to print set then Start printing process
end if end if
Printing process:
Set up TCP socketsock1with cloud server
Transmit target printer information and file to server
Set up TCP socketsock2with local printer
if Compressed print stream then
Receive entire data from server throughsock1
Decompress data into raw print stream
Transmit stream to printer throughsock2
else
while Receive packet from server throughsock1do
Transmit packet to printer throughsock2
end while end if return
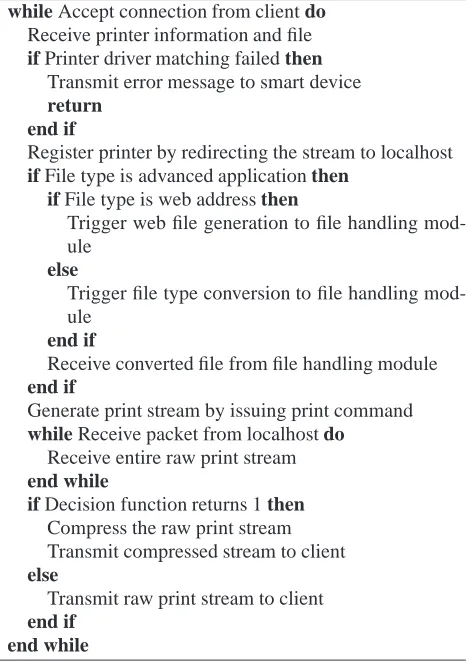
Algorithm 2 Pseudo operations of CloudBrindge daemon while Accept connection from client do
Receive printer information and file if Printer driver matching failed then
Transmit error message to smart device return
end if
Register printer by redirecting the stream to localhost if File type is advanced application then
if File type is web address then
Trigger web file generation to file handling mod-ule
else
Trigger file type conversion to file handling mod-ule
end if
Receive converted file from file handling module end if
Generate print stream by issuing print command while Receive packet from localhost do
Receive entire raw print stream end while
if Decision function returns 1 then Compress the raw print stream Transmit compressed stream to client else
Transmit raw print stream to client end if
end while
incident of paper jam, and pops instant feedback to the user. Besides that, the smart device also forwards printer errors to the cloud server and gets error interpretations back, similar to what the stream handling module does.
Algorithm 1 and Algorithm 2 summarize the work flow of the CloudBridge application and server, respectively.
3.2
System Architecture
Figure 3 shows the software architecture of two compo-nents, CloudBridge user application and server daemon.
(1) Smart device application.
• The user interface module collects user inputs
regard-ing target printer information, printregard-ing options (e.g., color, duplex), and the preferred performance metric (e.g., print time, energy consumption). This module also receives notification messages from the printer as well as the server (e.g., low toner, no paper) and in-terprets them in human-readable format. It basically communicates with the networking module to deliver all information.
• The networking module consists of two sub-modules,
peripheral discovery and data relay module. The dis-covery module uses well-known service disdis-covery
pro-tocols such as multicast-DNS (domain name system), DNS-SD (DNS-based service discovery), SSDP (sim-ple service discovery protocol) to find nearby printers, especially located in the same subnet. The module can extend its discovery boundary by specifying an pub-lic IP address of the target printer using SNMP (sim-ple network management protocol) queries. The data relay module is the key component to bridge packets between two end points. Whenever there are packets coming from one side, it extracts payloads from these packets and then forwards them to the other side. If the data is determined to be notification message, it passes it to the user interface module.
• The stream handling module verifies whether the
re-ceived stream is compressed or not. It selectively per-forms decompression only when the payloads are in the compressed form. Since the decision on compres-sion is made at the cloud server, this module passively decompresses the stream and returns raw print stream back to the networking module.
(2) Cloud server daemon.
• The networking module receives user information along
with a file to print from the user application. It passes them to stream handler to generate the corresponding print stream. When the file format requires type con-version or indicates a web page link, this module tosses the data to the file handling module. Once the print stream is ready from the stream handling module, it delivers the stream to the smart device.
• The stream handling module is the core part of the
CloudBridge daemon. Based on the printer informa-tion, it finds the matching driver in its database and generates the print stream with the options designated by the smart device user. Upon generation of the print stream, it makes decision on whether to compress the stream or not by applying a pre-trained decision func-tions based on the network bandwidth and the stream size. We further discuss about the compression deci-sion functions in Section 5.
• The file handling module intervenes only when the
Driver matching
Stream generation
Stream compression Stream Handler
Type conversion
Web file generation File Handler
Peripheral and file information Networking
Cloud Server Daemon
User input collection
Message notification User Interface
Compression checker
Stream decompression Stream Handler Peripheral discovery (Automatic, Manual)
Networking
Smart Device Application
TCP
Data relay bridge
TCP
Local Printer
mDNS, SNMP
Data transmission
Figure 3: System architecture of CloudBridge.
and fonts are not comparable with the one utilized the genuine application. Once the conversion is done, the converted file is delivered to the stream handling mod-ule which generates the print stream subsequently.
4.
SYSTEM VALIDATION AND ANALYSIS
In this section, we validate the feasibility of our system through extensive experiments using various Android smart devices (Samsung Galaxy S II, LG G2x, and HTC Evo Shift), two physical networked printers (HP LaserJet 4250, Brother 2270DW), a huge number of emulated printers from four major printer manufacturers, and a Linux server. Accord-ing to a recent article [8] regardAccord-ing the world printer market share as of 2011, the major manufacturers cover 80% of the market, i.e., HP 42.9%, Canon 18.1%, Epson 12.6%, and Samsung 5.7%. Motivated by this fact, we installed 680 HP, 131 Canon, 212 Epson, and 144 Samsung printer drivers, 1,167 in total, on the Linux server to gain the universality of the performance emulation results. For energy measure-ment, we use a Monsoon digital power meter [10] which can dump the power readings. The lowest reading interval 200
µs is used to get the most accurate measurement.
4.1
Operation Time Analysis
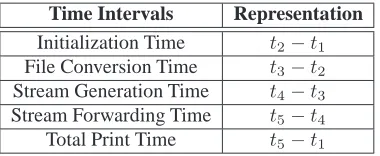
First, we evaluate the end-to-end operation time of the system. From the user’s point of view, the operation time that she may go through using the system might be the most important performance metric. Analyzing time portion taken by different operations helps identify the performance bot-tleneck of the system. We split the total printing time into four time intervals as shown in Figure 2, and summarize them in Table 2.
Initialization time stands for the time taken transmitting the file and printer information from the user application to the server. File conversion time denotes the consumed con-verting an advanced file format to a basic one, triggering the type conversion module running on a virtualized Windows machine. Note that the file conversion time is optional for
Time Intervals Representation
Initialization Time t2−t1
File Conversion Time t3−t2
Stream Generation Time t4−t3
Stream Forwarding Time t5−t4
Total Print Time t5−t1
Table 2: Time intervals for sub-procedures indicated in Figure 2.
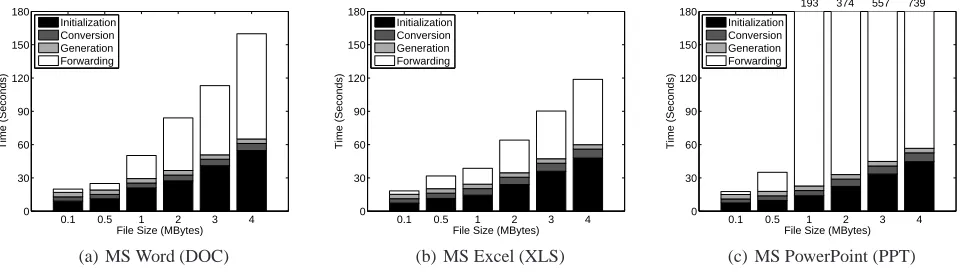
advanced formats. Stream generation time is measured from the moment when a print command is committed until the server finishes generating a complete print stream. Stream forwarding time starts when the first stream packet is sent by the server until the printer has received the last packet. We first present results using physical printers excluding com-pression technique, and then extend the experiment to over 1,000 printers for both cases with and without compression. Figure 4 and 5 show the time distribution of sub-procedures measured for the basic and advanced formats, respectively. The initialization and forwarding time for both cases are lin-early increasing along with the file size. This is intuitive as these two metrics are pure network transfer time which is highly dependent on the data size assuming the network condition remains stable. From the fact that the stream for-warding usually takes longer time than the initialization, we can infer that the print stream size becomes much larger than the original file in most cases. This finding motivates our ap-proach to introduce the data compression, which is discussed in detail in Section 5.
0.1 0.5 1 2 3 4 0
30 60 90 120 150 180
File Size (MBytes)
Time (Seconds)
Initialization Generation Forwarding
203
(a) Text (TXT)
0.1 0.5 1 2 3 4
0 30 60 90 120 150 180
File Size (MBytes)
Time (Seconds)
Initialization Generation Forwarding
237
(b) Portable Document Format (PDF)
0.1 0.5 1 2 3 4
0 30 60 90 120 150 180
File Size (MBytes)
Time (Seconds)
Initialization Generation Forwarding
(c) PostScript (PS)
Figure 4: Time distribution of sub-procedures for basic file types. For text and PDF files, forwarding time is the bottleneck while initialization time is the most critical portion for PS file type.
0.1 0.5 1 2 3 4
0 30 60 90 120 150 180
File Size (MBytes)
Time (Seconds)
Initialization Conversion Generation Forwarding
(a) MS Word (DOC)
0.1 0.5 1 2 3 4
0 30 60 90 120 150 180
File Size (MBytes)
Time (Seconds)
Initialization Conversion Generation Forwarding
(b) MS Excel (XLS)
0.1 0.5 1 2 3 4
0 30 60 90 120 150 180
File Size (MBytes)
Time (Seconds)
Initialization Conversion Generation Forwarding
193 374 557 739
(c) MS PowerPoint (PPT)
Figure 5: Time distribution of sub-procedures for advanced file types. Stream forwarding time highly increases espe-cially for PPT files as the file size increases, due to the complicated graphics.
the print stream format, the stream size turns out to be almost the same as the original file.
From the results, we conclude that the stream forward-ing time dominantly determines the user experience on total printing time. As we pointed out previously, the forwarding time is affected by the generated stream size and the network condition. Next, we investigate which factors impact on the stream size.
4.2
Stream Size Analysis
We define a term inflation factor (IF) as the ratio between the size of the generated print stream and the original file. We focus on two major factors determining IF value, file for-mat and printer type, and quantify their impacts on IF values in various settings.
4.2.1
IF vs. File format
Continued from the experiment presented in Figure 4 and 5, we measure the correlation between the size of the gener-ated stream and the original file for each format. We ob-serve that TXT files give strong correlation coefficient of 0.99 while the average IF is around 10. This is intuitive since the TXT format is simple enough that the interpreta-tion overhead may monotonically increase as the file size
increases. PDF files give quite low correlation coefficient of 0.29 with average IF of 3. This is due to the fact that PDF format may contain many graphics which are not aligned, thus lead to various stream sizes that are unpredictable. The unpredictability of IF value increases when the file includes various type of contents other than texts. In other words, IF value shows diversity depending on the file format as well as the contents of the file itself.
4.2.2
IF vs. Printer type
To generalize the IF values for various printers, we em-ulate 1,167 printers whose drivers are installed in the cloud server. Figure 6 shows CDFs (cumulative distribution func-tion) of IF values for various cases using printers from ma-jor manufacturers. From the results using 1 KB RFC TXT file as input illustrated in Figure 6(a), we observe that IF values are typically large. Only 20% of printers show IF values less than 10, while more than 40% show IF values
larger than 100. We also verify that small IF values (∼10×)
mostly come from printers utilizing PCL6, since it adopts more compact commands than the previous versions. On
the other hand, higher IF values (∼100×and over) result
100 101 102 103 0
0.2 0.4 0.6 0.8 1
x (Inflation factor)
F(x)
HP (680, avg 177X) Canon (131, avg 180X) Epson (212, avg 131X) Samsung (144, avg 84X) All (1167, avg 157X)
(a) TXT file w/o compression
100 101 102
0 0.2 0.4 0.6 0.8 1
x (Inflation factor)
F(x)
HP (680, avg 18X) Canon (131, avg 6X) Epson (212, avg 6X) Samsung (144, avg 7X) All (1167, avg 13X)
(b) PS file w/o compression
100 101 102 103
0 0.1 0.2 0.3 0.4 0.5 0.6 0.7 0.8 0.9 1
x (Inflation factor after compression)
F(x)
HP: CR=1/5.9 Canon: CR=1/8.2 Epson: CR=1/16.1 Samsung: CR=1/9.5 All: CR=1/6.4
(c) TXT file w/ compression
Figure 6: CDFs of inflation factor for various cases. (a) IF for TXT file can be categorized into three groups: small(∼10×), medium(∼100×) and large(∼200, 300×) IF. 50% of the printers generate streams∼100×larger than the original size. (b) The average IF for PS file is smaller than that of TXT. Over 80% of the printers generate streams less than∼10×of the original size. (c) Reduced IF by applying the PPM compression to the same TXT file used in (a).
and lower). They are originally designed to convert a file into a raster image which expresses contents using bit se-quences. The difference comes from the characteristics of the printer languages that the higher PCL version renders ob-jects as vectors whereas the lower PCL version records the location of dots. However, one should note that the higher version of PCL not always guarantee low IF, according to a technical report from HP [7].
Figure 6(b) shows another experiment using PS format as input, which gives lower average IF values compare to TXT case. Over 80% of the printers generate print streams
smaller than 10×of the original size. Based on our
observa-tion, print streams generated from PS files have low IF due to the nature of file format which relies on a printer-friendly language. This result accords closely to the previous obser-vation shown in Figure 4(c).
5.
SYSTEM OPTIMIZATION
Recall that our objective is to enable printing from smart devices, but the large IF values limit the practicality of the system. To further optimize the performance, we consider to apply compression to the print stream. However, selecting a compression technique is not straightforward. To identify a compression scheme that best fits the print stream, we first analyze the characteristics of the stream.
To begin with, we delve into the structure of the data com-pression. Most of the data compression algorithms consist of at least a model and a coder with optional preprocess-ing transforms when needed. A model estimates the prob-ability distribution of the appearance of symbols in the in-puts. Usually this is expressed as a sequence of predictions of successive symbols (e.g., bits, bytes, or words) in the in-put sequence given the previous inin-put as context. When the compressor passes the prediction and symbol to the coder, it assigns shorter codes to the more likely symbols to minimize the output file size.
Among various lossless compression techniques in the
lit-erature, PAQ [17] is a series of open source data compres-sion schemes that have top ranked on several benchmarks measuring compression ratio at the expense of compression speed and memory usage. Especially, the very slow com-pression speed is the representative drawback of PAQ, and this is due to its bitwise operation. PAQ uses a context mix-ing algorithm that predicts the next symbol usmix-ing a weighed combination of probability estimates from a large number of models conditioned on different contexts, which contributes to the high compression ratio. PAQ utilizes several models such as picture (bitmap image), record (2-dimensional data), word (English text), and DMC (Dynamic Markov Compres-sion) model. These models are given different weights de-pending on the relevance with input file types.
To verify which model can represent the characteristic of print stream, we analyze the weight proportion of every model utilized in PAQ for the print stream. The conclusion we get from the experiment is that in most cases DMC model is dominant and picture model follows the next. To reduce the compression overhead using PAQ, one alternative is to select some models that fit well for the print stream instead of applying all models supported by PAQ. Based on our find-ings, DMC model seems to be a good option.
Dynamic Markov Compression (DMC) [16] uses statisti-cal model and predictive arithmetic coding. The predictor utilizes a table of variable length bit level contexts that map
to a pair of countsn0andn1. It predicts the next bit with
probabilityn1/(n0+n1)and updates by incrementing the
corresponding count. DMC has a good compression ratio but requires large memory space and is not widely imple-mented. It predicts and codes one bit at a time similar to PAQ, which also results in slow compression speed.
0 10 20 30 40 50 0
2 4 6 8 10
Print stream size (MBytes)
Compression time (Seconds)
(a) Compression time (tc)
0 10 20 30 40 50
0 10 20 30 40 50
Print stream size (MBytes)
Decompression time (Seconds)
(b) Decompression time (td)
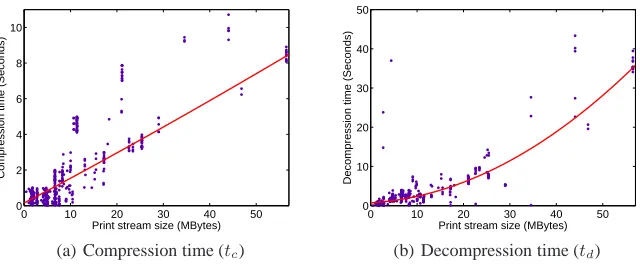
Figure 7: Measured operation time and their polynomial regression functions. For an arbitrary stream sizex, a Linux server with Intel Quad-core i7 CPU givestc = 1.45e−4x2+ 0.1379x+ 0.1464, and Samsung Galaxy S II showstd =
9.51e−3x2+ 7.26e−2x+ 0.7218.
Variable Meaning
x Generated print stream size (MB)
Bd Downlink bandwidth (Mbps)
xc Compressed print stream size (MB)
tc Compression time on the server (second)
td Decompression time on Android (second)
Table 3: Parameters and their units used in decision function modeling. We considerxand Bd as
indepen-dent variables and model others using the indepenindepen-dent variables.
context mixing utilized by PAQ in that there is only one con-text model per prediction. Additionally, PPM is theoretically proven to be optimal in the compression ratio [14,15,18,19]. Based on these learnings, we choose PPM algorithm.
Figure 6(c) presents the IF values for the same file used in Figure 6(a) after applying PPM compression. On aver-age, we get a compression ratio of 10 which indicates that the stream size is reduced to 1/10. Beneficial from the high compression ratio, only 30% out of 1,167 printers have IF
values of 20×or more after compression. Despite of the
obvious benefit, compression of print stream could also de-grade the performance since compression as well as decom-pression take time and the decomdecom-pression on a smart device is computation-intensive operation leading to high energy consumption.
5.1
Decision Function Design
To determine whether to compress the stream or not, we design a decision function being operated at the cloud server. The decision function is designed to optimize user experi-ence in terms of the total print time and the energy con-sumption on a smart device based on the parameters listed in Table 3. We model each of the parameters using a few in-dependent variables and create decision criteria for the print time and the energy consumption.
We model the compression timetc at a cloud server and
the decompression time td at a smart device. Figure 7(a)
and 7(b) show the measurements from 100 experimental runs with various files. They also render the best fitting regres-sion equations of the results. We assume that the size of the
compressed streamxcbecomes0.5xon average. Note that
the compression ratio becomes smaller than the ratio shown in Figure 6(c), because of the limited capability of a PPM library for Android smart devices. The compression ratios shown in Figure 6(c) can be considered as upper bound.
5.1.1
Total print time
We form a decision function as Equation 1 based on the total operation time. The right side of the inequality inside the indicator function represents the time consumed when compression is applied, and the left side shows that without compression. Note that the time for common sub-procedures, e.g., initialization and stream generation, are not considered. We further simplify it by applying regression equations for
tc,td, andxc, and get Equation 2. For a given stream size
x, when the downlink bandwidthBdis lower than the value
of0.5x/(0.020137x2
−0.11958x+ 2.188), compression is recommended. This implies that when the downlink band-width is high enough, transmitting the print stream without compression benefits in time as it eliminates the compres-sion and decomprescompres-sion time.
I
x Bd >
xc
Bd +tc+td
= (
1 : Compression
0 : No compression, (1)
whereI(·)denotes for the indicator function.
I
Bd< 0.5x
0.020137x2−0.11958x+ 2.188
= (
1 : Compression
0 : No compression.
(2)
The decision function and ground truth data from a large number of experimental runs are plotted in Figure 8(a). The
mark◦stands for the ground truth values where the
0 10 20 30 40 0
5 10 15 20 25
Print stream size (Mbytes)
Downlink bandwidth (Mbps)
Decision function: Operation time Ground truth w/ compression Ground truth w/o compression
(a) End-to-end operation time
0 10 20 30 40
0 5 10 15 20 25
Print stream size (Mbytes)
Downlink bandwidth (Mbps)
Decision function: Energy Ground truth w/ compression Ground truth w/o compression
(b) Energy consumption
0 10 20 30 40
0 5 10 15 20 25
Print stream size (Mbytes)
Downlink bandwidth (Mbps)
Decision function: Energy Decision function: Operation time
(c) Considering both
Figure 8: Decision functions based on (a) operation time only, (b) energy consumption only, and (c) both. (a)-(b) The mark◦stands for the ground truth value which performs better using compression, and×indicates the case with no compression scheme. (c) The experiment set is divided into three groups according to the two decision functions.
0 5 10 15 20
0 0.05 0.1 0.15
Tolerance (Seconds)
MSE (Mean Squared Error)
(a) End-to-end operation time
0 0.5 1 1.5 2 2.5 3
0 0.05 0.1 0.15
Tolerance (mWh)
MSE (Mean Squared Error)
(b) Energy consumption
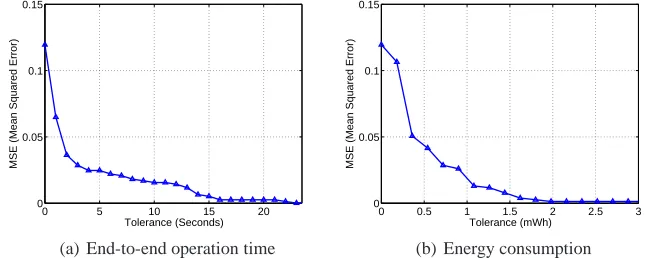
Figure 9: Mean squared error for the decision functions for two different criteria. (a) When users allow about 2 seconds of tolerance, the decision function gives over 95 % of accuracy. (b) If users can tolerate about 0.5 mWh of energy difference, the decision function makes only 4.1 % errors.
case. The◦ marks over the decision criteria line are
con-sidered as false negatives (FNs) and the×marks below the
criteria are regarded as false positives (FPs).
For practical evaluation of the decision function, we de-fine tolerance as a threshold value of the difference between the total print time with and without compression. We intro-duce this concept to mitigate the strictness determining FP and FN errors. For example, when the tolerance is 1 second, the ground truth data having less than 1 second of difference in total print time are not considered as error. Thus, 0 sec-ond of tolerance implies the conventional definition of FP and FN. Figure 9(a) shows the mean squared error (MSE) of our decision function for various tolerance values. When users allow 5 seconds of tolerance, it gives MSE of 0.024, meaning that the decision is correct for 97.6% of the trials.
5.1.2
Energy consumption on Android
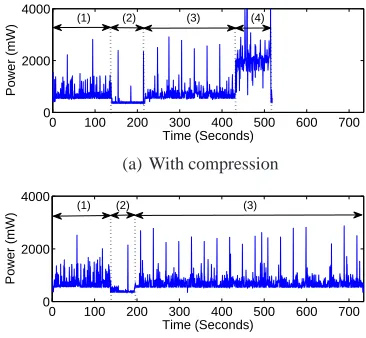
Here, we introduce another criterion in the decision func-tion, the energy consumption on a smart device. Figure 10 il-lustrates power measurement when running the CloudBridge application on Samsung Galaxy S II for both cases, with and without compression. An interesting thing is that the energy
Device Pi Pr Pd
Samsung Galaxy S II 415 mW 717 mW 2014 mW
LG G2x 315 mW 760 mW 963 mW
HTC Evo Shift 243 mW 574 mW 714 mW
Table 4: Average power level measured on three Android devices for idle state (Pi), data reception (Pr), and de-compression (Pd).
consumption of decompression is about three time higher than that of data reception. In this case, applying compres-sion may incur a great loss of energy compensating for short operation time. It is important to note that the power con-sumption values may vary for different models of smart de-vices as they use diverse processors and WiFi chipsets. Ta-ble 4 presents the average power level measured for three Android devices which shows diversity.
0 100 200 300 400 500 600 700 0
2000 4000
Power (mW)
Time (Seconds) (1) (2) (3) (4)
(a) With compression
0 100 200 300 400 500 600 700 0
2000 4000
Power (mW)
Time (Seconds) (1) (2) (3)
(b) Without compression
Figure 10: Power consumption measured on the Android device, Samsung Galaxy S II. (a) Operation with com-pression is divided into 4 sequences: (1) file transmission, (2) idle, (3) stream reception, and (4) decompression. (b) Operation without compression takes longer time receiv-ing the stream.
Equation 4, which determines compression depending onBd
andx.
I
x
Bd Z
Pr(t)dt > xc Bd
Z
Pr(t)dt+tc Z
Pi(t)dt
+td Z
Pd(t)dt
= (
1 : Compression
0 : No compression.
(3)
I
Bd< 350x
34.76596x2−173.5292x+ 2991.62
= (
1 : Compression
0 : No compression.
(4)
The decision function in Figure 8(b) suppresses compres-sion compare to Figure 8(a), since the decomprescompres-sion on An-droid consumes higher energy than the data transfer. Fig-ure 9(b) shows the MSE for various tolerance values repre-sented in mWh. It implies that if a user can tolerate 0.5 mWh of energy difference, the decision function makes only 4.1% errors. Generally, 0.5 mWh corresponds to 0.01% of the to-tal battery capacity of a typical smart phone (5000 mWh).
5.2
Decision Making
We discuss about the decision making considering both criteria at the same time. When overlapping the decision functions together as shown in Figure 8(c), it classifies the
regions into three cases. WhenBdandxfall into the cases
included in the lowest or the highest region, the decision making becomes easy. Compression benefits by time and energy at the lowest region, whereas no compression bene-fits in the highest region. The region in the middle is
equivo-cal: compression benefits from the total print time, but may give penalty in terms of energy. This is due to the nature of print stream which gives large variance depending on other variables such as file format, file size, and printer type. To improve the quality of experience for the equivocal cases, users may indicate her preference on time and energy.
6.
CONCLUSION
In this paper, we propose a cloud-powered system, Cloud-Bridge enabling peripheral support on smart devices. To prove the concept, we focus on printing from smart devices. CloudBridge is universally applicable to all smart devices and all networked printers and is completely independent from personal computers. More importantly, it also provides indistinguishable experiences (i.e., quality of printouts) to smart devices users from that of conventional computers.
For practicality, we adopt decision functions to our sys-tem, optimizing performance metrics closely related to user experiences such as total print time and energy consump-tion in smart devices. Through extensive measurements and training from the measurement data, the decision functions are shown to provide accurate decisions on whether to com-press data or not with more than 95% of probability.
The CloudBridge system architecture relying on cloud servers for the intelligence of interpreting languages to communi-cate with peripherals has high flexibility and scalability by its nature. We expect our system architecture brings more practical solutions to smart devices helping such devices over-come functional limitations over conventional computers.
7.
REFERENCES
[1] Apple Inc., AirPrint.
http://www.apple.com/iphone/features/airprint.html. [2] Business Insider, Smartphone sales will dwarf PC
sales this year and reach a staggering 1.5 billion per year by 2016.
http://www.businessinsider.com/.
[3] Canalys, Smart phones overtake client PCs in 2011. http://www.canalys.com.
[4] Epson, Connect. http://www.epson.com. [5] Google, Cloud Print.
http://www.google.com/cloudprint. [6] HP, ePrint.
http://www.hp.com/ePrint.
[7] HP Support Document, Printing comparison of PCL 5 printers vs. HP Inkjet PCL 3 Plus printers.
http://h20000.www2.hp.com/bizsupport/.
[8] IDC, The worldwide hardcopy peripherals tracker. http://www.idc.com/tracker/showtrackerhome.jsp. [9] Kodak, Hero Printers.
http://www.kodak.com.
[10] Monsoon Solutions Inc., Power Monitor.
http://www.msoon.com/LabEquipment/PowerMonitor/. [11] PrinterShare, Mobile Printing.
[12] Samsung, MobilePrint. http://www.samsung.com.
[13] The Guardian, How the smartphone is killing the PC. http://www.guardian.co.uk/technology/.
[14] I.-C. K. Chen, J. T. Coffey, and T. N. Mudge. Analysis of branch prediction via data compression. ACM
SIGOPS Operating Systems Review, 30:128–137,
December 1996.
[15] J. Cleary and I. Witten. Data compression using adaptive coding and partial string matching.
Communications, IEEE Transactions on,
32(4):396–402, April 1984.
[16] G. V. Cormack and R. N. S. Horspool. Data compression using dynamic markov modelling. The
Computer Journal, 30(6):541–550, 1987.
[17] M. Mahoney. Adaptive weighing of context models for lossless data compression. In Florida Tech.
Technical Report CS-2005-16, 2005.
[18] A. Moffat. Implementing the ppm data compression scheme. Communications, IEEE Transactions on, 38(11):1917–1921, November 1990.