BLIND BLAST SIMULATION: A VALIDATION EFFORT ASSESSMENT
Leonard E Schwer
Owner, Schwer Engineering & Consulting Services, USA
ABSTRACT
An international group of volunteers, from 11 countries, provided ‘blind’ predictions of blast loaded concrete slabs. There were a total of 54 entries in two categories of concrete strength (normal and high) each of these strength categories was subdivide into analysis by singe degree of freedom or finite element modeling. While not organized as a validation effort – the blind prediction aspect of this effort is an essential part of any validation effort. This manuscript looks back at this effort to comment on how it differed from a validation effort, but more importantly, on the lost learning experience, not only for the participants but the numerical concrete analysis community, due to poor planning.
INTRODUCTION
As part of the “Blind Blast Simulation Contest1,” organized by the University of Missouri Kansas City, participants were invited to submit predictions of reinforced concrete slabs subjected to air blast loading. There were two classes of concrete: normal strength fc′ =5ksi
(34.5MPa) and high strength fc′ =15 ksi (103.5MPa). The normal strength concrete was reinforced with Number 3 Grade 60 steel bars with yield strength of 68ksi (469MPa). The high strength concrete was reinforced with Vanadium Number 3 bars with nominal yield strength of about 83ksi (572MPa). Each concrete slab design was subjected to two different air blast pulses with impulses of about 5.38 and 7.04 MPa-ms.
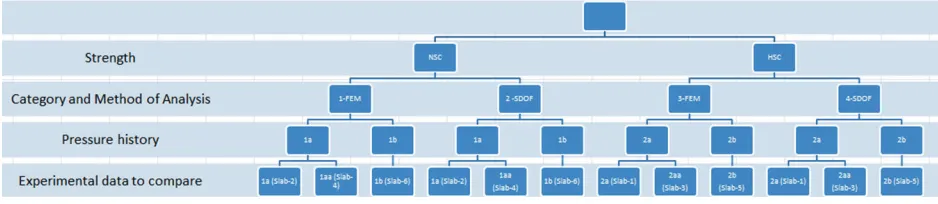
Participants could provide either nominal or high strength concrete predictions, or both. Model predictions could be provided with either Category 1: advanced modeling, e.g. finite element, or Category 2: analytical or single degree of freedom (SDOF) approaches; see Figure 1. The primary quantity to be predicted was the slab center deflection history, to include residual displacement. As a ‘tie breaker,’ graphics depicting the predicted slab damage were requested.
Figure 1 Categories of concrete strength and modeling types.
1
http://sce.umkc.edu/blast-prediction-contest/ (URL last checked 17 March 2015 – web site has been removed)
The focus of this presentation will be on assessing the Blind Blast Simulation as a validation effort. Observations on the overall activity to include: planning, description of the experiments, quality of the experimental results, reporting of the numerical results and comparisons of the results will be provided. Some specific references will be made to the finite element analysis results of the normal strength concrete category.
PLANNING
The planning for the Blind Blast Simulation Contest occurred well before participants were invited to take part in the contest. Since the effort was funded by the US National Science Foundation (NSF), it is assumed a grant was issued in response to a proposal submitted by the organizing committee. In addition to NSF, two American Concrete Institutive technical committees (370 & 447) supported the goals of the effort. The stated goals of the effort were:
• Predict, using simulation methods, the response of reinforced concrete slabs subjected to a blast load.
• Compare differences between single degree of freedom (SDOF) and finite element modeling (FEM) approaches
• Highlight the efficacy of available material models
• Promote the development of material models.
DESCRIPTION OF THE EXPERIMENTS
The laboratory experiments were conducted by the US Army Engineering Research and Development Center (ERDC) using a large air blast simulator. The facility is capable of simulating of a uniform air blast on the surface of targets (concrete slabs) with both positive and negative phases of the pressure. The instrumentation included:
• Pressure histories at six different locations around the target slabs,
• A central accelerometer and laser deflection measurement device on the back face to record deflections.
• Four high speed cameras were used to record the response of the slab.
• Posttest photographs of the damaged slabs.
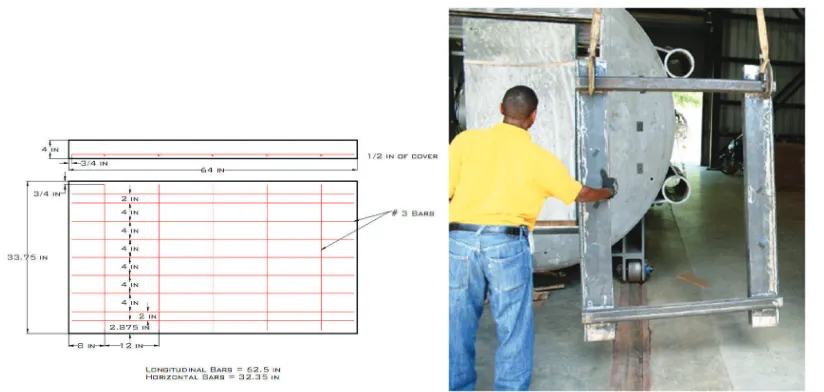
The posttest photo, see Figure 3, also showed what appeared to be two data recording instruments located at the quarter heights of the slab along the centerline. There is no mention of these instruments in the available description, but it was mentioned at some point that these were strain gauges.
Figure 2 Concrete slab and reinforcement geometry and modelling.
ERDC also performed the material characterization of the concrete and the steel reinforcement. The concrete characterization included:
• Pressure versus volume strain
• Triaxial compression stress difference versus axial strain at six confinements: 0, 10, 20, 100, 200, 400 & 600MPa
• Uniaxial strain stress difference versus axial strain and stress difference versus mean stress
Based on the above data, an estimate of the shear failure surface was also provided. Unfortunately, none of this data was available in digital form, so crude hand digitization was necessary for making constitutive model comparisons.
One critical omission from the characterization was the tensile strength of the concrete. This piece of data is critical because the main failure mode of the slab is tensile due to flexure, see Figure 2.
The material characterization of the steel reinforcement was an engineering stress versus strain curve; again not available in digital form.
QUALITY OF THE EXPERIMENTAL RESULTS
Figure 3 Post-test front surface cracking (left) and rear surface compression damage (right)
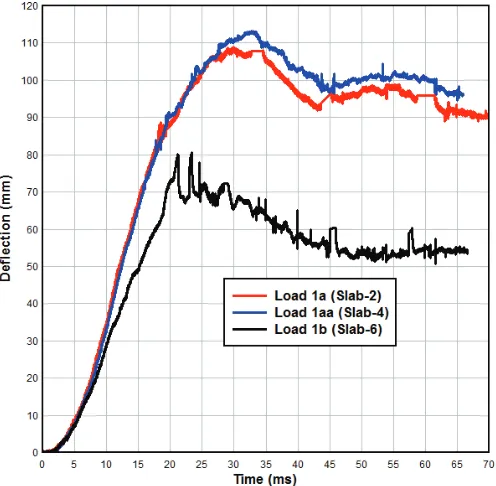
Figure 4 Measured slab central displacement histories for the two blast loadings.
REPORTING OF THE NUMERICAL RESULTS
for documentation was not honored by all participants. After the disclosure of the experimental data, a request was placed with the organizers for the reports from the other participants. The reply was that not all participants provided the requested documentation, and the available reports could not be redistributed because advance permission by the organizers had not been requested. There was no response to the request that after the fact permission be requested to share the participant reports.
COMPARISONS OF THE RESULTS
The stated criteria for assessing the predictions were:
• Maximum deflection
• Time at maximum deflection
• Residual deflection
No indication of the relative weighting of these three factors was provided.
A comparison of the results was presented by Professor Ganesh Thiagarajan, the principal organizer of the Blind Blast Simulation Contest, at a special session of the American Concrete Institute Convention on 22 October 2013 in Phoenix Arizona. The ‘details’ of the comparisons consisted of displacement histories as shown in Figure 5 for the case where there were two repeat experiments, i.e. the red and green lines. There was no indication of why so many of the predictions differed significantly from the experimental results – only an indication of the designated ‘winners;’ color lines with circle symbols In terms of maximum displacement, the relative error between the predictions and repeat experiments ranged from an under prediction of 38% to an over prediction of 99%.
The contest ‘winners,’ and select others, were invited to present their results at the ACI special session. These presentations could have been more informative, but the time allotted for the presentation was only 15 minutes and the often lively discussion was terminated before completion by the session chair. In an effort to learn more from the presenters’ efforts, the four that used the same software were asked to share their models. The two from universities refused or did not reply. The two from industry shared their input files. The two shared models both had constitutive errors that when corrected made their comparison with the experimental results less ‘accurate’ than with the errors. The errors were:
• Use of engineering stress-stain for the rebar material characterization, rather the true stress versus true strain required for the software. This also included allowing for tensile failure strain greater than the maximum present in the reinforcement characterization.
• Concrete tensile failure criterion based on values of fracture toughness and crack opening displacement that differed from those available in the CEB. Recall, the tensile strength was not part of the concrete characterization data.
None of the participants in the ACI special session mentioned performing mesh refinement, nor mesh regularization that is required when constitutive models include damage or failure.
SUMMARY
Review of the original goals and their possible achievement:
1. Predict, using simulation methods, the response of reinforced concrete slabs subjected to a blast load.
2. Compare differences between single degree of freedom (SDOF) and finite element modeling (FEM) approaches
3. Highlight the efficacy of available material models 4. Promote the development of material models.
Goal #1 – while predictions were made, it is difficult to say this goal was successfully achieved, e.g. the first principals (FEA) predictions had relative errors varying between -38% and 99%.
Goal #2 – During the ACI special session, the corresponding results from single-degree-of-freedom (SDOF) simulations were presented. While no direct SDOF and FEA comparisons were presented, it appeared the SDOF models performed better. It is not too surprising that such SDOF models do well, as they are typically calibrated, at least in part, to similar experiments. An interesting observation, those that did well in the FEA simulations also typically submitted a SDOF result. The possible implication here is based on their SDOF prediction; they tuned their FEA models to provide similar displacement history results.
Goal #3 – Since there was no identification of which displacement history result corresponded with which material model, yet alone software, this goal was not met.
At a minimum, any validation effort has two components: the quality of the experiments and the correctness of the models – note not accuracy of the models. A model may be incorrect and still produce a result that agrees with an experiment (accurate).
To examine the quality of the experimental results, repeat data is desirable and internal consistence of the data, e.g. strains and displacements are consistent. As mentioned above, while having two repeat tests is better than no repeats, it is not adequate for validation efforts where three repeat tests are optimal. Also, the lack of experimental error assessment is required. Finally, the lack of any other metric, e.g. the apparently unreported strain measurements on the slabs, means that a model could do well in displacement comparisons, but poorly for an ancillary measurement. Validation attempts to assure that the right answer was obtained for the right reason.
To examine the correctness of the models there are three basic options:
1. Compare multiple, but different, items with those measured in the experiment, e.g. slab displacement and strains on the surface.
2. Independent checks of the model particulars, e.g. inputs and assumptions.
3. Model-to-model comparisons – similar to Item 1 above but using outputs from different models of the same problem.
Without the availability of all the data and models, to all interested participants, there is almost nothing to be learned from this effort – there are data and model results and no explicit connection between the two.