78: 6–12 (2016) 135–142 | www.jurnalteknologi.utm.my | eISSN 2180–3722 |
Jurnal
Teknologi
Full Paper
AN
ACTIVITY
PREDICTION
MODEL
USING
SHAPE-BASED
DESCRIPTOR
METHOD
Hentabli Hamza
*, Naomie Salim, Faisal Saeed
Faculty of Computing, Universiti Teknologi Malaysia, 81310 UTM
Johor Bahru, Johor, Malaysia
Article history Received 1 March 2016 Received in revised form
24 May 2016 Accepted 1 June 2016
*Corresponding author
[email protected]
Graphical abstract
Abstract
Similarity searching, the activity of an unknown compound (target) is predicted through the comparison of an unknown compound with a set of known activities of compounds. The known activities of the most similar compounds are assigned to the unknown compound. Different machine learning methods and Multilevel Neighborhoods of Atoms (MNA) structure descriptors have been applied for the activities prediction. In this paper, we introduced a new activity prediction model with Shape-Based Descriptor Method (SBDM) .Experimental results show that SBDM-MNA provides a useful method of using the prior knowledge of target class information (active and inactive compounds) of predicting the activity of orphan compounds. To validate our method, we have applied the SBDM-MNA to different established data sets from literature and compare its performance with the classical MNA descriptor for activity prediction.
Keywords: Bioactive Molecules, Multilevel Neighborhoods of Atoms, Shape-based
Descriptors, Activity prediction model
© 2016 Penerbit UTM Press. All rights reserved
1.0 INTRODUCTION
Due to the similar property principle [1], structurally similar compounds are predicted to exhibit similar properties and biological activities. This principle is exploited for discovery of new drugs with the emergence of an activity prediction technology based on chemical structures. A variety of computational approaches for activity prediction or target has been published over the past several years. For example, Quantitative structure activity relationship (QSAR) [2]–[6] was established on the
hypothesis that compounds with similar
physicochemical properties and/or structure share similar activities. The effectiveness of the QSAR analysis relies both on selecting the relevant descriptors for modeling the biological activity of interest and on the choice of a good quantitative model that maps the compound descriptors to chemical property or biological activity by means of statistical techniques [3], [4].
In similarity searching strategy, an unknown compound (target) is compared to a set of compounds with known activities. The known activities of the most similar compounds are assigned to the unknown compound. Despite the fact that the target prediction approaches exhibit several successes but some issues still need to be addressed. In many studies, different approaches predict different subset of targets for the same compound [7]–[12].
Some of the popular machine learning methods that have been applied for activity prediction (target) by compound classification are the Binary Kernel Discrimination (BKD) [13], [14], Naıv̈e Bayesian Classifier (NBC) [15], Artificial Neural Networks (ANN) [16]–[18] and the Support Vector Machine (SVM) [19]–[21]. Recently, the Bayesian belief network classifier is used for ligand-based target or activity prediction [22].
The MNA of a molecule was generated on the basis of connection table and table of atom types representing the compound. Each particular descriptor has a unique integer number according to the dictionary of the descriptors. The similarity between two molecules is calculated using Tanimoto coefficient and the activity of the unknown molecule is predicted by the activity of the most similar molecule.
Previously, Hentabli et al. [25]–[27] developeda new molecular descriptor, Language for Writing Descriptors of Outline Shape of Molecules (LWDOSM) and shape based molecular descriptor (SBDM), that have been inspired by researchers in information retrieval on the use of contour based shape descriptor for image retrieval systems [28] . Shape-based molecular descriptor is a new method used for obtaining the rough description of 2D molecule structure from the 2D outline shape of its 2D diagram. The mentioned descriptor is a textual descriptor that allows rigorous structure specification via a very small and natural grammar. Experiments in ligand-based virtual screening method used SBDM for similarity searching. Experiments with a subset of the MDDR database demonstrated that the SBDM provided an interesting alternative to existing tools for ligand-based virtual screening. It substantially outperformed a conventional Tanimoto-based similarity searching system when the active molecules have a high degree of structural homogeneity. In this paper,we introduce a new tool for activity prediction model using SBDM and MNA. The SBDM-MNA provides a useful method of using the prior knowledge of target class information (active and inactive compounds) to predict the activity of orphan compounds. To validate our method, we applied this SBDM-MNA on different established data sets from literatures and compare its performance with the classical MNA descriptor for activity prediction.
2.0 MATERIALS AND METHODS
The new descriptor SBDM [25], [26] is a textual descriptor that uses printable characters to represent molecules based on their shapes. The outline shape (for the whole molecule) and the internal region (inside molecule rings) are exploited to calculate a rough description of the 2-D structure molecule. The proposed method uses a connection table to extract the information needed to represent the molecule shape. A specific language has been developed to describe the shape features; descriptors written in this language are invariants to scale change and rotation. SBDM is a true language, albeit with a simple vocabulary (atom and bond symbols) and few grammar rules. However, part of the power of the SBDM is that it is highly sensitive to molecular structure changes.
2.1 Multilevel Neighborhoods of Atoms (MNA)
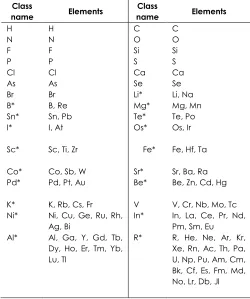
MNA structure descriptors of molecules [23] are generated on the basis of connection table and atom types expressive the compound. Connection table contains data on the covalent bonds in a molecule. Various bond types are not specified (topological approximation). All hydrogen based on valences and partial charges of atoms are taken into account. Atom types are specified according to the data presented in Table 1.
Table 1 Classification of different atom types used in calculation of descriptors
Class
name Elements
Class
name Elements
H H C C
N N O O
F F Si Si
P P S S
Cl Cl Ca Ca As As Se Se Br Br Li* Li, Na B* B, Re Mg* Mg, Mn Sn* Sn, Pb Te* Te, Po I* I, At Os* Os, Ir Sc* Sc, Ti, Zr Fe* Fe, Hf, Ta Co* Co, Sb, W Sr* Sr, Ba, Ra Pd* Pd, Pt, Au Be* Be, Zn, Cd, Hg K* K, Rb, Cs, Fr V V, Cr, Nb, Mo, Tc Ni* Ni, Cu, Ge, Ru, Rh,
Ag, Bi
In* In, La, Ce, Pr, Nd, Pm, Sm, Eu Al* Al, Ga, Y, Gd, Tb,
Dy, Ho, Er, Tm, Yb, Lu, Tl
R* R, He, Ne, Ar, Kr, Xe, Rn, Ac, Th, Pa, U, Np, Pu, Am, Cm, Bk, Cf, Es, Fm, Md, No, Lr, Db, Jl
The structure of the molecule is represented as the set of MNA descriptors calculated iteratively. The Zero-level's descriptor is presented by the type of atom according to Table 1 and special dash label if the atom is not included into the cycle. If the atom is included in the cycle, the dash label is absent. The descriptor of the first level includes the atom's zero-level descriptor of its neighboring atoms, sorted lexicographically. This process is continued iteratively covering 2nd, 3rd and nth neighborhood of the atoms.
Examples of structure presentation by zero, first and second levels MNA descriptors for the phenol's molecule are shown in Figure 1.
A set of MNA descriptors for a molecule are generated recursively:
added to the descriptor of zero level if the atom is not included in the cycle as show in Figure 1.
Figure 1 Representation of phenol by the MNA descriptors of the zero level (MNA/0)
2- The descriptor of each successive level is a concatenation of the zero-level descriptor of the atom while enclosed in parentheses is a lexicographically ordered list of descriptors of the previous level of its nearest neighbors as illustrate in Figure 2 below.
Figure 2 Representation of phenol by the MNA descriptors of the first and second levels (MAN/1, MNA/2)
2.2 Prediction using MNA
Generally, at some point in the iteration process, the classical MNA descriptor may cover the molecule completely. However, the experiments show that the utilization of MNA descriptors of the first and second levels give best accuracy for property prediction [23]. Such MNA descriptors are generated for each structure from the data set. Each particular descriptor
has a unique integer number according to the descriptors’ dictionary.
2.3 Calculation of Similarity using MNA
In [23] they modified the Tanimoto coefficient to take into account the different frequencies of descriptors. The similarity between two molecules, A and B, is given by
where A(i) and B(i) are the counts of different frequencies of descriptor in the molecules A and B, respectively, and M is the total number of various descriptors in the dictionary.
3.4 SBDM-MNA
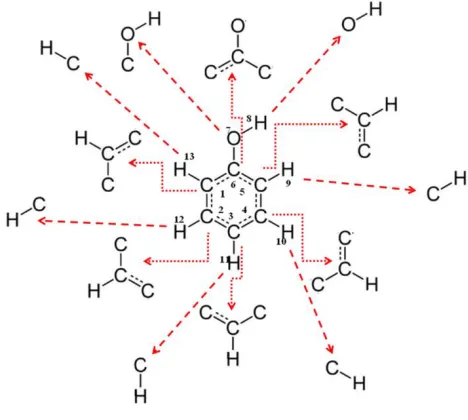
The main idea of the work proposed in this paper is to apply a new hybrid method for biological activities prediction between the Multilevel Neighborhoods of Atoms (MNA) algorithm and the shape based molecular descriptor (SBDM). The process of generating SBDM-MNA of any molecule first starts with applying the MNA first level to decompose the molecule in atoms and their neighboring atoms and then to apply the SBDM descriptor for describing each part from the whole molecule based on the rule of SBDM descriptor as illustrated in Figure 3.
For each atom extracted using the previous step, we apply the SBDM descriptor to determine the center atom in the part of molecule graph. Then we move in a clockwise direction to the next atom. The bond type and direction of the movement are represented before we visit and represent the next atom. This procedure is repeated until the initial atom is revisited. Once the starting atom is revisited, then the description of the outline shape of the molecule graph is completed as presented in s Figure 4. However, the process of generating the SBDM is composed of a number of specification rules explained next.
Figure 4 external visiting movements in a 2D graph of the 1st atom
The language used for writing the SBDM descriptor consists of a series of characters and symbols. There are three generic encoding rules corresponding to the specification of atoms, bonds and direction angle. Some of these rules are similar to the rules used in SMILES strings [26] Atoms are represented by their atomic symbols, usually two characters. The second character of the atomic symbol must be entered in lower case. For atomic symbols with just one letter, we add a blank space at the end of each atomic symbol, e.g., "Br", "C1","N "and “O". The single, double, and triple bonds are represented by the symbols "-", "=", and "#", respectively.
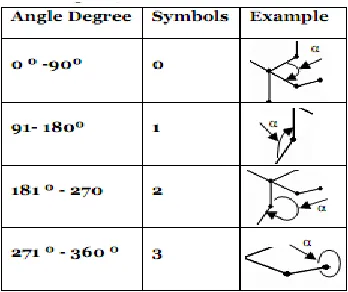
The direction of angle of the molecule shape boundary can be calculated using four directions ranging between 0 and 3 based on the value of the angle, as shown in Table 2.
Table 2 Angle directions representation
By applying the SBDM descriptor for each part of MNA part for the molecule in Figure 2 as show in next Table 3.
Table 3 SBDM-MNA calculation
Atom N name Atom SBDM-MNA
1 C C -0C =3C -2H -3C -2C -3 2 C C -0C =3C -2H -3C -2C -3 3 C C -0C =3C -2H -3C -2C -3 4 C C -0C =3C -2H -3C -2C -3 5 C C -0C =3C -2H -3C -2C -3 6 C C -0C =3C -2O -3C -2C -3 7 O O -0C =3C -2O -3C -2C -3 8 H O -1H -3
9 H C -1H -3 10 H C -1H -3 11 H C -1H -3 12 H C -1H -3 13 H C -1H -3
2.4 Data Sets
We evaluate the quality of our prediction model on different datasets that have been used to validate the classification of molecules based on structure-activity relationship. The three data sets described in Table 4 are taken from [9], [11] literature with compounds classified as active or inactive: cyclooxygenase inhibitors, ligands of the benzodiazepine receptor and ligands of the estrogen receptor (ER). These data sets have been used by literatures for validating prediction models [22], [25], [29].
Table 4 Summary of the different Data Sets
Data set
Number of compounds
Mean Pairwise similarity
active inactive active inactive
Cyclooxygenase-2 inhibitors 303 164 0.687 0.690 Benzodiazepine
receptor 306 99 0.536 0.538 Estrogen
receptor 141 252 0.468 0.456
The last two data sets (Tables 5-6) are taken from [30] and extensively used by many previous studies to validate ligand-based virtual screening approaches [22], [25]–[27], [29], [31], [32]. The data sets MDDR1 and MDDR2 contain 10 each for the homogeneous activity classes and heterogeneous ones.
Table 5 MDDR Activity Classes for DS1 Data Set
Activity Index
Activity class Active molecule s
Pairwise Similarity
07707 Adenosine agonists A1 207 0.229 07708 adenosine agonists A2 156 0.305 31420 renin inhibitors 1130 0.290 42710 CCK agonists 111 0.361 64100 monocyclic _-lactams 1346 0.336 64200 Cephalosporins 113 0.322 64220 Carbacephems 1051 0.269 64500 Carbapenems 126 0.260 64350 Tribactams 388 0.305 75755 vitamin D analogues 455 0.386
Table 6 MDDR Activity Classes for DS2 Data Set
Activity
Index Activity class Active molecul es
Pairwise Similarity
09249 muscarinic (M1) agonists 900 0.111 12455 NMDAreceptor antagonists 1400 0.098 12464 Nitricoxidesynthaseinhibitor 505 0.102 31281 dopaminehydroxylase
inhibitors
106 0.125
43210 aldose reductase inhibitors 957 0.119 71522 reversetranscriptase
inhibitors 700 0.103
75721 aromatase inhibitors 636 0.110
78331 cyclooxygenase inhibitors 636 0.108 78348 phospholipase A2 inhibitors 617 0.123
78351 lipoxygenase inhibitors 2111 0.113
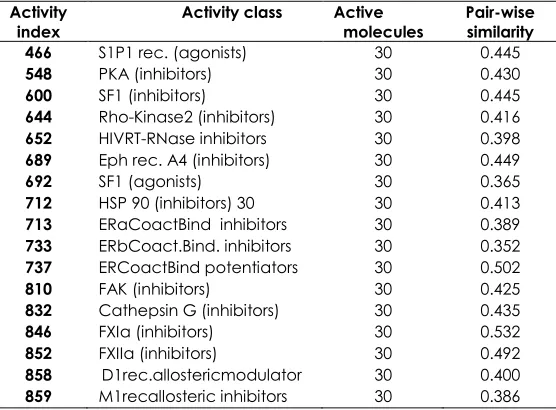
Table 7 MUV activity classes for MUV data set
Activity
index Activity class Active molecules Pair-wise similarity 466 S1P1 rec. (agonists) 30 0.445
548 PKA (inhibitors) 30 0.430
600 SF1 (inhibitors) 30 0.445
644 Rho-Kinase2 (inhibitors) 30 0.416
652 HIVRT-RNase inhibitors 30 0.398
689 Eph rec. A4 (inhibitors) 30 0.449
692 SF1 (agonists) 30 0.365
712 HSP 90 (inhibitors) 30 30 0.413
713 ERaCoactBind inhibitors 30 0.389
733 ERbCoact.Bind. inhibitors 30 0.352
737 ERCoactBind potentiators 30 0.502
810 FAK (inhibitors) 30 0.425
832 Cathepsin G (inhibitors) 30 0.435
846 FXIa (inhibitors) 30 0.532
852 FXIIa (inhibitors) 30 0.492
858 D1rec.allostericmodulator 30 0.400
859 M1recallosteric inhibitors 30 0.386
The third data set, (MUV) as shown in Table 7, was reported by Rohrer and Baumann [15]. This data set contains 17 activity classes, with each class containing up to 30 actives and 15,000 inactive. The diversity of the class for this dataset shows that it
contains high diversity or more heterogeneous activity classes.
2.5 Evaluation Measures
Ten-fold cross-validation was used to validate the results of SBDM-MNA and the SBDM and MNA. In this cross-validation, the data set was split into 10 parts; 9 were used for training and the remaining 1 for testing. This process was repeated 10 times; so all the compounds were used in the test set once. Thus, each activity class was tested against all the others. As in the case of other prediction methods, we used the area under the receiver operating characteristic curve (AUC) as quality criterion to quantify the performance of classification algorithms. The AUC is given as:
AUC=((sens+spec))/2 (2)
Where sens and spec are the sensitivity and specificity respectively, and given as:
sens=tp/((tp+fn) ) (3)
spec=tn/((tn+fp) ) (4)
Where tp, tn, fp and fn are numbers of true positives, true negatives, false positives, and false negatives, respectively. Where tp represents the number of active molecules selected in the active set and tn is the number of inactive molecules selected in an inactive set. While fp and fn represent the number of active molecules selected in inactive set and the number of inactive molecules selected in an active set respectively. An curve describes the trade-off between sensitivity and specificity, where the sensitivity and specificity are defined as the effectiveness of a model to identify positive and negative labels, respectively. The area under the curve (AUC) is a measure of the model performance: the closer to 1 the value is, the better the performance of the prediction.
We also used an accuracy (ACC) measurement to quantify the performance of the classification models. Accuracy is the overall effectiveness of the model and is calculated as the sum of correct classifications divided by the total number of classifications. This is shown in equation(5) as,
ACC=((tp+tn))/((tp+tn+fp+fn) ) (5)
3.0 RESULTS AND DISCUSSION
was compared with classical MNA on four different datasets. The prediction accuracy as well as the AUC of the prediction models on MDDR1, MDDR2, MUV and the different Dataset are demonstrated in tables’ number 8, 9, 10 and 11 respectively.
Table 8 AUC, and Accuracy Rates for the Prediction Models with the MDDR1 Data Set
MNA SBDM
Activity
index AUC ACC AUC ACC
7707 96.73 99.40 98.49 99.70 7708 97.69 99.70 98.68 99.80 31420 99.32 99.50 99.15 99.40 42710 94.93 99.50 98.62 99.80 64100 97.83 98.30 99.02 99.20 64200 70.93 96.40 70.28 96.40 64220 98.26 98.80 98.02 98.70 64500 87.39 98.70 95.12 99.50 64350 99.72 99.90 100.00 100.00 75755 59.57 86.80 63.91 88.20 Mean 90.24 97.70 92.13 98.07
Table 9 AUC, and Accuracy Rates for the Prediction Models with the MDDR2 Data Set
MNA SBDM
Activity
index AUC ACC AUC ACC
9249 95.41 98.20 96.96 98.80 12455 93.47 96.40 96.71 98.20 12464 84.85 96.60 84.22 96.40 31281 94.75 99.70 93.31 99.60 43210 94.18 97.60 94.41 97.70 71522 86.31 95.80 92.77 97.80 75721 95.41 98.70 96.35 98.90 78331 81.66 94.90 78.35 94.00 78348 81.49 95.00 82.88 95.40 78351 74.67 81.10 78.91 84.30 Mean 88.22 95.40 89.49 96.11
The results of the first dataset MDDR1 are presented in Table 8. These results show that the SBDM offered the highest sensitivity, specificity, AUC, and accuracy values compared to the classical MNA. However, the performance of SBDM was retreated in three activity classes from this dataset (renin inhibitors, Cephalosporins and carbacephems).
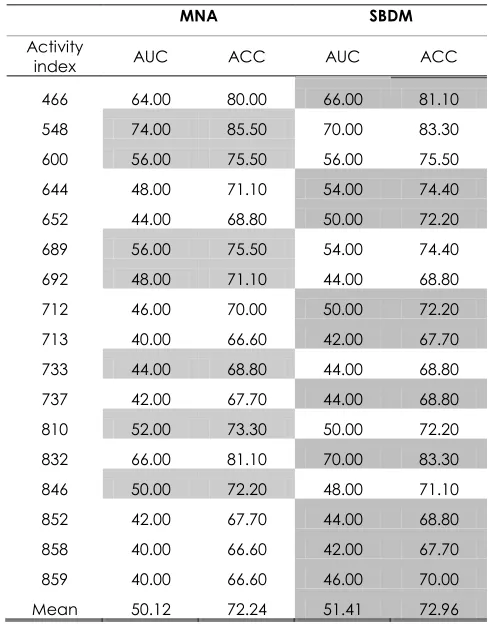
Table 10 AUC, and Accuracy Rates for the Prediction Models with the MUV Data Set
MNA SBDM
Activity
index AUC ACC AUC ACC 466 64.00 80.00 66.00 81.10 548 74.00 85.50 70.00 83.30 600 56.00 75.50 56.00 75.50 644 48.00 71.10 54.00 74.40 652 44.00 68.80 50.00 72.20 689 56.00 75.50 54.00 74.40 692 48.00 71.10 44.00 68.80 712 46.00 70.00 50.00 72.20 713 40.00 66.60 42.00 67.70 733 44.00 68.80 44.00 68.80 737 42.00 67.70 44.00 68.80 810 52.00 73.30 50.00 72.20 832 66.00 81.10 70.00 83.30 846 50.00 72.20 48.00 71.10 852 42.00 67.70 44.00 68.80 858 40.00 66.60 42.00 67.70 859 40.00 66.60 46.00 70.00 Mean 50.12 72.24 51.41 72.96
Table 11 AUC, and Accuracy Rates for the Prediction Models with the different Data Sets
MNA SBDM
Activity index AUC ACC AUC ACC
cyclooxygenase-2
inhibitors 95.10 95.30 96.19 96.30 benzodiazepine
receptor 91.11 91.20 93.40 93.50 estrogen receptor 89.88 92.10 87.47 90.20 Mean 92.03 92.87 92.35 93.33
The good performance of SBDM approach was not restricted to the first data set since this activity prediction model also perform best for the MDDR2 data sets (Table 7). The results in Table 9 showed that SBDM produced the best performance across seven activity classes in the MDDR2 data set. Nonetheless the performance of SBDM was not satisfying in 3 classes (nitric oxide synthase inhibitors, dopamine hydroxylase inhibitors and cyclooxygenase inhibitors). Since MDDR2 dataset is highly diverse than the previous dataset, the performance of SBDM is considered outstanding.
MDDR2), SBDM‘s prediction results were more convenient and applicable than the MNA results which proved the effectiveness of this new prediction method. Additionally, the results presented in table 10 of the different datasets revealed that the SBDM offered the highest AUC, and accuracy values compared to the classical MNA confirming the fact that SBDM is considered as an interesting and promising method for activity prediction.
It was clearly illustrated in Tables 8-11 and in the last row of each table that present the mean of each colonne, the efficiency of SBDM as new prediction method is clearly illustrated in Tables 8-11. While the classical MNA only deals with the short paths in detecting compounds, SBDM‘s developed features allows it to deal with longer paths along with identifying the bonds types of the molecule and calculating the divergence’s angle. SBDM prediction results revealed that it depends on the activity classes of the datasets whether they are highly diverse or not.Thus, it is still important to develop better prediction methods for high diversity activity classes. Therefore, SBDM is presented as a convenient new activity prediction method for target compounds.
4.0 CONCLUSIONS
The main aim of this study is to introduce the Shape-Based Descriptor Method (SBDM) as a new activity prediction approach for the unknown compounds. To test and prove the efficiency of SBDM, it is applied to different dataset and its performance is compared with classical MNA. The results of the experiments revealed that SBDM provides interesting prediction rates with short time calculation for activity prediction. These results also indicate that SBDM is particularly effective for homogeneous datasets rather than structurally heterogeneous ones. Thus, SBDM is presented as a convenient new activity prediction method for target compounds. However, the area the area is still open to develop better prediction methods for high diversity activity classes.
Acknowledgement
This work is supported by the Ministry of Higher Education (MOHE) and Research Management Centre (RMC) at the Universiti Teknologi Malaysia (UTM) under the Fundamental Research Grant
Scheme (FRGS) Category (VOT
R.J130000.7828.4F741).
References
[1] M. A. Johnson and G. M. Maggiora. 1990. Concepts And Applications Of Molecular Similarity. Wiley Interdiscip. Rev. Mol. Sci.
[2] C. L. Brace, J. L. Melville, S. D. Pickett, and J. D. Hirst. 2007. Contemporary QSAR Classifiers Compared. J. Chem. Inf. Model. 47(1): 219-227.
[3] F. R. Burden and D. a Winkler. 1999. New {QSAR} Methods
Applied to {Structure−Activity} Mapping and
Combinatorial Chemistry. J. Chem. Inf. Comput. Sci. 39(2): 236-242.
[4] D. Rogers and a J. Hopfinger. 1994. Application of Genetic Function Approximation To Quantitative Activity Relationships And Quantitative Structure-Property Relationships. J. Chem. Inf. Comput. Sci. 34: 854-866.
[5] W. P. Walters and B. B. Goldman. 2005. Feature Selection In Quantitative Structure-Activity Relationships. Curr. Opin. Drug Discov. Devel. 8(3): 329-333.
[6] J. J. Sutherland, L. a. O’Brien, and D. F. Weaver. 2004. A Comparison Of Methods For Modeling Quantitative Structure-Activity Relationships. J. Med. Chem. 47(22): 5541-5554.
[7] R. P. Sheridan and S. K. Kearsley. 2002. Why Do We Need So Many Chemical Similarity Search Methods? Drug Discov. Today. 7(17): 903-911.
[8] H. Ding, I. Takigawa, H. Mamitsuka, and S. Zhu. 2013. Similarity-based Machine Learning Methods For Predicting Drug-Target Interactions: A Brief Review. Brief. Bioinform. 15(5): bbt056–.
[9] C. Helma, T. Cramer, S. Kramer, and L. De Raedt. 2004. Data Mining And Machine Learning Techniques For The Identification Of Mutagenicity Inducing Substructures And Structure Activity Relationships Of Noncongeneric Compounds. J. Chem. Inf. Comput. Sci. 44(4): 1402-1411. [10] J. L. Jenkins, A. Bender, and J. W. Davies. 2006. In silico
Target Fishing: Predicting Biological Targets From Chemical Structure. Drug Discov. Today Technol. 3(4): 413-421.
[11] J. J. Sutherland and D. F. Weaver. 2004. Three-dimensional Quantitative Structure-Activity And Structure-Selectivity Relationships Of Dihydrofolate Reductase Inhibitors. J. Comput. Aided. Mol. Des. 18(5): 309-331.
[12] P. Chavatte, S. Yous, C. Marot, N. Baurin, and D. Lesieur, 2001. Three-dimensional Quantitative Structure-Activity Relationships Of Cyclo-Oxygenase-2 (COX-2) Inhibitors: A Comparative Molecular Field Analysis. J. Med. Chem. 44(20): 3223-30.
[13] G. Harper, J. Bradshaw, J. C. Gittins, D. V. S. Green, and A. R. Leach. 2001. Prediction of Biological Activity for High-Throughput Screening Using Binary Kernel Discrimination. J. Chem. Inf. Model. 1295-1300.
[14] P. Willett, D. Wilton, B. Hartzoulakis, R. Tang, J. Ford, and D. Madge. 2007. Prediction Of Ion Channel Activity Using Binary Kernel Discrimination. J. Chem. Inf. Model. 47(5): 1961-1966.
[15] X. Xia, E. G. Maliski, P. Gallant, and D. Rogers. 2004. Classification Of Kinase Inhibitors Using A Bayesian Model. J.Med.Chem. 47: 4463-4470.
[16] G. Schneider and P. Wrede. 1998. Artificial Neural Networks For Computer-Based Molecular Design. Prog. Biophys. Mol. Biol. 70(3): 175-222.
[17] J. J. Sutherland, L. a O. Brien, and D. F. Weaver. 2003. Spline-Fitting with a Genetic Algorithm : A Method for Developing Classification Structure - Activity Relationships. J. Chem. Inf. Model. 1906-1915.
[18] D. a Winkler and F. R. Burden. 2002. Application Of Neural Networks To Large Dataset QSAR, Virtual Screening, And Library Design. Methods Mol. Biol. 201: 325-367.
[19] Z. R. Yang. 2004. Biological Applications Of Support Vector Machines. Brief.Bioinform. 5(4): 328-338.
[20] K. Kawai, S. Fujishima, and Y. Takahashi. 2008. Predictive Activity Profiling of Drugs by Topological-Fragment-Spectra-Based Support Vector Machines. J. Chem. Inf. Model. 48(6): 1152-1160.
Ranking Methods, Kernel Functions, And Fingerprint Descriptors. J. Chem. Inf. Model. 49(3): 582-592.
[22] A. Abdo, V. Leclère, P. Jacques, N. Salim, and M. Pupin. 2014. Prediction Of New Bioactive Molecules Using A Bayesian Belief Network. J. Chem. Inf. Model. 54(1): 30-36. [23] D. Filimonov, V. Poroikov, Y. Borodina, and T. Gloriozova. 1999. Chemical Similarity Assessment through Multilevel Neighborhoods of Atoms: Definition and Comparison with the Other Descriptors. J. Chem. Inf. Comput. Sci. 39(4): 666-670.
[24] I. I. Baskin, N. I. Zhokhova, V. a Palyulin, a N. Zefirov, and N. S. Zefirov. 2009. Multilevel Approach To The Prediction Of Properties Of Organic Compounds In The Framework Of The QSAR/QSPR Methodology. Dokl. Chem. 427(1): 172-175.
[25] H. Hentabli, F. Saeed, A. Abdo, and N. Salim. 2014. A New Graph-Based Molecular Descriptor Using The Canonical Representation Of The Molecule. Sci. World J.
[26] H. Hentabli, N. Salim, A. Abdo, and F. Saeed. 2012. LWDOSM : Language for Writing Descriptors. Adv. Mach. Learn. Technol. Appl. Springer Berlin Heidelb. 247-256. [27] H. Hentabli, N. Salim, A. Abdo, and F. Saeed. 2013.
LINGO-DOSM : LINGO for Descriptors of Outline. Intell. Inf. Database Syst. Springer Berlin Heidelb. 315-324.
[28] S. Larabi, S. Bouagar, F. M. Trespaderne, and E. D. Lopez. 2003. LWDOS: Language For Writing Descriptors Of Outline Shapes. Image Anal. Proc. 2749: 1014-1021.
[29] A. Abdo, B. Chen, C. Mueller, N. Salim, and P. Willett. 2005. Ligand-based Virtual Screening Using Bayesian Networks. J. Chem. Inf. Model. 50(6): 1012-1020.
[30] M. S. Keys. MDL Information Systems Inc. San Leandro, CA. [31] A. Abdo, S. Caboche, V. Leclère, P. Jacques, and M. Pupin. 2012. A New Fingerprint To Predict Nonribosomal Peptides Activity. J. Comput. Aided. Mol. Des. 26(10): 1187-94.