Division X (Challenges of New Reactors)
Challenges Associated with Hydrogen Generation
Modeling in Small Modular Reactors
Julie M. Jarvis1, Allen T. Vieira2, and Rajgopal Vijaykumar3
1
Sr. Engineering Specialist, Bechtel Power Corporation, Frederick, MD ([email protected]) 2
Manager of Thermal Hydraulics and Radiation Analysis, Bechtel Power Corporation, Frederick, MD 3
Sr. Engineer, Bechtel Power Corporation, Frederick, MD
ABSTRACT
This paper discusses the challenges associated with hydrogen generation modeling in Small Modular Reactors (SMR). SMRs have particular design characteristics which can substantially delay and potentially eliminate significant hydrogen generation. The core may never be uncovered. As a result, hydrogen release may not occur or the hydrogen generated can be less than expected from the amount of Zirconium in the core. The challenge then is to determine a more realistic limited hydrogen release versus an instantaneous release using acceptable analysis tools and methods.
Computer codes to evaluate hydrogen generation include GOTHIC, MAAP5 and MELCOR which allow the analyst to optimize the design of hydrogen control equipment for design basis and severe accidents. In this paper, a scoping or exploratory EXCEL model is developed as a tool to quickly estimate the relative duration and magnitude of hydrogen release and containment pressurization for a typical SMR. Use of hydrogen mitigation systems in a SMR using realistic releases can potentially eliminate the plant operational and safety issues associated with an inerted containment, and also provide measures to address the challenges of severe accident loads.
INTRODUCTION
Current combustible gas control regulatory guides (SRP 6.2.5, RG 1.7) are more applicable for existing nuclear plants. With slower and extended hydrogen release rates in SMRs, various aspects need consideration to evaluate the release and design control systems requirements. These considerations include:
• Localized steam inerting of hydrogen which require proper separation and placement of hydrogen control equipment.
• Local pocketing and detonation in enclosed areas and within components. • Release locations and hydrogen transport.
• Passive Autocatalytic Recombiners (PARS) or igniters specifications and working closely with vendors to ensure proper function.
• Hydrogen ignition effects on equipment and structures.
• Hydrogen generation control during the long term recovery of the plant after a severe accident.
• Inerting versus not inerting the containment.
COMBUSTIBLE GAS CONTROL SYSTEM
Regulatory Requirements
Combustible gas control regulatory guides 10CFR50.44, Regulatory Guide RG 1.7 and SRP 6.2.5 provide guidelines for combustible gas control systems (CGCS). 10CFR50.44 CGCS requirements for future water-cooled reactors are:
• Mixed atmosphere in containment during design-basis and significant beyond design-basis accidents (10 CFR50.44(c)(1)).
• Combustible gas control must limit hydrogen concentrations in containment during and following an accident resulting in 100 percent fuel clad-coolant reaction, to less than 10 percent (by
volume) and maintain containment structural integrity (10CFR50.44(c)(2)).
• Equipment Survivability to maintain safe shutdown and containment structural integrity and remain functional during and after exposure to the environmental conditions created by the burning of hydrogen or local detonations of hydrogen (10CFR50.44(c)(3)).
• Monitoring equipment for monitoring hydrogen in the containment (10 CFR 50.44(c)(4)). • Structural analysis to demonstrate containment structural integrity (10 CFR 50.44(c)(5)).
Design Considerations
In light of CGCS regulatory requirements for future water-cooled reactors, design considerations include: • SECY-93-087 to design mitigation features and equipment to survive severe accident
environment for required durations to perform intended functions. SECY-93-087 also requires CGCS to ensure containment stresses do not exceed limits.
• Sensors to monitor combustible gas concentration in containment. Hydrogen sensors continuously measure the hydrogen concentration in containment during and after the accident and remain functional during and after exposure to accident environmental conditions (10CFR50.44(c)(4)(ii)).
• Hydrogen burns initiated after lower flammability limit is reached in containment. CGCS should handle combustion loads typical of a severe accident where local high hydrogen concentrations are possible leading to flammable gas mixtures in containment.
• Containment pressure and temperature effects associated with hydrogen burnoff (10CFR50.44(c)(3)).
• Gratings and open rooms to prevent hydrogen local pockets or detonations. • Not pre-inerting containment to allow access to containment during operation.
• Several well placed PARs as an initial CGCS approach. The design of a PAR includes a catalytic cartridge. When hydrogen and oxygen react on the cartridge surface, the resultant exothermic reaction causes conditions for convection, and consumption of hydrogen.
• An increase in hydrogen concentration beyond 10% can make the PAR outlet temperatures too high and damage the catalyst surface.
• Addressing uncertainties with thermal stratification related to containment height, hydrogen production reaction rates, and segregated compartments.
Structural Impact
rise with hydrogen burn is based on complete combustion of hydrogen generation by oxidation of 100% Zircaloy cladding in the active core (10CFR50.34(f)(3)).
For containment integrity, maximum pressure rise and loads generated from normal flame deflagration can be conservatively estimated by evaluating the combustion reaction assuming isochloric, complete combustion with no external heat loss (the Adiabatic Isochoric Complete Combustion (AICC) model). To meet regulatory requirements, the ultimate capacity pressure of containment should be above the AICC pressure calculated from limiting yet credible severe accident conditions.
Generation and combustion of large quantities of hydrogen is a severe accident phenomenon that can threaten containment integrity. But effective CGCS distributes combustible gases and reduces hydrogen concentrations to mitigate and avoid severe accident hazards. Detailed, plant specific analysis of mixing processes and combustion behaviors can provide insight for placement of igniters that minimizes the risk of unacceptable combustion loads on local structures or equipment. This paper focuses on hydrogen generation after depletion of the ultimate heat sink (UHS) which may take weeks, and exploratory CGCS modeling to maintain hydrogen concentrations below hazardous limits.
Ideally, a combination of igniters and PARs is used to maintain the concentration of hydrogen below 10% (7% target for this paper) in the containment. However, the act of combustion and flame spread by the igniters (as compared to much gentler reaction in the PARs) causes a large increase in containment pressure and temperature. In contrast, PARs lead to no increase in containment pressure and temperature and most of the energy generated by the reaction is transferred to the catalysts used to maintain the reaction.
HYDROGEN GENERATION
Post-accident hydrogen generation is complex and depends on plant specific designs. Major source of hydrogen generated from oxidation of Zirconium metal with steam is when Zirconium reaches temperatures well above normal operating levels. Experiments on core degradation indicate that in-vessel hydrogen generation associated with core damage can vary over a wide range. Specific amount of oxidation is dependent on a variety of parameters related to accident sequence progression (Saito, 2011) including:
- Reactor Coolant System (RCS) pressure - Timing and flow rate of reflooding if it occurs
- Temperature profile of reactor core during course of accident sequence
Other considerations include ex-vessel hydrogen generation (hydrogen produced due to ex-vessel core debris reacting with steam or concrete, or both). During a degraded core accidents, hydrogen is produced at a greater rate than for a design basis accident (DBA) loss of coolant accident (LOCA).
Assumptions
1. Hydrogen generation rate is calculated assuming 100% in-vessel zircaloy oxidation over a period of core uncovery (time calculated separately by boiloff analysis from the core).
2. The period of hydrogen generation is assumed to be equal to the time to boiloff coolant by the fuel rods (core).
3. Hydrogen generation rate is assumed to be constant over this time period (this assumption can be confirmed in a MELCOR analysis, not part of this paper).
4. The containment atmosphere is well mixed. A detailed analysis using MAAP5 (not part of this paper) can model hydrogen generation rate timeline and demonstrate natural circulation mixing.
6. The distribution of PARs is typically in the upper containment, however, the actual number of PARs can be varied, and the location is not considered in the exploratory analyses. A detailed MELCOR model (not part of this paper) can place PARs in appropriate compartments, but each compartment is assumed to be well-mixed.
7. Containment is not inerted. 8. Input parameters:
Reactor output power = 450 MWt
Containment volume = 500,000 ft3 (impacts hydrogen concentration) Zirconium mass = 10,000 lbm (determines hydrogen source term)
COMPUTER ANALYSES
The exploratory analysis is to determine the hydrogen concentration and containment pressurization due to hydrogen combustion/reaction in a typical SMR containment with PARs during a LOCA sequence. The CGCS in the containment is composed of a number of PARs distributed throughout the containment. The results from this study can be used to estimate the number of PARs required in the containment, based on the calculated maximum hydrogen concentration level.
The exploratory analysis in this paper uses Excel to estimate hydrogen generation assuming simplified inputs and measures to mitigate severe accidents but can be applied to specific plant designs. Due to uncertainties with severe accident progression, conservative assumptions are also used. The Excel model can be used as an exploratory tool for CGCS design to quickly estimate the required number of PARs for scoping or vendor comparison purposes.
Detailed confirmatory models of the accident sequence can be simulated using MAAP5 (Modular Accident Analysis Program) or MELCOR. MAAP5 (developed for EPRI) can generate lower flammability limit curves and be used to predict quantities of in-vessel and ex-vessel hydrogen generation. The MELCOR Code developed by Sandia National Laboratories, for the U.S. Nuclear Regulatory Commission, is a computer code for analyzing severe accidents in nuclear power plants and the design basis accidents for advanced power plant applications. A best estimate MELCOR model can calculate the impact of PARs and igniters in containment and hydrogen burn pressures at different ignition conditions. The Excel model only considers PARs to maintain hydrogen concentrations below limits to prevent igniter-induced burns.
Exploratory EXCELtm Analysis
In this paper, an analysis of hydrogen generation and combustion behavior in a typical SMR containment is performed using a simple mass balance of hydrogen. An exploratory EXCEL model is developed using the assumptions above and calculations below:
PARs in the containment can be modeled using the Fischer NIS PAR equation from (Fischer, 1995; MELCOR, 2005):
(1)
Where,
Rh = Hydrogen consumption (reaction) rate (kg/s)
η = Efficiency of reaction (0.85)
ρh = Hydrogen density (kg/m3)
a = Constant dependent on PAR model-specific design parameter (≈0.67 m3/sec)
b = Exponent dependent on PAR model (≈0.307)
Ch = Concentration of hydrogen (mole fraction) in the control volume
t b h h
h
a
C
f
h in h,
-
R
m
&
=
dt
dm
hft =
1
exp(
0)
τ
t
t
−
−
−
= Relaxation time function during initial PAR heat-upτ = Time of exponential heat-up of the catalyst plates (1800 s) t-t0 = Time of PAR initiation (s) – Time after PAR initiation (s)
= Time since arrival of hydrogen in containment (s)
The Fischer model is a parametric model developed for a particular type of PAR Unit. Equation (1) parameters are based on the NIS type of PAR developed by the NIS company in Germany. The exploratory EXCEL model uses the Equation (1) Fischer NIS PAR model but can be adjusted and confirmed for different PAR vendors. An “AREVA model” PAR with a higher hydrogen reaction rate is available (Kelm, 2008). If that model is selected and constants a and b are supplied by the vendor, the EXCEL model can be easily modified.
The rate of change of the mass of hydrogen in the containment is modeled using the following equation, based on a balance of mass of hydrogen flowing into the containment, and hydrogen reacted in the PARs:
(2)
Where,
Rh = Hydrogen consumption (reaction) rate (kg/min), Equation (1)
mh = Mass of hydrogen in containment, kg
ṁh,in = Mass flow rate of hydrogen into the containment, kg/min
The Excel model performs the following calculations:
• The reaction rate of hydrogen is calculated using Equation (1) and an assumed number of PARs. • Equation (2) is solved, marching forward in time, and calculating the mass of hydrogen in the
containment at each time step using the generation rates and reaction rates evaluated at the last time step and multiplying by the time step.
• The hydrogen mass in the containment is converted to a hydrogen concentration.
• The number of NIS PARs necessary to maintain concentration below a desired level (7%) is obtained, by iteration.
The EXCEL model has the input of the time to oxidize 100% zircaloy, and the number of PARs. In addition, the model used to calculate the reaction rate of hydrogen in the PAR has an impact.
Boiloff Analyses Using EXCELtm
• Boiloff in the reactor core is modeled by a simple heatup model (using EXCEL) that balances the decay power (for 450 MWt)) with water evaporation. The decay heat correlation is estimated using ANSI/ANS-5.1-2005 and ASB 9-2.
• As water level drops in the core, the decay heat contribution from the uncovered core is assumed to go to heat up the fuel rod, and not transferred to water. Partitioning of decay heat between the fuel rods (uncovered) and the coolant causes a slower water level decrease in the core.
• Above the water level, it is assumed that fuel rod heat up leads to complete exothermic oxidation and linear hydrogen generation rate.
• The axial and radial power variation within the core is ignored.
• The time to reach the water level at the top of the core is assumed to be 80 minutes. The top of the core is assumed to be 3.6 m from the bottom of the vessel. If the actual time to uncover the top of fuel rods is longer, it would result in lower decay heat, slower rate of Zircaloy oxidation, and a smaller number of required PARs.
AICC Pressures
The peak AICC pressure PbAICC is obtained from an energy balance in an adiabatic, isochoric closed system under the hypothesis of complete combustion, as expressed in terms of the internal energy: (Robledo, 2005)
∑
,= ∑
,+
(3)Where,
cv,i = Specific heat at constant volume, of gas, i
ni = Number of moles of species “i” in mixture (O2, N2, H2, H2O)
Tu = Initial temperature (unburned gas mixture)
TbAICC = Post-burn temperature of mixture considering AICC
nH2 = Moles of hydrogen burned
QH2 = Heat of combustion of hydrogen
In the above equation, the last term on the right hand side expresses the energy release by H2 reaction.
The AICC pressure is finally calculated by considering the containment atmosphere as an ideal gas mixture:
=
(4)
Where
nu = Total number of moles before burn
Pu = Pre-burn Pressure of unburned gas mixture
Tu = Pre-burn Temperature of unburned gas mixture
PbAICC = Post-burn Pressure of mixture considering AICC
nb = Total number of moles after burn
RESULTS
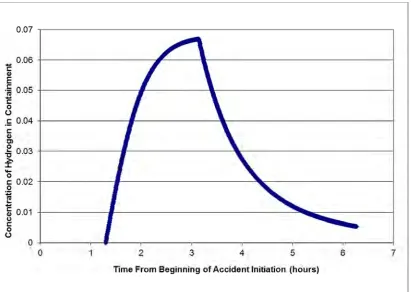
Figure 1 shows hydrogen concentration in the containment, using EXCEL to solve Equation (2). The time required to oxidize 100% of zircaloy in the vessel is calculated to be almost 2 hours (core uncovery begins at 1.3 hour), as shown in Figure 2. The number of NIS PARs required to maintain the hydrogen concentration below 7% is 20.
Figure 2 shows the time to boiloff the reactor core (from 3.6 m from the bottom of the vessel to 0.75 m from the bottom of the vessel). The calculated time is about 110 min or almost 2 hours (from the time to uncover the top of active fuel).
Figures 4 and 5 show the peak AICC pressures and temperatures for the modeled containment for a range of hydrogen concentrations with 3 types of initial conditions. If needed, the AICC can be reduced by a combustion completeness fraction (Robledo, 2005).
The exploratory model analyses show the following:
1. By using a sufficient number of PARs in containment, hydrogen can be reacted to maintain hydrogen concentrations below a desired level in the containment and below deflagration limits that may lead to significant pressurization in the containment.
2. The exploratory Excel analysis shows that 20 NIS PARs in the modeled containment can maintain the maximum containment hydrogen concentration below 7% and prevent igniter-induced burns. More accurate modeling of boiloff will lead to a reduction in the number of PARs needed.
3. If peak hydrogen concentrations are more than the target of 7%, the model suggests a need for more PARs (usually in the upper containment), or a more precise model for the PAR flow rate.
4. The boiloff model shows that from the time of uncovery of the top of active fuel, it takes almost 2 hours to completely uncover the fuel rods (time for zircaloy oxidation).
5. The PAR flow rate, number of PARs, time to oxidize all zircaloy, can all be varied in the EXCEL model to ascertain that a selected number of PARs will be needed to control the combustible gas concentration in the containment.
6. The exploratory analyses did not lead to an estimate of time to start uncovery, since no attempt was made to model the break flow. However, assuming the time to start core uncovery at 80 minutes, the time to complete core uncovery calculated in the exploratory analyses is about 190 min (80 + 110). 7. Use of the “AREVA model” or other PARs with higher flow rates can significantly reduce the
required number of PARs.
8. Because the PAR flow rate in an actual accident scenario is very non-linear; a closer coordination with the selected vendor, and incorporation of vendor-specific correlation, will clarify if the selected number of PARs is sufficient.
9. The exploratory Excel model is conservative. A more realistic accident scenario will result in slower uncovery of the top of fuel rods, lower decay heat, slower rate of Zircaloy oxidation, and a smaller number of required PARs.
CONCLUSIONS
REFERENCES
10CFR50.44, Combustible Gas Control for Nuclear Power Reactors ANSI/ANS-5.1-2005, “Decay Heat Power in Light Water Reactors.”
Fischer, K., (1995), “Qualification of Passive Catalytic Module for Hydrogen Mitigation,” Nuclear Technology, Vol. 112, p. 58, October 1995.
Gaunt, R. O., et al., MELCOR Computer Code and Users Manual, v1.8.6 Volume 1, Primer and User Guide, Sandia National Laboratories, September 2005.
Kelm, S. et al, (2008), “Operational Behaviour of Catalytic Recombiners - Experimental Results and Modelling Approaches,” Proceedings of the workshop on Experiments and CFD Code Application to Nuclear Reactor Safety (XCFD4NRS), Grenoble, France, September 2008.
Regulatory Guide 1.7, “Control of Combustible Gas Concentrations in Containment,” Rev. 3.
Robledo, F. et al, (2005) “Development of a Simple Computer Code to Obtain Relevant Data on H2 and CO Combustion in Severe Accidents and to Aid in PSA-2 Assessments,” CSNI Workshop on Uncertainties in PSA-2 Analyses, Aix-En-Provence, France, November 2005.
Saito, T., (2011). Advances in Light Water Reactor Technologies, Springer.
SECY-93-087, US NRC, “Policy, Technical, and Licensing Issues Pertaining to Evolutionary and Advanced Light-Water (ALWR) Design,” April 2, 1993.
SRP 6.2.5 “Combustible Gas Control in Containment,” Rev. 2.
U.S. Nuclear Regulatory Commission Branch Technical Position ASB 9-2, “Residual Decay Heat Energy for Light-Water Reactors For Long-Term Cooling” [Attachment to NUREG-800, Standard Review Plan, Section 9.2.5, Ultimate Heat Sink, Rev. 2, July 1981]
Figure 2: Water Level from Bottom of Reactor Vessel
Figure 4: AICC Peak Pressure (psia)