Western University Western University
Scholarship@Western
Scholarship@Western
Electronic Thesis and Dissertation Repository
7-9-2015 12:00 AM
Hydrogen Exchange Mass Spectrometry for Studying
Hydrogen Exchange Mass Spectrometry for Studying
Protein-Ligand Interactions
Ligand Interactions
Modupeola A. Sowole
The University of Western Ontario
Supervisor Lars Konermann
The University of Western Ontario Graduate Program in Chemistry
A thesis submitted in partial fulfillment of the requirements for the degree in Doctor of Philosophy
© Modupeola A. Sowole 2015
Follow this and additional works at: https://ir.lib.uwo.ca/etd
Part of the Analytical Chemistry Commons
Recommended Citation Recommended Citation
Sowole, Modupeola A., "Hydrogen Exchange Mass Spectrometry for Studying Protein-Ligand Interactions" (2015). Electronic Thesis and Dissertation Repository. 2942.
https://ir.lib.uwo.ca/etd/2942
This Dissertation/Thesis is brought to you for free and open access by Scholarship@Western. It has been accepted for inclusion in Electronic Thesis and Dissertation Repository by an authorized administrator of
Hydrogen Exchange Mass Spectrometry for Studying Protein-Ligand
Interactions
(Thesis format: Integrated-article)
By
Modupeola A. Sowole
Graduate Program in Chemistry A thesis submitted in partial fulfillment
of the requirements for the degree of
Doctor of Philosophy
The School of Graduate and Postdoctoral Studies The University of Western Ontario
London, Ontario, Canada
© Modupeola A. Sowole 2015
ii
Abstract
Hydrogen deuterium exchange (HDX) coupled with mass spectrometry is widely used for
probing protein structure and dynamics. Protein-ligand interactions usually induce a
reduction in the measured HDX rates an effect that may be ascribed to stabilization of the
protein structure. This work aims to improve the general understanding of the changes in
HDX patterns associated with ligand binding.
We initially applied HDX for studying differences between oxy-hemoglobin
(Oxy-Hb) and aquomet-hemoglobin (Chapter 2). The results show that the α and β subunits
respond differently to the oxy to aquomet transition with the heme binding pocket being
destabilized in both cases. The results suggest that enhanced structural dynamics in the heme
binding pocket may have adverse effects on heme-protein interactions.
Chapter 3 focuses on the different scenarios that can be encountered in an HDX
experiment upon ligand binding. Myoglobin and hemoglobin were used as model systems,
focusing on the oxy and deoxy states of both proteins. Our results demonstrate that ligand
binding can be stabilizing or destabilizing, leading to decreased or increased HDX rates
respectively.
In Chapters 4 HDX was used to probe the changes in structural dynamics of
caseinolytic protease P (ClpP), an antibiotic drug target, after binding ADEP antibiotics. The
mechanism of ADEP binding and the N-terminal structure of ClpP is not well understood
with conflicting x-ray structures reported in literature. Our findings demonstrate that the
N-terminus of ClpP remains quite unstructured after ADEP binding, while belt region
iii Pin 1, a peptidyl prolyl isomerase, binding to a cyclic peptide inhibitor was studied in
Chapter 5. Characterization of Pin1-CRYPEVEIC interactions by other techniques has been
difficult. This study demonstrates that binding of the inhibitor triggers an overall stabilization
of Pin 1. We identify a loop that interacts with basic sites of the ligand and that becomes
destabilized upon ligand binding. This destabilization is ascribed to steric clashes between
the peptide inhibitor and the protein
Keywords: hydrogen-deuterium exchange, mass spectrometry, hemoglobin, myoglobin,
iv
Statement of Co-Authorship
The works in Chapters 2, 3, 4 and 5 were published in the following articles, respectively:
Modupeola A. Sowole and Lars Konermann (2013). Comparative Analysis of Oxy-Hemoglobin and Aquomet-Oxy-Hemoglobin by Hydrogen/Deuterium Exchange Mass Spectrometry. J. Am. Soc. Mass Spectrom. 24, 997-1005. Reproduced with permission ©
2013, Springer.
Modupeola A. Sowole and Lars Konermann (2014). Effects of Protein-Ligand Interactions on Hydrogen/Deuterium Exchange Kinetics: Canonical and Non-Canonical Scenarios. Anal. Chem. 86, 6715-6722. Reproduced with permission © 2014, American Chemical Society.
M. Sowole, J. Alexopoulos, Y.-Q. Cheng, J. Ortega, and L. Konermann (2013). Activation of ClpP Protease by ADEP Antibiotics: Insights from Hydrogen Exchange Mass Spectrometry. J. Mol. Biol. 425 4508-4519. Reproduced with permission © 2013, Elsevier.
Modupeola A. Sowole, B. T. Innes, M. Amunugama, D. W. Litchfield, C. J. Brandl, B. H. Shilton, and L. Konermann. (2015). Noncovalent Binding of a Cyclic Peptide Inhibitor to the Peptidyl-Prolyl Isomerase Pin1 Explored by Hydrogen Exchange Mass Spectrometry. Can. J. Chem. 93, 44-50 Reproduced with permission. © 2015, NRC Research Press.
v
Dedication
vi
Acknowledgements
I am grateful to God Almighty for the successful completion of this degree program. Without
life and good health, I could have done nothing.
I wish to acknowledge my supervisor Dr. Lars Konermann for his support, mentorship
throughout the course of this journey. Working with you has been a great and wonderful
experience. I cannot forget your words of advice to me when I first joined the lab “Always
ask yourself before you leave the lab, have I done something towards an article today?”
A special thank you to members of my supervisory committee: Dr. Martin Stillman, Dr. Ken
Yeung and Dr. Keith Griffith. I’ll also like to say a big thank you to my examiners Dr.
Norman Huner and Dr. Derek Wilson.
My experience in the Konermann laboratory would not have been so great without the
wonderful people I call friends and colleagues. First I’ll like to thank Dr. Yan (Lucy) Pan for
showing me the ropes of HDX. She never got tired of my questions and was always available
even during my practice times on the weekends. My sincere thanks to Dr. Bradley Stocks, for
showing me that I can be an excellent repair woman with the right tools (the days of ice
buckets). Many thanks to the current and former group members who have given their time
in the form of educative discussions along the way like Siavash, Jenna, Yue, Edwardo,
Antony, Ming, Sherry, Haidy, Robert, Courtney and Samuel. You have all touched my life in
one way or the other.
A very special thanks to my husband, you have been a huge support through these past years.
Your love and understanding is immensely appreciated. Thanks for all the nights you had to
vii Finally, I would like to thank my family and good friends for all their support throughout the
viii
Table of Content
ABSTRACT ... II
STATEMENT OF CO-AUTHORSHIP ... IV
DEDICATION ... V
ACKNOWLEDGEMENTS ... VI
TABLE OF CONTENT ... VIII
LIST OF FIGURES ... XIII
LIST OF APPENDICES ... XXI
LIST OF SYMBOLS AND ABBREVIATIONS ... XXII
CHAPTER 1. Introduction ... 1
1.1. Protein Structures ... 1
1.2. Methods for Studying Protein Structure ... 1
1.3. "Traditional" Methods ... 2
1.3.1. X-ray crystallography ... 2
1.3.2. Nuclear Magnetic Resonance (NMR) Spectroscopy ... 3
1.3.3. Optical Methods ... 4
1.4. Mass Spectrometry ... 6
1.4.1. The ESI Source ... 7
ix
1.4.3. Quadrupole Mass Analyzer ... 10
1.4.4. Time of Flight (TOF) Mass Analyzer ... 12
1.5. Mass Spectrometry Based Methods for Characterizing Protein Structure and Dynamics. ... 14
1.5.1. Covalent Labeling ... 14
1.5.2. Covalent Cross Linking ... 16
1.5.3. Hydrogen Deuterium Exchange Mass Spectrometry ... 17
1.5.4. EX1 and EX2 ... 19
1.5.5. Effects of Temperature, pH and Composition on Exchange Rate ... 21
1.5.6. General Workflow of HDX-MS Experiments ... 22
1.6. Scope of Thesis ... 26
1.7. References ... 29
CHAPTER 2. Comparative Analysis of Oxy-Hemoglobin and
Aquomet-Hemoglobin by Hydrogen/Deuterium Exchange Mass Spectrometry ... 41
2.1. Introduction ... 41
2.2. Experimental Procedures ... 45
2.2.1. Materials ... 45
2.2.2. Hydrogen/Deuterium Exchange Mass Spectrometry ... 46
2.3. Results and Discussion ... 47
2.3.1. Optical Characterization of Hb Samples ... 47
2.3.2. Global HDX Kinetics ... 48
2.3.3. Spatially-Resolved HDX/MS Measurements ... 51
2.4. Conclusions ... 56
x
CHAPTER 3. Effects of Protein-Ligand Interactions on
Hydrogen/Deuterium Exchange Kinetics: Canonical and Non-Canonical
Scenarios ... 65
3.1. Introduction ... 65
3.2. Materials and Methods ... 68
3.2.1. Proteins and Reagents. ... 68
3.2.2. Hydrogen/Deuterium Exchange Mass Spectrometry. ... 70
3.3. Results and Discussion ... 75
3.3.1. Thermodynamic Considerations. ... 75
3.3.2. Oxygenation of Hemoglobin: Type 2 Binding. ... 80
3.3.3. Type 2 Oxygen Binding to Myoglobin. ... 83
3.3.4. Heme Binding to Apo-Myoglobin: A Type 1 Event. ... 86
3.4. Conclusions ... 90
3.5. References ... 92
CHAPTER 4. Activation of ClpP Protease by ADEP Antibiotics: Insights
from Hydrogen Exchange Mass Spectrometry ... 103
4.1. Introduction ... 103
4.2. Materials and Methods ... 107
4.2.1. Materials ... 107
4.2.2. Backbone Amide Hydrogen/Deuterium Exchange Mass Spectrometry ... 108
4.3. Results and Discussion ... 110
4.3.1. Global HDX Kinetics ... 110
4.3.2. Spatially-Resolved HDX/MS Measurements ... 111
xi
4.3.4. Implications for Product Release ... 117
4.3.5. N-Terminal Changes During ADEP1-Mediated Pore Opening ... 119
4.4. Conclusions ... 122
4.5. References ... 124
CHAPTER 5. Non-Covalent Binding of a Cyclic Peptide Inhibitor to the
Peptidyl-Prolyl Isomerase PIN1 Explored by Hydrogen Exchange Mass
Spectrometry ... 133
5.1. Introduction ... 133
5.2. Experimental Section ... 137
5.2.1. Materials. ... 137
5.2.2. Backbone Amide Hydrogen/Deuterium Exchange Mass Spectrometry. ... 138
5.3. Results and Discussion ... 140
5.4. Conclusions ... 147
5.5. References ... 149
CHAPTER 6. Summary and Future Work ... 157
6.1. Summary ... 157
6.2. Future Work ... 158
6.2.1. Application of HDX to Other Proteins ... 158
6.2.2. Application of HDX to Intrinsically Disordered Proteins (IDPs) ... 159
6.3. References ... 160
xii
xiii
List of Figures
Chapter 1
Figure 1-1: Schematic representation of an X-ray diffractometer………..….….2
Figure 1-2: Schematic representation of an ESI source operated in positive mode………....7
Figure 1-3: Summary of protein ESI mechanism for (a) CRM for the transfer of globular proteins into the gas phase, and (b) CEM used for unfolded proteins……….…….…….9
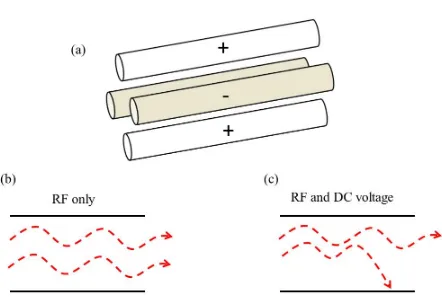
Figure 1-4: (a) Schematic representation of a quadrupole mass analyzer (b) RF only mode allows the passage of all analyte ions, and (c) quadrupole in mass filter mode…………...11
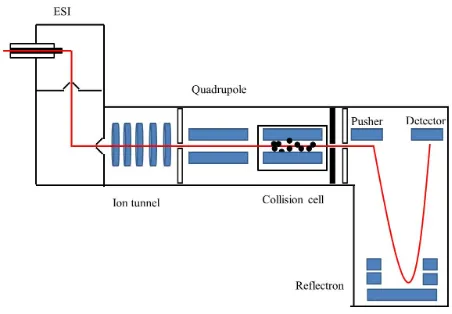
Figure 1-5: Schematic representation of an oaQ-TOF mass spectrometer equipped with a collision cell for collision-induced dissociation (CID). The red line indicates the ion trajectory………..…14
Figure 1-6: Schematic representation of a covalent labelling experiment. Solvent accessible reactive residues become modified (in this case via oxidation) while protected residues remain unlabeled……….……...15
Figure 1-7: A schematic depiction of a crosslinking reaction, with Lysine residues shown in red……….…….…..17
Figure 1-8: Deuterium uptake in the EX1 regime………..…...20
Figure 1-9: Deuterium uptake in the EX2 regime………...……..21
Figure 1-10: General protocol for an exchange-in HDX-MS experiment……….….…23
xiv proteolysis products to be washed off the trapping column via flow from a binary solvent module (BSM) which delivers a water/acetonitrile gradient (blue). The peptides are separated on a reversed-phase analytical column that is coupled to the ESI source of a mass spectrometer (MS)………...………...…...…..…25
Chapter 2
Figure 2-1: X-ray structure of bovine Hb (carbon monoxide-bound Fe (2+) state, pdb file 2qss ). The subunit numbering follows the commonly used notation 1. Heme groups are shown in magenta. The sites of distal ligand binding to the heme iron (oxygen in oxy-Hb, and water in aquomet-Hb) are highlighted in red………...………42
Figure 2-2: UV-Vis absorption spectra of oxy-Hb and aquomet-Hb in 10 mM ammonium
acetate. The protein concentration was 3 µM for both samples. Differences in the intensity of the Soret peak are caused by the different molar absorption coefficients of the two forms………..……….………….48
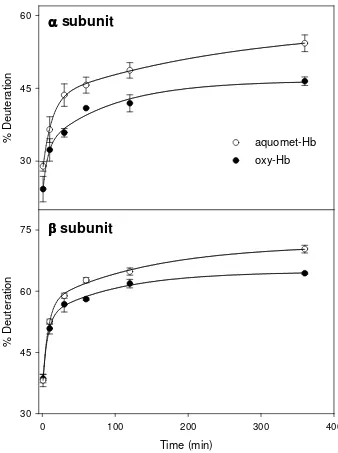
Figure 2-3: HDX kinetics of aquomet-Hb (open symbols) and oxy-Hb (filled symbols). The
two panels show data for the intact α (top) and β subunits (bottom) of the tetramer. Lines represent biexponential fits according to eq. 2.2………...………..50
Figure 2-4: Sequence of the Hb α and β subunits. Helices are denoted as rectangles. Peptic
fragments are indicated below the sequence. Solid lines represent peptides used for data analysis, whereas dashed lines represent redundant fragments. Boxes above the sequence indicate helices……….………52
Figure 2-5: HDX kinetics of peptides covering the α and β subunits of aquomet-Hb (open
symbols) and oxy-Hb (filled symbols). Residue numbers of the individual peptides are
xv ) 1 ( ) 1 (
% 1 2
2 1 0 t k t k e A e A A n
Deuteratio = + − − + − − where A0 is the fraction of amide backbone groups that undergoes burst phase labeling, and A1 and A2 are the fractions that undergo deuteration with apparent rate constants k1 and k2, respectively………...54
Figure 2-6: Mapping the HDX data of Figure 2-5 to the X-ray structure of bovine Hb for t =
120 min. Using the orientation of Figure 2.1 as reference, the top row of panels in this Figure
corresponds to α1, the bottom row represents β2. Colors in (a) - (d) represent deuteration percentages, as defined in the legend along the bottom. Gray elements in (a) - (d) were not covered by peptide mapping. Panels (e), (f): Deuteration differences, calculated as [aquomet - oxy] for t = 120 min. Colored regions correspond to |difference| > 5%. Segments that show
elevated deuteration after oxy aquomet conversion are depicted in red. Segments with reduced deuteration are shown in blue. In all six panels the ligand binding site on the heme is highlighted in cyan……….………..55
Chapter 3
Figure 3-1: (a) UV-Vis absorption spectra of different Mb derivatives (oxy, deoxy, and met)
at pH 7. (b) UV-Vis spectra of oxy- and deoxy-Hb. Also shown in both panels are spectra of the deoxy proteins after 2h of HDX with repeated removal of aliquots…………...……...70
Figure 3-2: Peptic cleavage map of Mb. Solid lines represent peptides used for data analysis,
and dashed lines represent redundant fragments. Helices are indicated by boxes………...….71
Figure 3-3: Sequence of the Hb α and β subunits. Solid lines represent peptides used for data analysis, and dashed lines represent redundant fragments. Helices are indicated by boxes………...….72
xvi are indicated in each panel. Also shown are data acquired for apo-Mb (filled red triangles)……….……….73
Figure 3-5: HDX kinetics of peptides covering the α and β subunits of oxy-Hb (filled
symbols) and deoxy-Hb (open symbols). Residue numbers are indicated in each panel. Lines are biexponential fits………74
Figure 3-6: Free energy level diagram of a two-state protein that can bind a ligand L in the ground state only. (A) No ligand present. U (open) is separated from the ground state N (closed) by 4 RT, resulting in an excited state occupancy of e-4. (B) Ligand binding widens
the gap between U and the new ground state NL to 6 RT. The excited state occupancy drops
to e-6 and kHDX decreases according to eq 3.4………...………...77
Figure 3-7: Free energy level diagram of a protein that can adopt many partially unfolded ligand-bound states. Only three of these are shown. The Boltzmann occupancy of each state is exp(-∆j). Ligand binding lowers the free energy of the ground state by ∆dG°. (A) No ligand
present. Excited states are assumed to be ∆j = 5, 7, and 9 RT units above the ground state; (B)
Type 1 scenario, where ligand binding lowers HDX rates. Excited state populations are reduced relative to (A), and kHDX decreases. (C) Type 0 scenario, where excited state
populations and HDX kinetics remain unchanged after binding. (D) Type 2 scenario, where excited state populations are increased such that deuteration proceeds more rapidly after binding. The overall binding affinity in (D) is determined by two competing contributions (eq 3.5)………...….…...78
Figure 3-8: HDX kinetics of deoxy-Hb (open symbols) and oxy-Hb (filled symbols). The
two panels show data for the intact α (A) and β subunits (B) of the tetramer. Solid lines are biexponential fits……….……….81
Figure 3-9: Spatially-resolved deuteration pattern of (A) deoxy-Hb and (B) oxy-Hb for t =
xvii segments that show most strongly elevated deuteration after O2 binding………...……..…..85
Figure 3-10: Intact protein HDX kinetics of holo-Mb in the oxy-state (filled symbols) and in the deoxy-state (open symbols). Also included are data for the heme-free protein (apo-Mb, red)………...87
Figure 3-11: Spatially-resolved deuteration pattern of (A) deoxy-Mb and (B) oxy-Mb for t =
60 min (PDB files 2V1K and 1DWR). Complete time profiles are shown in Figure S5. (C) HDX difference map averaged over the 2h experimental time window; red represents segments that show most strongly elevated deuteration after O2 binding………...88
Figure 3-12: Spatially-resolved deuteration pattern of (A) apo-Mb and (B) oxy-Mb for t = 60
min. PDB file 1DWR was used for both panels because high resolution X-ray data for apo-Mb are not available. (C) Difference map averaged over the 2h experimental time window; regions that show less extensive HDX in the presence of heme are highlighted in dark blue………...…89
Chapter 4
Figure 4-1: X-ray structural data for E. coli ClpP. (a) ClpP monomer in the absence of
ADEP1. N-terminal region, head and handle regions are indicated. Residues 1-18 are highlighted in red, the active site nucleophile S97 is shown in orange. (b) Equatorial and (c) axial view of the ADEP1-free ClpP 14mer (pdb file 1YG6). (d) Single monomer, (e) equatorial view, and (f) axial view of ClpP bound to ADEP1 (pdb file 3MT6). ADEP1 molecules are highlighted in magenta. Arrows in (e) highlight a slight dilation of the apical (head) regions upon ADEP1 binding, as well as a subtle contraction in the equatorial plane………..……….104
xviii Figure 4-3: Sequence of E. coli ClpP. Solid lines represent peptides used for HDX/MS data
analyses, dashed lines represent redundant peptides. Secondary structure elements are indicated. Selected hydrophobic residues are highlighted, matching the color scheme used in Figs. 4-7b-d………....112
Figure 4-4: Unprocessed HDX/MS data for three ClpP peptic peptides recorded in the absence (red solid lines) and in the presence (black dotted lines) of ADEP1 for three HDX time points………..…..……..113
Figure 4-5: HDX kinetics of peptides in free ClpP (open symbols) and after ADEP1 binding
(filled symbols). Residue numbers are indicated in each panel. Lines are biexponential fits. Error bars represent standard deviations of triplicate measurements………....114
Figure 4-6: Mapping of the of Figure 4-5 HDX/MS data to the X-ray structures of ClpP for t
= 60 min, shown for single ClpP subunits (top row), and for complete tetradecamers (bottom row). Colors in (a) - (d) represent deuteration percentages, as defined in the legend. Gray elements in (a) - (d) were not covered by peptide mapping. In (c) selected elements are identified; note that only one of the two ADEP1 molecules that are in contact with the subunit is shown. Panels (e), (f): HDX difference map. Colored regions correspond to |average difference| > 5% (eq. 4.2). Segments that exhibit elevated deuteration after ADEP1
binding are depicted in red. Segments with reduced deuteration are shown in blue. All other regions are depicted in gray………..….115
xix similar “down” conformations. (d) Top view of the ADEP1-bound open state (3MT6). Highlighted residues correspond to those in (b), (c). In addition, R22 and K25 are shown in cyan (with δ-guanido and ε-amino groups omitted, as indicated in the text). Note how the outside of the hydrophobic ring is stabilized by interactions with the ADEP1 alkyl tails………...…..118
Chapter 5
Figure 5-1: (A) Crystal structure of human Pin1 (PDB 3TCZ). Selected active site residues and secondary structure elements are highlighted. Hydrophobic residues are shown in blue, cationic side chains are highlighted in orange, and the active site Cys113 is depicted in pink. The WW domain is colored cyan. Not all of the Pin1 residues were resolved in the X-ray data, causing the appearance of a discontinuous chain. (B) Representative NMR structure of the Pin1 inhibitor [CRYPEVEIC] in the free (unbound) state. The square bracket notation is used to indicate the cyclic nature of the peptide………...….134
Figure 5-2: Sequence and secondary structure elements of Pin1, with the conventionally used residue numbering. Solid lines represent peptides used for the graphic representation of deuteration levels in Figs. 5-5, 5-6. Dashed lines represent redundant peptides…………...140
Figure 5-3: Unprocessed HDX/MS data for three Pin 1 peptic peptides recorded in the absence (black solid lines) and in the presence (red dotted lines) of [CRYPEVEIC] for a deuteration time of t = 360 min. The sequence range of the three peptides is indicated along
the top………..………..…141
xx Figure 5-5: Mapping of the HDX data from Figure 5.4 to the crystal structure of Pin1 for a deuteration time of t = 60 min in the absence of ligand (A) and in the presence of
[CRYPEVEIC]. Colors represent deuteration percentages as indicated in the legend. Gray color represents regions that were not covered during peptide mapping………..…144
xxi
List of Appendices
xxii
List of Symbols and Abbreviations
NMR Nuclear Magnetic Resonance
UV-VIS ultraviolet-visible
CD circular dichroism
I0 initial light intensity
I transmitted intensity
A absorbance
FRET Fӧrster resonance energy transfer
Ro Fӧrster radius
MS Mass Spectrometry
MALDI Matrix Assisted Laser Desorption/Ionization
ESI Electrospray Ionization
LC Liquid Chromatography
charge at Rayleigh limit
surface tension
vacuum permittivity
CRM charge residue model
IEM ion evaporation model
CEM chain ejection model
m/z mass to charge ratio
DC Direct current
RF radio frequency
Q-TOF Quadrupole-Time of Flight
•OH Hydroxyl radical
Epot potential energy
Ekin kinetic energy
HDX Hydrogen Deuterium Exchange
xxiii
kcl closing exchange rates
kex exchange rates
kch chemical exchange rates
Kop equilibrium constant
kH acid catalyzed exchange rates
kOH base catalyzed exchange rates
R radius of the droplet
Hb Hemoglobin
Mb Myoglobin
Kd dissociation constant
∆dG° dissociation free energies
∆opG° opening free energy
ITC Isothermal titration calorimetry
Z partition function
ClpP Caseinolytic protease P
ADEP Acyldepsipeptide
1
Chapter 1.
Introduction
1.1.
Protein Structures
Proteins play important roles in virtually all biological processes. While performing their
functions many proteins undergo conformational changes which are essential for enzyme
catalysis, transport, or energy conversion.1 Proteins adopt specific higher order structures via
folding pathways that are still not fully understood.2 Misfolding can lead to diseases such as
Alzheimer’s, Parkinson’s and other disorders.3 Even in the native state, proteins display
considerable flexibility ranging from localized fluctuations to large conformational
transitions. Ligand binding can trigger structural changes that lead to an increase or decrease
in activity.4-5 Ligands that cause such conformational switching include inhibitors, metal ions
and hormones.6 Deciphering protein conformational dynamics, folding pathways and
ligand-induced structural changes remain a fundamental research goal.
1.2.
Methods for Studying Protein Structure
Numerous methods are available for the study of protein structures. These techniques are
useful for both biochemical and clinical applications. A brief discussion of the most
2
1.3.
"Traditional" Methods
1.3.1.
X-ray crystallography
X-ray crystallography remains the gold standard for solving the 3D conformation
proteins with atomic resolution. This method is amenable to the study of protein 3D
structures because X-ray wavelengths are comparable to the ~1Å range typically encountered
for chemical bonds. A basic X-ray diffractometer includes a radiation source, and a detector
(Figure 1-1).
Figure 1-1: Schematic representation of an X-ray diffractometer
X-ray beam
Crystal
3 Protein X-ray crystallography was first implemented in the 1950s for solving the
structure of hemoglobin and myoglobin.7 The atomic coordinates derived from X-ray
crystallography are usually accompanied by displacement parameters also known as
B-factors. B-factor measures primarily the molecular disorder in the crystal and this is used as
an indirect estimate of the dynamics of the protein. B-factor also measures other errors in
addition to thermal motions in proteins crystal structures.8 It is widely recognized that
proteins are not static structures and they constantly sample different conformational states in
solution.9 The dynamic information on protein crystals are therefore limited because the
proteins are modelled as single conformations.10-11Although X-ray crystallography is widely
used, crystal growth remains a challenge as not all proteins are amenable to crystallization.
Also, X-ray data provide static pictures, thereby glossing over the intrinsic dynamics of
proteins.
1.3.2.
Nuclear Magnetic Resonance (NMR) Spectroscopy
NMR spectroscopy represents another tool for studying proteins. NMR is a
phenomenon during which nuclei absorb particular radio frequencies in a strong external
magnetic field. Depending on the type of interaction with the electromagnetic radiation
insight can be gleaned into the nuclear identity and environment. For a nucleus to be
NMR-visible, it must have a non-zero spin. Examples include 1H, 13C, 15N and 31P. The
incorporation of deuterium into the protein backbone eliminates some NMR proton signals
because 2H is not an NMR-active nucleus.12-13 NMR spectroscopy is a powerful technique for
4 measurements of 13C or 15N nuclei allow the study of molecular motions on the picosecond to
microsecond time scales. Heteronuclear NMR can also be used to determine protein
structures in solution.14The technique, however, suffers size limitation problems.15
1.3.3.
Optical Methods
Optical techniques are widely used for probing protein structural features. Examples
include UV-Visible (UV-VIS) absorption spectroscopy, circular dichroism (CD) and
fluorescence spectroscopy. These methods are quite popular because they are easy to use,
sensitive, and proteins can be studied directly under physiological conditions with good
sample recovery after analysis. They represent, however, low resolution tools.
CD spectroscopy is an absorption-based method that measures the difference of left
and right circularly polarized light. A CD spectrum is observable for chiral molecules. This
technique is often used to evaluate secondary structural elements in proteins. Different
structures generate characteristic CD signals. For example, proteins with a high α-helical
content will give CD spectra with a minimum at 222 nm. β-sheet structures have a minimum
around 215 nm, while for random coil structures the minimum appears at ~202 nm.16 Tertiary
structure information can also be obtained when wavelengths between 250-350 nm are
scanned.17
UV-Vis spectroscopy works well when the protein contains a chromophore such as a
conjugated π system. It is most useful for measuring protein concentrations. Also, small
changes protein structure can be reflected in alterations of the absorption maxima. A good
5 state of the heme chromophore is reflected by a shift in the absorption maxima from 415 nm
to 430 nm.18 Absorbance (A) is defined as
log 1.1
where I0 is the initial light intensity and I is the transmitted intensity.19 The absorbance of a
chromophore is related to its concentration according to Beer Lambert’s law.
ε C d 1.2
where d is the pathlength of the cuvette, C is concentration and ε is the molar absorption
coefficient.
Fluorescence spectroscopy is another optical technique that is routinely used for
protein structural analyses. An electronically excited chromophore can relax to the ground
state via photon emission to generate fluorescence. Tryptophan is the most commonly used
intrinsic fluorophore.20 Fӧrster resonance energy transfer (FRET) is fluorescence technique
that is particularly useful for probing molecular structure. In FRET, the energy transfer from
an excited donor fluorophore to an acceptor depends on the distance between the two
6
1.3
Where R is the distance between donor and acceptor and Ro is the Fӧrster radius for E = 0.5.
The sensitivity of FRET to distance has made it useful for probing distances within
3-8 nm, for example in the context of protein folding.22-23 FRET can also lead to fluorescence
quenching, a phenomenon that has been applied to proteins containing heme, retinal or other
non-fluorescent chromophores.24-27
1.4.
Mass Spectrometry
Mass spectrometry (MS) has evolved as an indispensable tool in proteomics research.
MS represents a weighing balance for ions in the gas phase. Two ionization techniques are
used in proteomics research which allows the transfer of intact protein analytes into the gas
phase under soft conditions. They are referred to as Matrix Assisted Laser
Desorption/Ionization (MALDI-MS) and Electrospray Ionization (ESI).28 These ionization
techniques allow the investigation of compounds with sizes ranging from a few Daltons (Da)
to mega Daltons (MDa).29-30 MALDI was developed in 1985 by Karas and Hillenkamp.31
For MALDI, the analytes are embedded in a solid matrix containing ultraviolet-absorbing
7 is exclusively used throughout this work, the ESI mechanism will be discussed in detail in
the following section.
1.4.1.
The ESI Source
ESI is a "soft" technique that is capable of transferring proteins and peptides from
solution into the gas phase. ESI has several advantages over MALDI. ESI can be coupled to
liquid chromatography (LC) which enables on-line separations. ESI generates multiply
charged ions, as opposed to the singly charged ions produced by MALDI. This allows the
detection of large analytes on mass spectrometers with limited m/z range.
8 ESI occurs at atmospheric pressure. An analyte solution is infused into a metal
capillary that is kept at a high voltage (~3kV in positive mode) relative to ground. This high
voltage causes charge separation, where electrons are removed from solution (for example
2H2O→ 4H+ + 4e- + O2). The solution at the tip of the capillary tip gets distorted into a
Taylor cone which emits a mist of µm sized droplets (Figure 1-2).34 The initial droplets
undergo rapid solvent evaporation. The charge density on the shrinking droplets continues to
increase until surface tension equals Coulombic repulsion, also known as the Rayleigh limit.
At this point, the number of elementary charges e is: 35
8 1.4
where R is the droplet radius, is the vacuum permittivity, and is the surface tension.
Droplets close to undergo jet fission. Several cycles of evaporation and jet fission
ultimately produce gaseous analyte ions that can be detected by MS. 32-33, 36-37 To avoid the
introduction of droplets and contaminants into the mass analyzer, a counter flow of gas is
used for desolvation (usually N2).38 Nano-ESI is a variant of ESI that requires less sample
volume than regular ESI. Nano-ESI droplets are believed to be at least 10 times smaller than
those produced by regular ESI sources, leading to enhanced salt tolerance.39 This makes
9 The ESI mechanism is widely debated, three scenarios have been put forward to
explain how charged droplets form analytes ions. These are referred to as the charge residue
model (CRM), ion evaporation model (IEM), and chain ejection model (CEM) (Figure 1-3).
37,40-41 The CEM and CRM apply to proteins. The CRM is thought to be operative for native
(compact) proteins.41 The droplet undergoes several evaporation/fission cycles until all the
solvent is removed, leaving a dried out protein ion. Unfolded proteins likely follow the CEM
where the polymer chain exits the droplet with concomitant exchange of mobile charge
carriers (protons).42
10
1.4.2.
Mass Analyzers
The mass analyzer is used to separate charged analytes ions based on their m/z
values. The charge state of a multiply protonated ion is given by
" ⁄ $% &' 1.5
Ion separation can be achieved by using electric and/or magnetic fields.43-44 Different mass
analyzers, include quadrupoles, time of flight instruments, linear ion traps, 45 Orbitrap,46-48
and Fourier transform ion cyclotron resonance devices.49 Some of these mass analyzers can
be coupled together for tandem MS applications. Only the quadrupole and the time of flight
operation will be discussed in the next section, because they are directly relevant to the
experiments of this work.
1.4.3.
Quadrupole Mass Analyzer
The quadrupole is by far the most common mass analyzer. It consists of two pairs of
cylindrical rods with opposite charges (Figure 1-4). With a radio frequency (RF) voltage
applied to the quadrupole, all ions generated in the source can be transmitted to the detector.
In this "RF-only" mode, the quadrupole acts as an ion guide (Figure 1-4b). The quadrupole
11 voltages. In this "mass-resolving" mode, only ions with a certain m/z value can pass through
the quadrupole while all other ions collide with the rods because their trajectories are
unstable (Figure 1-4c). Single quadrupoles have been used in early mass spectrometers. In
modern instruments it is more common to use them in conjugation with other analyzers. In
particular Q-TOF instruments use quadrupole for precursor selection in tandem MS.50-54
12
1.4.4.
Time of Flight (TOF) Mass Analyzer
TOFs are able to separate ions of different m/z values without the need to scan across
the mass range, a feature which is a huge advantage over quadrupole mass filters. In a TOF
instrument, ions are accelerated into a flight tube by the application of a pusher pulse. Upon
acceleration, the potential energy of the ion is converted into kinetic energy, and the time it
takes for the ions to reach the detector can be calculated as follows
)* +,- 1.6
/ 12 "01 1.7
From eq. 1.7, the time it takes to traverse the flight tube by an ion can be calculated as
3 4 5" 2/ 1.81
where U, d, m, z and represent the acceleration voltage, length of the flight tube, mass of
the ion, charge state of the ion, and velocity of the ion, respectively. Equation 1.8 can be
13 3 67" 1.9
Where 6 4 √2/: is a parameter independent of the analyte
With conventional TOF instruments, slight deviations in the velocities of ions are not
corrected for, two ions of the same m/z value with slightly different velocities will arrive at
the detector at different times, leading to low mass resolution. The introduction of reflectron
compensates for these velocity differences. Most modern instruments use an orthogonal
acceleration geometry (oa-TOF) where the pusher pulse is applied in a perpendicular
14 Figure 1-5: Schematic representation of an oaQ-TOF mass spectrometer equipped with a collision cell for collision-induced dissociation (CID). The red line indicates the ion trajectory.
The ion travelling with a higher velocity penetrates the reflectron further than one with a
lower velocity. This ensures that the two ions arrive at the detector at the same time leading
to sharper peaks and better resolution.55
1.5.
Mass Spectrometry Based Methods for Characterizing Protein
Structure and Dynamics.
15 Covalent labeling is a common approach for examining protein conformations. This
method can probe the solvent accessibility of side chains. Exposed sites react with the
covalent probe very quickly, while buried regions are protected (Figure 1-6).56
Figure 1-6: Schematic representation of a covalent labelling experiment. Solvent accessible reactive residues become modified (in this case via oxidation) while protected residues remain unlabeled
Hydroxyl radical (•OH) is a widely used covalent label because it is reactive and
capable of labeling many types of residues. •OH labeling occurs very rapidly with an
estimated time scale of ~1 µs under properly optimized conditions which is useful for
monitoring short lived folding intermediates.57 Quantitative analyses of oxidation patterns (or
solvent accessibility) are usually conducted at the peptide level by subjecting the protein to
LC-16 MS/MS methods.58-60 Covalent labeling has been applied to the study of protein-protein
interactions,61-62 protein-DNA complexes,63 integral membrane proteins binding studies64 and
some in vivo experiments.65
Although covalent labeling generates labels that are highly stable and relatively easy
to detect, the analysis is complicated by the fact that differentially labeled peptides do not
coelute during LC. Also, the introduction of covalent labels may alter the protein structure.
This problem can be minimized by ensuring that the number of labels per protein is very
low.66-67
1.5.2.
Covalent Cross Linking
Covalent cross linking relies on the ability of two protein side chains, at an
appropriate distance from each other, to undergo coupling upon exposure to a suitable
cross-linking agent (Figure 1-7). A variety of cross-linkers have been made, most of consist of two
reactive sites (commonly alkyl chain). Lysines represent the most widely targeted type of
cross-linking site. Cysteine and other residues can be used as well.68 The cross-linking agent
can either be functionalized to probe Lys distances (homo-bifunctional linkers) or
17 Figure 1-7: A schematic depiction of a crosslinking reaction, with Lysine residues shown in red.
Cross-linking agents can also have variable spacer lengths.69 Similar to covalent
labeling, an enzymatic cleavage step is almost always incorporated into the analysis. The
analysis is complicated by the need to separate a small modified peptide fraction from a
largely unmodified digest. This is even more challenging when protein interactions are being
studied because the linker can react in a number of different ways.70
1.5.3.
Hydrogen Deuterium Exchange Mass Spectrometry
Hydrogen deuterium exchange (HDX) is a powerful tool for probing the higher order
structures and dynamics of protein.71 HDX coupled with ESI-MS has evolved as a useful
technique for studying the conformation, dynamics and interactions of proteins in solution.
72-73 HDX measurements can be used to locate binding sites, identify structural changes, and for
18 studies have used HDX to examine protein-protein and protein-ligand interactions.76-80 HDX
also allows the study of the conformation, dynamics and function of proteins larger than 40
kDa. 81-83
In HDX, protein is exposed to a solvent containing D2O or a fully deuterated protein
is exposed to H2O. The former is known as exchange-in and the latter is referred to as
exchange-out, with both experiments giving identical information. Regions of the protein that
are not involved in hydrogen bonding exhibit a burst phase exchange kinetic, whereas
regions that are in the interior of the protein or involved in hydrogen bonds, exchange at
much slower rates.84 Depending on solvent accessibility and hydrogen bonding strength,
different backbone amide (N-H) hydrogens undergo isotopic exchange at different rates.85
Exchange can also occur at O-H, N-H and S-H sites on the side chains, but these deuteriums
are lost during the LC step due to back-exchange. Thus, the side chains do not contribute to
the measured mass shifts.86 The overall backbone HDX exchange mechanism for native
proteins under continuous labelling conditions can be described as
; < &=>?@A ⇄ ; < &)@-@A ⇄ ; < C)@-@A ⇄ ; < C=>?@A 1.10
where kop, kcl, and kch are the opening, closing and chemical exchange rates constants
respectively. Each amide hydrogens in a protein can exhibit a unique combination of kop, kcl
and kch. For exchange to occur in a protected region of the protein, the amide hydrogen of
kch
kop
kcl
kcl
kop
19 interest has to be solvent accessible which means the hydrogen bonds have to be transiently
broken.87
1.5.4.
EX1 and EX2
Two limiting regimes are seen in HDX kinetics for a protein in the native state. They are
EX1 and EX2: EX1 is not common at physiological pH. In this scenario, the chemical
exchange rate is faster than the closing rate (kch >> kcl) (Figure 1-8). The regime can be
promoted in the presence of denaturants and high temperatures. The resulting exchange rate
constant is simply
6ex 6op 1.11
20 Figure 1-8: Deuterium uptake in the EX1 regime
The EX2 exchange regime is usually observed for native proteins at physiological pH where
most labeling experiments take place with kcl>>kch. The exchange rate constant is given by
6HDX 6 op
6cl6ch Eop6ch 1.12
where Kop is the equilibrium constant for the opening and closing events. This exchange
regime is manifested via peak envelopes that shift to higher m/z values as the exposure time
21 Figure 1-9: Deuterium uptake in the EX2 regime
Finally, for an unfolded protein, the exchange kinetics is only dependent on the chemical
exchange rate constant i.e.
6HDX 6ch 1.13
1.5.5.
Effects of Temperature, pH and Composition on Exchange Rate
The exchange rate of N-H hydrogens is dictated by the pH, temperature, solvent
22 backbone can be exchanged with deuterium. Deuterium in the backbone is retained during
HDX analysis, while side chains back to hydrogen during analysis.88 N-H groups are
catalyzed by acid and base. The rate constant for chemical exchange can be expressed as:
6ch 6H $&+' 6OH $F&-' 1.14
where kH and kOH are rates of acid and base catalyzed exchange respectively. The exchange
rate has a minimum at pH 2.5 - 3. The exchange kinetics are also dependent on temperature
as dictated by the Arrhenius equation as shown below.
GH 6=I GH < a J
: 1.15
1.5.6.
General Workflow of HDX-MS Experiments
The general procedure used in HDX-MS is illustrated in Figure 1-10. The experiment can be
conducted at the intact protein level, or in a spatially-resolved manner with protease
23 Figure 1-10: General protocol for an exchange-in HDX-MS experiment
Isotopic exchange is initiated with the folded protein incubated in D2O buffered to the
desired pH. Aliquots are removed at selected labelling times ranging from a few seconds to
several days. After the deuterium exchange-in step, HDX is quenched by decreasing the pH
to 2.4 and the temperature to 0oC. The intact protein can then be analyzed for global
exchange kinetics. The LCMS analysis is usually carried out within a short time to prevent
back exchange.
To obtain HDX kinetics information on small regions of the protein, the protein is
subjected to proteolysis using an immobilized pepsin column or other acid-active protease
under quench conditions. The use of high pressure during proteolysis can enhance digestion
24 transferred to an analytical column for reverse phase LC to determine the level of deuterium
incorporated in the different segments.88,91 A schematic representation of a state-of-the-art
digestion/desalting and separation fluidic unit for HDX-MS is shown in Figure 1-11.
To avoid carryover in the experiments, washing steps between injections are usually
incorporated into the protocol.92-93 For peptide analysis, MS/MS experiments have to be
carried out first to identify peptides before the actual deuteration experiments. This is
because pepsin is a nonspecific protease which complicates the identification of peptides
after deuteration. The introduction of software packages have helped in minimizing the
problem of peptide analysis in HDX workflows.94-99 Nepenthesin is another acidic protease
26 proteolysis products to be washed off the trapping column via flow from a binary solvent module (BSM) which delivers a water/acetonitrile gradient (blue). The peptides are separated on a reversed-phase analytical column that is coupled to the ESI source of a mass spectrometer (MS). Reprinted with permission from Konermann et. al (2014) ACS.97
Back exchange still remains a major problem in HDX-MS experimental protocols.
Back exchange washes out the deuterium pattern incorporated into the protein during the
labelling process.101 This can be mitigated by conducting the digestion and LC workflow in a
short period of time at 0oC. Recent studies have also shown that the use of freezing point
depressants can significantly reduce the amount of back exchange.102,91
1.6.
Scope of Thesis
Proteins are not static structures but dynamic systems that undergo fluctuations in
which hydrogen bonds are constantly opened and reclosed. The degree of fluctuation can be
modulated by external stimuli stabilize or destabilize the proteins. Protein-ligand interactions
in HDX experiments usually induce a reduction in the measured HDX rates, and this is
usually ascribed to stabilization of the protein structure.103-104,77
The objective of this research is to improve the understanding of changes in HDX
patterns that are associated with protein-ligand binding. Ultimately, these efforts should
provide insights into protein conformational dynamics, structures, and ultimately function.
Oxy-Hb and aquomet-Hb represent widely used MS test analytes and previous MS
27 share the same solution phase properties. In Chapter 2, the structural dynamics in oxy-Hb
and aquomet-Hb were compared using HDX-MS. The results indicate a global stabilization
in Oxy-Hb with some destabilization in the heme binding pocket which is a possible
explanation for heme release in aquomet-hemoglobin.
HDX experiments are usually carried out with the expectation that ligand binding will
induce a reduction in the deuteration rates of the protein. In Chapter 3, the effect of ligands
binding to hemoglobin and myoglobin was studied using HDX-MS. This chapter explores
the different scenarios that can be encountered in an HDX experiment upon ligand binding.
The experiments in this chapter suggest that proteins can be globally stabilized or
destabilized after ligand binding. The results further show that it is possible to have both
scenarios in a single protein after ligand binding while some regions of the protein
experience no appreciable change at all.
ClpP is a protease complex responsible for the degradation of substrate proteins in
bacteria. The mechanism of pore opening in ClpP has been a topic of debate in literature with
different views. In Chapter 4, HDX-MS was used to study the interaction between
Caseinolytic Protease (ClpP) an antibacterial drug target and its ligand ADEP. The findings
from this chapter demonstrate that binding of a ligand can trigger conformational changes
both at the binding site and at allosteric sites far from it with hydrophobic interactions
playing a major role at the opening of the ClpP axial pore.
Peptidyl-prolyl isomerases (PPIase) catalyze the cis-trans conversion of X-pro bonds.
Pin 1 is a PPIase involved in cell cycle regulation making it a promising anticancer target. In
28 The experiments in this chapter were able to identify a loop region of residues which may
have been responsible for the inability of researchers to crystalize Pin 1 with its ligands. The
results also indicate that protein ligand interactions can result in both stabilization and
29
1.7.
References
1. Marcsisin, S. R.; Engen, J. R., Hydrogen exchange mass spectrometry: what is it and what can it tell us? Anal. Bioanal. Chem. 2010,397, 967-972.
2. Dill, K. A.; Ozkan, S. B.; Shell, M. S.; Weikl, T. R., The Protein Folding Problem.
Annu. Rev. Biophys. Biomol. Struct. 2008,37, 289-316.
3. Prusiner, S. B., A Unifying Role for Prions in Neurodegenerative Diseases. Science
2012,336, 1511-1513.
4. Kiefhaber, T.; Bachmann, A.; Jensen, K. S., Dynamics and mechanisms of coupled protein folding and binding reactions. Curr. Op. Struct. Biol. 2012,22, 21-29.
5. Boehr, D. D.; Nussinov, R.; Wright, P. E., The role of dynamic conformational ensembles in biomolecular recognition. Nat. Chem. Biol. 2009,5, 789-796.
6. Robinson, C. V.; Sali, A.; Baumeister, W., The molecular sociology of the cell.
Nature 2007,450, 973-982.
7. Kendrew, J. C.; Bodo, G.; Dintzis, H. M.; Parrish, R. G.; Wyckoff, H.; Phillips, D. C., A Three-Dimensional Model of the Myoglobin Molecule Obtained by X-Ray Analysis.
Nature 1958,181 (4610), 662-666.
8. Frauenfelder, H.; Petsko, G. A.; Tsernoglou, D., Temperature-dependent X-ray diffraction as a probe of protein structural dynamics. Nature 1979,280, 558-563.
30 10. Frauenfelder, H.; Chen, G.; Berendzen, J.; Fenimore, P. W.; Jansson, H.; McMahon, B. H.; Stroe, I. R.; Swenson, J.; Young, R. D., A unified model of protein dynamics. Proc. Natl. Acad. Sci. U.S.A. 2009,106, 5129-5134.
11. DePristo, M. A.; de Bakker, P. I.; Blundell, T. L., Heterogeneity and inaccuracy in protein structures solved by X-ray crystallography. Structure 2004,12, 831-838.
12. Woodward, C., Is the slow-exchange core the protein folding core? Trends Biochem. Sci. 1993,18, 359-360.
13. Li, R.; Woodward, C., The hydrogen exchange core and protein folding. Protein Science 1999,8 (8), 1571-1590.
14. Wuthrich, K., NMR Studies of Structure and Function of Biological Macromolecules (Nobel Lecture). Angew. Chem. Int. Ed. 2003,42 3340 –3363.
15. Wand, A. J., Dynamic activation of protein function: A view emerging from NMR spectroscopy. Nat. Struct. Biol. 2001,8, 926-931.
16. Brahms, S.; Brahms, J., Determination of Protein Secondary Structure in Solution by Vacuum Ultraviolet Circular Dichroism. J. Mol. Biol. 1980,138, 149-178.
17. Kelly, S. W.; Jess, T. J.; Price, N. C., How to Study Protein by Circular Dichroism.
Biochim. Biophys. Acta 2005,1751, 119-139.
18. Antonini, E.; Brunori, M., Hemoglobin and Myoglobin in Their Reactions With Ligands. North-Holland Publishing Company: Amsterdam, London, 1971; Vol. 21.
19. Skoog, D. A., Principles of Instrumental Analysis. Brooks/Cole Thomson Learning:
31 20. Pan, Y.; Brown, L.; Konermann, L., Mapping the Structure of an Integral Membrane Protein under Semi-Denaturing Conditions by Laser-Induced Oxidative Labeling and Mass Spectrometry. J. Mol. Biol. 2009,394, 968-981.
21. Förster, T., Ann. Phys. 1948,2, 55-75.
22. Munoz, V., Conformational Dynamics and Ensembles in Protein Folding. Annu. Rev. Biophys. Biomol. Struct. 2007,36, 395-412.
23. Schuler, B.; Lipman, E. A.; Eaton, W. A., Probing the free-energy surface for protein folding with single-molecule fluorescence spectroscopy. Nature 2002,419, 743-747.
24. Elöve, G. A.; Bhuyan, A. K.; Roder, H., Kinetic Mechanism of Cytochrome c Folding: Involvement of the Heme and Its Ligands. Biochemistry 1994,33, 6925-6935.
25. Lee, S. P.; Engman, K. C.; Tezcan, F. A.; Gray, H. B.; Winkler, J. R., Structural features of cytochrome c' folding intermediates revealed by fluorescence energy-transfer kinetics. Proc. Natl. Acad. Sci. U.S.A. 2002,99, 14778-14782.
26. Kawamura-Konishi, Y.; Kihara, H.; Suzuki, H., Reconstitution of myoglobin from apoprotein and heme, monitored by stopped-flow absorption, fluorescence and circular dichroism. Eur. J. Biochem. 1988,170, 589-595.
27. Shen, L. L.; Hermans, J., Kinetics of Conformation Change of Sperm-Whale Myoglobin. I. Folding and Unfolding of Metmyoglobin following pH jump. Biochemistry
1972,11, 1836-1841.
28. Kaltashov, I. A.; Eyles, S. J., Mass Spectrometry in Structural Biology and Biophysics: Architecture, Dynamics, and Interactions of Biomolecules. 2nd ed.; Wiley:
32 29. Heck, A. J. R.; Van den Heuvel, R. H. H., Investigation of intact protein complexes by mass spectrometry. Mass Spectrom. Rev. 2004,23, 368-389.
30. Berkenkamp, S.; Kirpekar, F.; Hillenkamp, F., Infrared MALDI Mass Spectrometry of Large Nucleic Acids. Science 1998,281, 260-262.
31. Karas, M.; Bachmann, D.; Hillenkamp, F., Influence of the wavelength in high-irradiance ultraviolet laser desorption mass spectrometry of organic molecules. Anal. Chem.
1985,57, 2935-2939.
32. Fenn, J. B., Electrospray Wings for Molecular Elephants (Nobel Lecture). Angew. Chem. Int. Ed. 2003,42, 3871-3894.
33. Kebarle, P.; Verkerk, U. H., Electrospray: From Ions in Solutions to Ions in the Gas Phase, What We Know Now. Mass Spectrom. Rev. 2009,28, 898-917.
34. Wu, X.; Oleschuk, R. D.; Cann, N. M., Characterization of microstructured fibre emitters: in pursuit of improved nano electrospray ionization performance. Analyst 2012,
137, 4150-4161.
35. Rayleigh, L., On the Equilibrium of Liquid Conducting Masses charged with Electricity. Phil. Mag. 1882,14, 184-186.
36. Cech, N. B.; Enke, C. G., Practical Implication of Some Recent Studies in Electrospray Ionization Fundamentals. Mass Spectrom. Rev. 2001,20, 362-387.
37. Nguyen, S.; Fenn, J. B., Gas-phase ions of solute species from charged droplets of solutions. Proc. Natl. Acad. Sci. U.S.A. 2007,104, 1111-1117.
38. Covey, T. R.; Thomson, B. A.; Schneider, B. B., Atmospheric Pressure Ion Sources.
33 39. Juraschek, R.; Dulcks, T.; Karas, M., Nanoelectrospray - More than just a Minimized-Flow Electrospray Ionization Source. J. Am. Soc. Mass Spectrom. 1999,10, 300-308.
40. Hogan, C. J.; Carroll, J. A.; Rohrs, H. W.; Biswas, P.; Gross, M. L., Combined Charged Residue-Field Emission Model of Macromolecular Electrospray Ionization. Anal. Chem. 2009,81, 369-377.
41. Konermann, L.; Ahadi, E.; Rodriguez, A. D.; Vahidi, S., Unraveling the Mechanism of Electrospray Ionization. Anal. Chem. 2013,85, 2-9.
42. Sciuto, S. V.; Liu, J.; Konermann, L., An Electrostatic Charge Partitioning Model for the Dissociation of Protein Complexes in the Gas Phase. J. Am. Soc. Mass Spectrom. 2011,
22, 1679-1689.
43. Watson, J. T., Introduction to Mass Spectrometry. third ed.; Lippincott - Raven:
Philadelphia, New York, 1997.
44. Roboz, J., Mass Spectrometry: Instrumentation and Techniques. Wiley: New York,
1968.
45. Douglas, D. J.; Frank, A. J.; Mao, D., Linear Ion Traps in Mass Spectrometry. Mass Spectrom. Rev. 2005,24, 1-29.
46. Makarov, A., Electrostatic Axially Harmonic Orbital Trapping: A High-Performance Technique of Mass Analysis. Anal. Chem. 2000,72, 1156-1162.
47. Scigelova, M.; Makarov, A., Orbitrap Mass Analyzer - Overview and Applications in Proteomics. Proteomics 2006,6 Suppl. 2, 16-21.
48. Zubarev, A. R.; Makarov, A., Orbitrap Mass Spectrometry. Anal. Chem. 2013, 85,
34 49. Marshall, A. G.; Hendrickson, C. L.; Jackson, G. S., Fourier Transform Ion Cyclotron Resonance Mass Spectrometry: A Primer. Mass Spectrom. Rev. 1998,17, 1-35.
50. Iribarne, J. V.; Dziedzic, P. J.; Thomson, B. A., Atmospheric pressure ion evaporation - mass spectrometry. Int. J. Mass. Spectrom. 1983,50, 331-347.
51. Yamashita, M.; Fenn, J. B., Electrospray Ion Source. Another variation on the Free-Jet Theme. J. Phys. Chem. 1984,88, 4451-4459.
52. Fenn, J. B.; Mann, M.; Meng, C. K.; Wong, S. F.; Whitehouse, C. M., Electrospray ionization-principles and practice. Mass Spectrom Rev. 1990,9, 37-70.
53. Smith, R. D.; Loo, J. A.; Baringa, C. J.; Edmonds, C. G.; Udseth, H. R., Collisional Activation and Collision-Activated Dissociation of Large Multiply Charged Polypeptides and Proteins Produced by Electrospray Ionization. J. Am. Soc. Mass Spectrom. 1990,1, 53-65.
54. Mirza, U. A.; Cohen, S. L.; Chait, B. T., Heat-Induced Conformational Changes in Proteins Studied by Electrospray Ionisation Mass Spectrometry. Anal. Chem. 1993,65, 1-6.
55. Verentchikov, A. N.; Ens, W.; Standing, K. G., REFLECTING TIME-OF-FLIGHT MASS-SPECTROMETER WITH AN ELECTROSPRAY ION-SOURCE AND
ORTHOGONAL EXTRACTION. Anal. Chem. 1994,66 (1), 126-133.
56. Mendoza, V. L.; Vachet, R. W., Probing Protein Structure by Amino Acid-specific Covalent Labeling and Mass Spectrometry. Mass Spectrom. Rev. 2009,28, 785-815.
35 58. Gau, B. C.; Chen, J. W.; Gross, M. L., Fast photochemical oxidation of proteins for comparing solvent-accessibility accompanying protein folding: Data processing and application to barstar. BBA-Proteins Proteomics 2013,1834 (6), 1230-1238.
59. Li, X.; Li, Z.; Xie, B.; Sharp, J. S., Improved Identification and Relative Quantification of Sites of Peptide and Protein Oxidation for Hydroxyl Radical Footprinting.
J. Am. Soc. Mass Spectrom. 2013,24 (11), 1767-1776.
60. Jumper, C. C.; Bomgarden, R.; Rogers, J.; Etienne, C.; Schriemer, D. C., High-Resolution Mapping of Carbene-Based Protein Footprints. Anal. Chem. 2012,84, 4411-4418.
61. Zhang, H.; Gau, B. C.; Jones, L. M.; Vidavsky, I.; Gross, M. L., Fast Photochemical Oxidation of Proteins for Comparing Structures of Protein-Ligand Complexes: The Calmodulin-Peptide Model System. Anal. Chem. 2011,83, 311-318.
62. Jones, L. M.; Sperry, J. B.; Carroll, J. A.; Gross, M. L., Fast Photochemical Oxidation of Proteins for Epitope Mapping. Anal. Chem. 2011,83, 7657-7661.
63. Schorzman, A. N.; Perera, L.; Cutalo-Patterson, J. M.; Pedersen, L. C.; Pedersen, L. G.; Kunkel, T. A.; Tomer, K. B., Modeling of the DNA-binding site of yeast Pms1 by mass spectrometry. DNA Repair 2011,10, 454-465.
64. Orban, T.; Jastrzebska, B.; Gupta, S.; Wang, B.; Miyagi, M.; Chance, M. R.; Palczewski, K., Conformational dynamics of activation for the pentameric complex of dimeric g protein-coupled receptor and heterotrimeric G protein. Structure 2012, 20,
826-840.
36 66. Xu, Y.; Falk, I. N.; Hallen, M. A.; Fitzgerald, M. C., Mass Spectrometry- and Lysine Amidination-Based Protocol for Thermodynamic Analysis of Protein Folding and Ligand Binding Interactions. Anal. Chem. 2011,83, 3555-3562.
67. Zhou, Y. P.; Vachet, R. W., Covalent Labeling with Isotopically Encoded Reagents for Faster Structural Analysis of Proteins by Mass Spectrometry. Analytical Chemistry 2013,
85 (20), 9664-9670.
68. Klockenbusch, C.; O'Hara, J. E.; Kast, J., Advancing formaldehyde cross-linking towards quantitative proteomic applications. Anal. Bioanal. Chem. 2012,404 (4), 1057-1067.
69. Fischer, L.; Chen, Z. A.; Rappsilber, J., Quantitative cross-linking/mass spectrometry using isotope-labelled cross-linkers. J. Proteomics 2013,88, 120-128.
70. Leitner, A.; Walzthoeni, T.; Kahraman, A.; Herzog, F.; Rinner, O.; Beck, M.; Aebersold, R., Probing Native Protein Structures by Chemical Cross-linking, Mass Spectrometry, and Bioinformatics. Mol. Cell. Proteomics 2010,9 (8), 1634-1649.
71. Woodward, C.; Simon, I.; Tüchsen, E., Hydrogen exchange and the dynamic structure of proteins. Mol. Cell. Biochem. 1982,48, 135-160.
72. Chalmers, M. J.; Busby, S. A.; Pascal, B. D.; Southern, M. R.; Griffin, P. R., A Two-Stage Differential Hydrogen Deuterium Exchange Method for the Rapid Characterization of Protein/Ligand Interactions. J. Biomol. Techniques 2007,18, 194-204.
73. Rand, K. D.; Adams, C. M.; Zubarev, R. A.; Jørgensen, T. J. D., Electron Capture Dissociation Proceeds with a Low Degree of Intramolecular Migration of Peptide Amide Hydrogens. J. Am. Chem. Soc. 2008,130, 1341-1349.