c
Owned by the authors, published by EDP Sciences, 2016
B physics and Quarkonia in CMS
Sara Fiorendi1,aon behalf of the CMS Collaboration
1Università degli Studi di Milano - Bicocca and INFN
Abstract.The heavy-flavor sector offers the opportunity to perform indirect tests of
be-yond the Standard Model physics through precision measurements and of quantum chro-modynamics (QCD) through particle production studies. A review of recent measure-ments on heavy flavors from the CMS experiment is presented. Results are based on data collected during LHC Run I and Run II and include measurements of heavy flavor production and properties, rare decays, CP violation, exotic and standard quarkonia.
1 Introduction
The heavy flavor program of the CMS experiment [1] at the CERN LHC is very competitive and diff
er-entiated. The main objectives include testing the Standard Model (SM) predictions via high precision measurements of heavy flavor properties (decay rates, lifetimes, CP violation) and production spectra, searching for new exotic quarkonia states, new hadrons and indications of new physics through rare decay studies. Selected recent results, based on data collected at 8 and 13 TeV, are reviewed in this Letter.
2 Measurement of B
+production cross section at 13 TeV
The CMS measurement of the B+production cross section at 13 TeV [6] provides a test of theoretical calculations, complementing the measurements carried out at 7 and 8 TeV by the CMS [3], LHCb [4, 5] and ATLAS [2] Collaborations.
The inclusive B+differential production cross sections as a function of the B+meson transverse momentum and rapidity are measured using 50.8 pb−1of data collected in 2015 with 50 ns bunch
spac-ing. The measurement is based on the inclusive channel pp→B+X→J/ψK+X, where J/ψ→µ+µ−,
and covers the phase space region where 10 <pB
T <100 GeV and|yB| <2.4. Data have been
col-lected using a displaced dimuon trigger path, which requires two muons coming from the same vertex and with invariant mass compatible with the J/ψone. Candidate B+ mesons are reconstructed by combining a J/ψwith an additional track, assumed to be a kaon.
The detection efficiency and geometrical acceptance are evaluated through a Monte Carlo
simula-tion, while trigger and reconstruction efficiencies are measured directly from data.
The signal yield is extracted with an extended unbinned maximum likelihood fit to the invariant mass distribution of the B+candidates, in each pB
Tor|yB|bins. The signal component is modeled by
the sum of two Gaussians functions, while the combinatorial background component is described by an exponential function. The background from mis-reconstructed B→J/ψK+X decays is modeled by an error function.
Systematic uncertainties have been evaluated on signal yield extraction, pTand y resolution, pBT
and|yB|simulated distributions, B+lifetime, trigger and muon/track reconstruction, size of the simu-lation, and luminosity measurement.
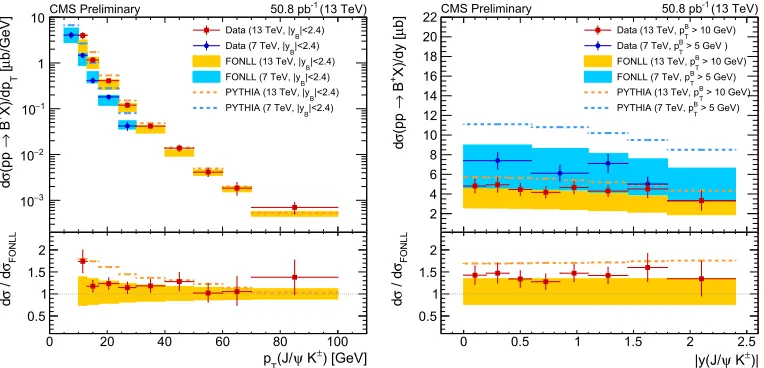
Results for the differential cross sections as a function of pBT, integrated within |yB|<2.4, and
as a function of|yB|, integrated within 10<pB
T <100 GeV, are shown in Fig. 1, together with the
corresponding 7 TeV measurements [3]. FONLL (shaded boxes) and PYTHIA (dashed lines) cal-culations are also reported on the plots, showing reasonable agreement both in terms of shape and normalization.
0 20 40 60 80 100
b/GeV]
µ
[ T
X)/dp
+
B
→
(pp
σ
d
3
−
10
2
−
10
1
−
10 1 10
|<2.4) B Data (13 TeV, |y
|<2.4) B Data (7 TeV, |y
|<2.4) B FONLL (13 TeV, |y
|<2.4) B FONLL (7 TeV, |y
|<2.4) B PYTHIA (13 TeV, |y
|<2.4) B PYTHIA (7 TeV, |y
CMS Preliminary 50.8 pb-1 (13 TeV)
) [GeV]
±
K
ψ
(J/ T p
0 20 40 60 80 100
FONLL
σ
/ d
σ
d
0.5 1 1.5
2 0 0.5 1 1.5 2 2.5
b]
µ
X)/dy [
+
B
→
(pp
σ
d
2 4 6 8 10 12 14 16 18 20 22
> 10 GeV) B T Data (13 TeV, p
> 5 GeV ) B T Data (7 TeV, p
> 10 GeV) B T FONLL (13 TeV, p
> 5 GeV) B T FONLL (7 TeV, p
> 10 GeV) B T PYTHIA (13 TeV, p
> 5 GeV) B T PYTHIA (7 TeV, p
CMS Preliminary 50.8 pb-1 (13 TeV)
)|
±
K
ψ
|y(J/
0 0.5 1 1.5 2 2.5
FONLL
σ
/ d
σ
d
0.5 1 1.5 2
Figure 1. B+differential production cross sections at 13 TeV as a function of pB
T for|yB|< 2.4, and rapidity for 10<pB
T <100 GeV. The previous CMS measurements from 7 TeV data [3] (circles) are also shown. The vertical bars show the total uncertainty in the measured cross sections, and the horizontal bars represent the bin width. The calculations from FONLL and PYTHIA are shown as shaded boxes and dashed lines, respectively. The bottom panels display the ratio of the data at 13 TeV to the FONLL predictions (points) and the ratios of the PYTHIA to the FONLL calculations (dashed lines), with the shaded region displaying the uncertainties in the FONLL predictions.
3 Quarkonium production cross section at 13 TeV
Precise measurements of cross sections and polarizations for five quarkonium states (J/ψ, ψ(2S), Y(nS)) were provided by the LHC experiments already during Run I [7–16]. Measurements at 13 TeV offer an interesting opportunity to test Non-Relativistic QCD at higher
energies and extend the comparison to theoretical calculations to higher pTranges.
The analysis [17] is based on data collected in 2015, corresponding to an integrated luminosity of 2.4 fb−1 for J/ψ, and 2.7 fb−1for the other mesons. Quarkonium states are reconstructed through
their decay into two opposite-sign muons. The measurement is restricted to the central region, where
the sum of two Gaussians functions, while the combinatorial background component is described by an exponential function. The background from mis-reconstructed B→J/ψK+X decays is modeled by an error function.
Systematic uncertainties have been evaluated on signal yield extraction, pT and y resolution, pBT
and|yB|simulated distributions, B+lifetime, trigger and muon/track reconstruction, size of the simu-lation, and luminosity measurement.
Results for the differential cross sections as a function of pBT, integrated within |yB|<2.4, and
as a function of|yB|, integrated within 10<pB
T <100 GeV, are shown in Fig. 1, together with the
corresponding 7 TeV measurements [3]. FONLL (shaded boxes) and PYTHIA (dashed lines) cal-culations are also reported on the plots, showing reasonable agreement both in terms of shape and normalization.
0 20 40 60 80 100
b/GeV] µ [T X)/dp + B → (pp σ d 3 − 10 2 − 10 1 − 10 1 10 |<2.4) B Data (13 TeV, |y
|<2.4) B Data (7 TeV, |y
|<2.4) B FONLL (13 TeV, |y
|<2.4) B FONLL (7 TeV, |y
|<2.4) B PYTHIA (13 TeV, |y
|<2.4) B PYTHIA (7 TeV, |y
CMS Preliminary 50.8 pb-1 (13 TeV)
) [GeV] ± K ψ (J/ T p
0 20 40 60 80 100
FONLL σ / d σ d 0.5 1 1.5
2 0 0.5 1 1.5 2 2.5
b] µ X)/dy [ + B → (pp σ d 2 4 6 8 10 12 14 16 18 20 22
> 10 GeV) B T Data (13 TeV, p
> 5 GeV ) B T Data (7 TeV, p
> 10 GeV) B T FONLL (13 TeV, p
> 5 GeV) B T FONLL (7 TeV, p
> 10 GeV) B T PYTHIA (13 TeV, p
> 5 GeV) B T PYTHIA (7 TeV, p
CMS Preliminary 50.8 pb-1 (13 TeV)
)|
±
K
ψ
|y(J/
0 0.5 1 1.5 2 2.5
FONLL σ / d σ d 0.5 1 1.5 2
Figure 1. B+differential production cross sections at 13 TeV as a function of pB
T for|yB| <2.4, and rapidity for 10<pB
T <100 GeV. The previous CMS measurements from 7 TeV data [3] (circles) are also shown. The vertical bars show the total uncertainty in the measured cross sections, and the horizontal bars represent the bin width. The calculations from FONLL and PYTHIA are shown as shaded boxes and dashed lines, respectively. The bottom panels display the ratio of the data at 13 TeV to the FONLL predictions (points) and the ratios of the PYTHIA to the FONLL calculations (dashed lines), with the shaded region displaying the uncertainties in the FONLL predictions.
3 Quarkonium production cross section at 13 TeV
Precise measurements of cross sections and polarizations for five quarkonium states (J/ψ, ψ(2S), Y(nS)) were provided by the LHC experiments already during Run I [7–16]. Measurements at 13 TeV offer an interesting opportunity to test Non-Relativistic QCD at higher
energies and extend the comparison to theoretical calculations to higher pTranges.
The analysis [17] is based on data collected in 2015, corresponding to an integrated luminosity of 2.4 fb−1 for J/ψ, and 2.7 fb−1for the other mesons. Quarkonium states are reconstructed through
their decay into two opposite-sign muons. The measurement is restricted to the central region, where
|ηµµ|<1.25.
The acceptance is evaluated through simulated samples, assuming unpolarized dimuons. Muon reconstruction, identification and trigger efficiencies and dimuon efficiency are measured on data as a
function of muon (dimuon) pTand pseudorapidity.
Yields are extracted through an unbinned maximum likelihood fit to the dimuon invariant mass distribution. The three Y(nS) signal peaks are modeled by Crystal Ball functions, and the background is described by an exponential distribution. For Charmonium states, the additional non-prompt com-ponent, originating from b-hadron decays, is taken into account. A simultaneous fit to mass and pseudo proper-decay-length distributions is used to disentangle the amount of prompt and non-prompt mesons.
Systematic uncertainties on dimuon acceptance and efficiencies, determination of the signal yields
and luminosity measurement are evaluated.
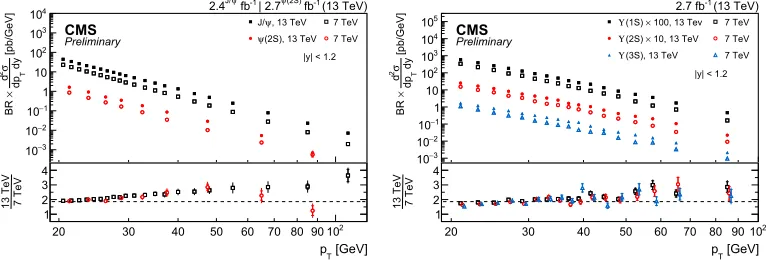
Cross section results for the J/ψandψ(2S) states are shown in the left plot of Fig. 2 as a function of the dimuon pT, together with the corresponding 7 TeV measurements, for the rapidity-integrated
range|y| <1.2. The right plot shows the cross section measurements for the Y(nS) states. The 13 TeV
cross sections of all five quarkonium states are factors of 2 to 3 larger than the corresponding 7 TeV cross sections, with slow changes as a function of the dimuon pT.
[pb/GeV] dyT dp σ 2d × BR 3 − 10 2 − 10 1 − 10 1 10 2 10 3 10 4 10 [GeV] T p 20 30 40 50 60 70 80 90102
7 TeV 13 TeV 1 2 3 4
, 13 TeV
ψ
J/ 7 TeV (2S), 13 TeV
ψ 7 TeV
CMS Preliminary (13 TeV) -1 fb (2S) ψ | 2.7 -1 fb ψ J/ 2.4
|y| < 1.2 [pb/GeV] dyT dp σ 2d × BR 3 − 10 2 − 10 1 − 10 1 10 2 10 3 10 4 10 5 10 [GeV] T p
20 30 40 50 60 70 80 90102
7 TeV 13 TeV 1 2 3 4
100, 13 Tev
×
(1S)
Υ 7 TeV
10, 13 TeV
×
(2S)
Υ 7 TeV
(3S), 13 TeV
Υ 7 TeV
CMS Preliminary
(13 TeV)
-1
2.7 fb
|y| < 1.2
Figure 2.Differential cross sections times branching ratios for 7 TeV and 13 TeV CMS data [17], for J/ψand
ψ(2S) (left) and Y(nS) (right), for|y| <1.2. The inner error bars represent the statistical uncertainty while the
total errors show the statistical and systematic uncertainties. The uncertainty on the luminosity measurement is not included in the plots.
4 Observation of Y(1S) pair production
The first observation of the simultaneous production of Y(1S) pairs has been reported by CMS in [18]. Measurements of the production of quarkonium pairs are considered the first step in the search for tetra-quark states. Though the event yield of this observation is limited, future measurements with higher statistics can provide information on the production mechanism (Single or Double Parton Scattering).
The analysis is based on 20.7 fb−1 of data collected in 2012 at √s=8 TeV. Events are selected
by requiring four muons with zero total charge, each muon having pT>3.5 GeV. Each Y candidate
is reconstructed by performing a kinematic fit to the oppositely charged muon pairs and requiring a minimum vertex fitχ2probability. Two kinematic variables are defined: the dimuon invariant mass of the higher mass Y candidate, M1
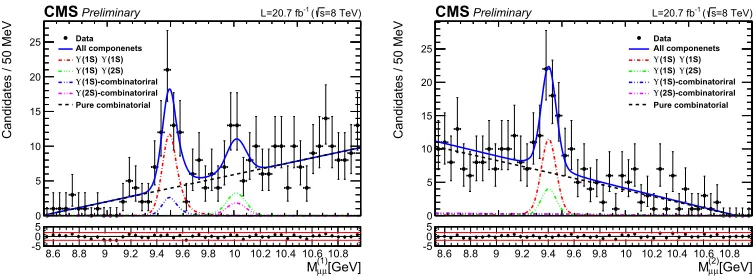
The signal yields of Y(1S)Y(1S) and Y(1S)Y(2S) are extracted through a two-dimensional un-binned maximum likelihood fit to M1
µµ and M2µµ (Fig. 3). The invariant mass distribution of each muon pair is modeled by a signal and background component, the signal model consisting in the sum of two Crystal Ball functions, and the background in a first order Chebychev Polynomial. The sig-nal yield of Y(1S)Y(1S) is measured to be 38±7 events and the statistical significance for pp →
Y(1S)Y(1S) production is determined to be 9.6 standard deviations.
The inclusive cross section is measured in the region|y(Y)| <2.0 and pT(Y)<50 GeV. Efficiency
and acceptance corrections are evaluated on an event-by-event basis using data-embedding methods to minimize the possible model dependence. Several sources of systematic uncertainties have been considered: shape of the signal model, uncertainties on trigger and reconstruction efficiency and
ac-ceptance, luminosity measurement.
Assuming isotropic Y(1S) decays into muons, the total cross section of Y(1S) pair production is measured to beσT = 68.8 ±12.7 (stat) ± 7.4 (syst)± 2.8 (BR) pb. It is also measured that extreme polarization scenarios could vary the results by+36% (100% longitudinal polarization) or
-38% (100% transverse polarization).
Candidates / 50 MeV
0 5 10 15 20
25 Data
All componenets (1S)
Υ
(1S)
Υ
(2S)
Υ
(1S)
Υ
(1S)-combinatoriral
Υ
(2S)-combinatoriral
Υ
Pure combinatorial
=8 TeV) s ( -1 L=20.7 fb
CMSPreliminary
[GeV]
(1)
µ µ
M 8.6 8.8 9 9.2 9.4 9.6 9.8 10 10.2 10.4 10.6 10.8 -50
5
Candidates / 50 MeV
0 5 10 15 20
25 DataAll componenets
(1S)
Υ
(1S)
Υ
(2S)
Υ
(1S)
Υ
(1S)-combinatoriral
Υ
(2S)-combinatoriral
Υ
Pure combinatorial
=8 TeV) s ( -1 L=20.7 fb
CMSPreliminary
[GeV]
(2)
µ µ
M 8.6 8.8 9 9.2 9.4 9.6 9.8 10 10.2 10.4 10.6 10.8 -50
5
Figure 3.Projections of the two dimensional fit to M1
µµ(left) and M2µµ(right). The lower pads show the difference
between the total fit curve and data, with red lines corresponding to a difference of±2 standard deviations.
5 Angular analysis of
B
0→
K
∗0µ
+µ
−The flavor-changing neutral-current decay B0→K∗0µ+µ−, highly suppressed in the SM, is
particu-larly sensitive to new physics contributions. They could reveal themselves through modifications of the decay properties, such as the branching fraction, muon forward-backward asymmetry (AFB) and
longitudinal polarization fraction of theK∗0 (F
L). These physical parameters are measured by the
CMS Collaboration on a 20.5 fb−1data sample collected at 8 TeV [19]. The decays B0→J/ψK∗0and
B0 →ψ(2S)K∗0are used as control channels.
The B0→K∗0µ+µ− decay is fully described by three angles (the helicity angle for the dimuon
system,θL, the helicity angle of the K∗0 candidate,θK, and the angle between the K∗0 and dimuon planes,φ) and the dimuon invariant mass squared (q2). The results of the analysis are extracted from
unbinned extended maximum likelihood fits, in bins ofq2, to the invariant mass of the B0candidate
and the two anglesθK andθL. In Fig. 4 the results are compared with two sets of SM predictions [20–22], which differ in the calculation of the form factors. Good agreement is observed between data
The signal yields of Y(1S)Y(1S) and Y(1S)Y(2S) are extracted through a two-dimensional un-binned maximum likelihood fit to M1
µµ and M2µµ (Fig. 3). The invariant mass distribution of each muon pair is modeled by a signal and background component, the signal model consisting in the sum of two Crystal Ball functions, and the background in a first order Chebychev Polynomial. The sig-nal yield of Y(1S)Y(1S) is measured to be 38±7 events and the statistical significance for pp→
Y(1S)Y(1S) production is determined to be 9.6 standard deviations.
The inclusive cross section is measured in the region|y(Y)| <2.0 and pT(Y)<50 GeV. Efficiency
and acceptance corrections are evaluated on an event-by-event basis using data-embedding methods to minimize the possible model dependence. Several sources of systematic uncertainties have been considered: shape of the signal model, uncertainties on trigger and reconstruction efficiency and
ac-ceptance, luminosity measurement.
Assuming isotropic Y(1S) decays into muons, the total cross section of Y(1S) pair production is measured to beσT = 68.8 ±12.7 (stat) ± 7.4 (syst)± 2.8 (BR) pb. It is also measured that extreme polarization scenarios could vary the results by+36% (100% longitudinal polarization) or
-38% (100% transverse polarization).
Candidates / 50 MeV
0 5 10 15 20
25 Data
All componenets (1S)
Υ
(1S)
Υ
(2S)
Υ
(1S)
Υ
(1S)-combinatoriral
Υ
(2S)-combinatoriral
Υ
Pure combinatorial
=8 TeV) s ( -1 L=20.7 fb
CMSPreliminary
[GeV]
(1)
µ µ
M 8.6 8.8 9 9.2 9.4 9.6 9.8 10 10.2 10.4 10.6 10.8 -50
5
Candidates / 50 MeV
0 5 10 15 20
25 DataAll componenets
(1S)
Υ
(1S)
Υ
(2S)
Υ
(1S)
Υ
(1S)-combinatoriral
Υ
(2S)-combinatoriral
Υ
Pure combinatorial
=8 TeV) s ( -1 L=20.7 fb
CMSPreliminary
[GeV]
(2)
µ µ
M 8.6 8.8 9 9.2 9.4 9.6 9.8 10 10.2 10.4 10.6 10.8 -50
5
Figure 3.Projections of the two dimensional fit to M1
µµ(left) and M2µµ(right). The lower pads show the difference
between the total fit curve and data, with red lines corresponding to a difference of±2 standard deviations.
5 Angular analysis of
B
0→
K
∗0µ
+µ
−The flavor-changing neutral-current decay B0 →K∗0µ+µ−, highly suppressed in the SM, is
particu-larly sensitive to new physics contributions. They could reveal themselves through modifications of the decay properties, such as the branching fraction, muon forward-backward asymmetry (AFB) and
longitudinal polarization fraction of theK∗0 (F
L). These physical parameters are measured by the
CMS Collaboration on a 20.5 fb−1data sample collected at 8 TeV [19]. The decays B0 →J/ψK∗0and
B0→ψ(2S)K∗0are used as control channels.
The B0 →K∗0µ+µ− decay is fully described by three angles (the helicity angle for the dimuon
system,θL, the helicity angle of the K∗0 candidate,θK, and the angle between the K∗0 and dimuon planes,φ) and the dimuon invariant mass squared (q2). The results of the analysis are extracted from
unbinned extended maximum likelihood fits, in bins ofq2, to the invariant mass of the B0candidate
and the two anglesθK andθL. In Fig. 4 the results are compared with two sets of SM predictions [20–22], which differ in the calculation of the form factors. Good agreement is observed between data
and theoretical calculations.
Figure 4. Results of the measurement of AFB, FL and the differential branching fraction versus the dimuon
q2. The inner error bars on data points represent the statistical uncertainty, while the total errors show the total uncertainty. The gray shaded regions correspond to the J/ψandψ(2S) resonances. Two sets of Standard Model predictions [20–22] are also shown.
6 Measurement of
φ
sand
∆Γ
sThe interference between direct Bs decays to J/ψφ and decays through B0s− ¯B0s mixing gives rise
to the CP violating weak phaseφs. The SM predictions forφs are very precise, so any measured deviation would be an indication of new physics contributions.
The decay Bs→J/ψΦ(1020)→µ+µ−K+K−is exploited to measureφsand the decay-width dif-ference∆Γs between light and heavy Bsmass eigenstates [23]. A time-dependent and flavor-tagged
angular analysis is used to disentangle the CP-odd and CP-even components of the final state. Three angles are defined to describe the decay: θT (φT) is the polar (azimuthal) angle defined by theµ+in theJ/ψrest frame, while the helicity angleψT is the angle of the K+in theΦ(1020) rest frame with respect to the negative J/ψmomentum direction. The flavor of each Bscandidate at production time
is determined with an opposite-side lepton tagging algorithm.
An unbinned maximum likelihood fit to the data is performed by including the information on the Bsinvariant mass, the three decay angles, the flavor tag decision, the proper decay time ct and its
uncertainty.
The analysis is performed on a 20 fb−1 dataset collected at 8 TeV. The measured values forφ
plot shows the combination of the results from different experiments, as provided by the HFAG group [24].
[rad] s
φ -0.5 -0.4 -0.3 -0.2 -0.1 0 0.1 0.2 0.3 0.4 0.5
]
-1
[pss
Γ∆
0 0.02 0.04 0.06 0.08 0.1 0.12 0.14 0.16 0.18 0.2
CMS
(8 TeV) -1 19.7 fb
68% CL 90% CL 95% CL Standard Model CMS central value
0.4 0.2 0.0 0.2 0.4 0.06
0.08 0.10 0.12 0.14
ATLAS 19.2 fb1
CMS 19.7 fb1
CDF 9.6 fb1
DØ 8 fb1
SM
68% CL contours
( )
b
HFAG
Spring 2016
LHCb 3 f 1
Combined
Figure 5. Left: φsand∆Γsas measured by CMS [23], together with 68%, 90%, and 95% CL contours. SM
predictions are also shown. Right: individual 68% confidence-level contours of ATLAS, CMS, CDF, D0 and LHCb measurements, in the (φccss ,∆Γs) plane [24]. Their combined contour (solid line and shaded area), and the
Standard Model predictions (thin black rectangle) are also shown.
7 Conclusions
The Run II of the LHC will provide a significant statistics of heavy flavor events, improving the sensitivity reach of many analyses. The first results from CMS on 13 TeV data have been summarized in this Letter, together with selected measurements carried out on Run I data.
References
[1] S. Chatrchyan et al. [CMS Collaboration], JINST 3 (2008) S08004. doi:10.1088/ 1748-0221/3/08/S08004
[2] G. Aadet al. [ATLAS Collaboration], JHEP 1310, 042 (2013) doi:10.1007/JHEP10(2013)042 [arXiv:1307.0126 [hep-ex]].
[3] V. Khachatryan et al. [CMS Collaboration], Phys. Rev. Lett. 106, 112001 (2011) doi:10.1103/PhysRevLett.106.112001 [arXiv:1101.0131 [hep-ex]].
[4] R. Aaijet al. [LHCb Collaboration], JHEP 1204, 093 (2012) doi:10.1007/JHEP04(2012)093 [arXiv:1202.4812 [hep-ex]].
[5] R. Aaijet al. [LHCb Collaboration], JHEP 1308, 117 (2013) doi:10.1007/JHEP08(2013)117 [arXiv:1306.3663 [hep-ex]].
[6] CMS Collaboration, CMS-PAS-BPH-15-004, https://cds.cern.ch/record/2114806
[7] V. Khachatryan et al. [CMS Collaboration], Phys. Rev. D 83, 112004 (2011) doi:10.1103/PhysRevD.83.112004 [arXiv:1012.5545 [hep-ex]].
plot shows the combination of the results from different experiments, as provided by the HFAG group [24].
[rad] s
φ -0.5 -0.4 -0.3 -0.2 -0.1 0 0.1 0.2 0.3 0.4 0.5
]
-1
[pss
Γ∆
0 0.02 0.04 0.06 0.08 0.1 0.12 0.14 0.16 0.18 0.2
CMS
(8 TeV) -1 19.7 fb
68% CL 90% CL 95% CL Standard Model CMS central value
0.4 0.2 0.0 0.2 0.4 0.06
0.08 0.10 0.12 0.14
ATLAS 19.2 fb1
CMS 19.7 fb1
CDF 9.6 fb1
DØ 8 fb1
SM
68% CL contours
( )
b
HFAG
Spring 2016
LHCb 3 f 1
Combined
Figure 5. Left: φsand∆Γsas measured by CMS [23], together with 68%, 90%, and 95% CL contours. SM
predictions are also shown. Right: individual 68% confidence-level contours of ATLAS, CMS, CDF, D0 and LHCb measurements, in the (φccss ,∆Γs) plane [24]. Their combined contour (solid line and shaded area), and the
Standard Model predictions (thin black rectangle) are also shown.
7 Conclusions
The Run II of the LHC will provide a significant statistics of heavy flavor events, improving the sensitivity reach of many analyses. The first results from CMS on 13 TeV data have been summarized in this Letter, together with selected measurements carried out on Run I data.
References
[1] S. Chatrchyan et al. [CMS Collaboration], JINST 3 (2008) S08004. doi:10.1088/ 1748-0221/3/08/S08004
[2] G. Aadet al.[ATLAS Collaboration], JHEP 1310, 042 (2013) doi:10.1007/JHEP10(2013)042 [arXiv:1307.0126 [hep-ex]].
[3] V. Khachatryan et al. [CMS Collaboration], Phys. Rev. Lett. 106, 112001 (2011) doi:10.1103/PhysRevLett.106.112001 [arXiv:1101.0131 [hep-ex]].
[4] R. Aaijet al. [LHCb Collaboration], JHEP 1204, 093 (2012) doi:10.1007/JHEP04(2012)093 [arXiv:1202.4812 [hep-ex]].
[5] R. Aaijet al. [LHCb Collaboration], JHEP 1308, 117 (2013) doi:10.1007/JHEP08(2013)117 [arXiv:1306.3663 [hep-ex]].
[6] CMS Collaboration, CMS-PAS-BPH-15-004, https://cds.cern.ch/record/2114806
[7] V. Khachatryan et al. [CMS Collaboration], Phys. Rev. D 83, 112004 (2011) doi:10.1103/PhysRevD.83.112004 [arXiv:1012.5545 [hep-ex]].
[8] S. Chatrchyan et al. [CMS Collaboration], Phys. Lett. B 727, 101 (2013) doi:10.1016/j.physletb.2013.10.033 [arXiv:1303.5900 [hep-ex]].
[9] V. Khachatryan et al. [CMS Collaboration], Phys. Rev. Lett. 114, no. 19, 191802 (2015) doi:10.1103/PhysRevLett.114.191802 [arXiv:1502.04155 [hep-ex]].
[10] V. Khachatryan et al. [CMS Collaboration], Phys. Lett. B 749, 14 (2015) doi:10.1016/j.physletb.2015.07.037 [arXiv:1501.07750 [hep-ex]].
[11] G. Aad et al. [ATLAS Collaboration], Phys. Rev. D 87, no. 5, 052004 (2013) doi:10.1103/PhysRevD.87.052004 [arXiv:1211.7255 [hep-ex]].
[12] R. Aaijet al.[LHCb Collaboration], Eur. Phys. J. C72, 2100 (2012) doi:10.1140/epjc/ s10052-012-2100-4 [arXiv:1204.1258 [hep-ex]].
[13] R. Aaijet al.[LHCb Collaboration], Eur. Phys. J. C72, 2025 (2012) doi:10.1140/epjc/ s10052-012-2025-y [arXiv:1202.6579 [hep-ex]].
[14] S. Chatrchyan et al. [CMS Collaboration], Phys. Rev. Lett. 110, no. 8, 081802 (2013) doi:10.1103/PhysRevLett.110.081802 [arXiv:1209.2922 [hep-ex]].
[15] S. Chatrchyan et al. [CMS Collaboration], Phys. Lett. B 727, 381 (2013) doi:10.1016/j.physletb.2013.10.055 [arXiv:1307.6070 [hep-ex]].
[16] R. Aaij et al. [LHCb Collaboration], Eur. Phys. J. C 73, no. 11, 2631 (2013) doi:10.1140/epjc/s10052-013-2631-3 [arXiv:1307.6379 [hep-ex]].
[17] CMS Collaboration, CMS-PAS-BPH-15-005, http://cds.cern.ch/record/2145411 [18] CMS Collaboration, CMS-PAS-BPH-14-008, http://cds.cern.ch/record/2154307
[19] V. Khachatryan et al. [CMS Collaboration], Phys. Lett. B 753 (2016) 424 doi:10.1016/j.physletb.2015.12.020 [arXiv:1507.08126 [hep-ex]].
[20] C. Bobeth, G. Hiller and D. van Dyk, JHEP1007, 098 (2010) doi:10.1007/JHEP07(2010)098 [arXiv:1006.5013 [hep-ph]].
[21] C. Bobeth, G. Hiller and D. van Dyk, Phys. Rev. D87, no. 3, 034016 (2013) [Phys. Rev. D87, 034016 (2013)] doi:10.1103/PhysRevD.87.034016 [arXiv:1212.2321 [hep-ph]].
[22] C. Bobeth, G. Hiller, D. van Dyk and C. Wacker, JHEP 1201 (2012) 107 doi:10.1007/JHEP01(2012)107 [arXiv:1111.2558 [hep-ph]].
[23] V. Khachatryan et al. [CMS Collaboration], Phys. Lett. B 757, 97 (2016) doi:10.1016/j.physletb.2016.03.046 [arXiv:1507.07527 [hep-ex]].

![Figure 5. Left:predictions are also shown. Right: individual 68% confidence-level contours of ATLAS, CMS, CDF, D0 andLHCb measurements, in the ( φs and ∆Γs as measured by CMS [23], together with 68%, 90%, and 95% CL contours](https://thumb-us.123doks.com/thumbv2/123dok_us/8069427.1345726/6.482.68.425.125.275/predictions-individual-condence-contours-andlhcb-measurements-measured-contours.webp)
