1322 | P a g e
Smart Meter Data Analytics using Hadoop
Ashu Bhardwaj
1, Dr. Williamjeet Singh
21
Research Scholar, Department of Computer Engineering, Punjabi University Patiala, (India)
2
Assistant Professor, Department of Computer Engineering,
Punjabi University Patiala, (India)
ABSTRACT
Smart meter data analytics contain 15-minute meter data sets that are used to identify possible values comes
from the data. A Smart meter records the information that contains the consumption of electric energy in
intervals of a short time period. To collect and process the voluminous data is difficult with traditional database
system so to solve big data problem Hadoop used. Energy distribution companies can reduce the cost because
Hadoop runs on commodity hardware. Meter data analytics helps to detect the missed values in the dataset so
predict the accurate result in data set, identify the peak and off peak patterns, and also identify the energy
consumption patterns per day, weekly and monthly. All these analyses are done on the dataset that present by
the visualization method.
Keywords-
Hadoop,
Meter Data Analytics, Meter Data Management, Smart Grid, Smart Meter
I. INTRODUCTION
Government and the private sector are investing millions of rupees to build the smart grid infrastructure that saves energy, reduce a cost of the system, and also increase the system reliability [1]. In the year 2012, Ministry of power, government of India selected the 14 smart grid pilot projects. These projects implemented by half of funding done by Ministry of power and other half would be collected from various state utilities [11]. The major advancement in the power system invents the smart grid. In smart grid smart meter play a major role to achieve good efficiency. In the traditional system, old meter collects the data monthly basis but a new smart meter collects the data by the interval of 15 minutes [2]. This short interval data provide more granular detail of energy consumption that’s helps to design better planning for a future system. Meter data is used for the
monitoring and billing process. Meter data is generated in the type of time series data. The time series data contain the few features [2]:
The collection of data is in the huge amount of timestamp/ value pair data.
Time series data is recorded once which is rarely changed and follows the append mode only.
Data aggregation is provided greater view level of data and according to the requirement of a system. It
follows the drill down a process to give a more granular view of data.
1323 | P a g e
data analytics process collected the time series data and processing done on data for taking useful conclusion. Smart meter analytics helps to understand electricity consumption patterns, helping governments and utilities plan for future and reduce the energy consumption bills. Performing analytics on smart meter data by the conventional database is not possible because of voluminous of data and aggregation of data creates a hurdle to processing on it.
The following are the benefits of using smart meter data analytics by the different people [4, 8].
Electricity providers: According to electricity providers they will identify different types of the consumer
and predict future consumption.
Electricity consultants: According to electricity consultants they will perform virtual audits to understand
consumption patterns and finds the ways to save the electricity.
Electricity consumers: According to electricity consumers they will see the electricity usage information
around a small interval and they also obtain the advice how to change the consumption habits to reduce their bills [9].
1.1 BACKGROUND STUDY
As traditional simple analog electro-mechanical meters turn into the smart meters. In a conventional way, the recording, as well as the generation of the electricity bill was done by the manual system. On that time only a final bill at end of certain time period was handled over to the customers and that bill has no details related to usage with respect to time interval but it only carries initial reading and final reading of meter on specific time with the billed amount.
But after the coming of the smart meter in the industry, the way of doing a work is amazingly changed. Traditional database system could not handle such a huge volume of data because smart meter generates the time series data that grows in the direction of horizontal. The data grows rapidly it almost becomes impossible to use the traditional data base to store and process such a data. Traditional system has limitation not only to store the vast amount of data but also not a feature of distributed fault tolerant of the time series data.
1.2 SMART METER DATA ANALYTICS
1324 | P a g e
II. IMPLEMENTATION
The system that implemented on smart meter data is providing a result for an electricity provider. Smart meter generates a huge amount of data on a small interval basis. To handle a large amount of data by the traditional system is the difficult task so the solution of this problem solved by the Hadoop [2, 5] concept. Hadoop is open source and works on the distributed computing platform and it runs on commodity hardware. In the implementation phase, Hadoop distributed file system (HDFS) is used for storing the electricity consumption data which includes Date, Time, Active, Reactive, Apparent power, Meter number, voltage level and etc. Map Reduce programming is done on this dataset that generates a key/value pair. In this data format, key/ values are generated from hours and date basis. The results are shown in the form of visualization. NetBeans IDE 8.2 is used and Java language is used for this work.
2.1 HADOOP
We live in the age of big data, where the data volumes arise beyond the storage and processing capabilities of a single host so there are required to work with on a day-to-day basis to solve this problem. Big data comes with facing the two fundamental challenges that are how to store and work with the voluminous amount of data, and how to understand data and turn it into an actionable result. Hadoop provides a solution of the effectively storing and providing computational capabilities for substantial amounts of data. It’s a distributed system made up of a
distributed file system, and it works on the cluster of machines to parallelize and execute the programs. Most of the areas used Hadoop to address the big data needs like Yahoo!, Facebook, and Twitter.
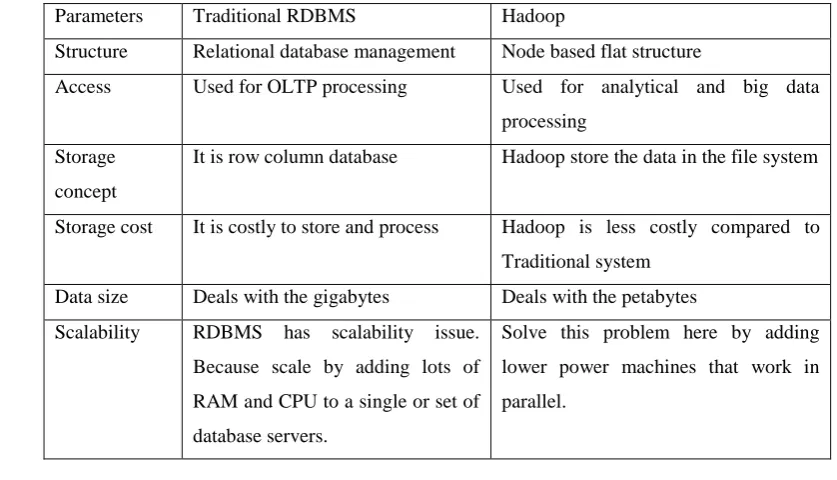
2.2 A DIFFERENCE BETWEEN TRADITIONAL RDBMS AND HADOOP
After studying the Hadoop than in the mind one question always arises that if there is already traditional system then why to choose this. Sometimes there is confusion that when to choose the traditionally and when to choose Hadoop so all these questions solve by studying the comparison between these two terminologies [2, 10]. Following Table 1 show the comparison between traditional RDBMS and Hadoop system.
Table 1 Comparison of Traditional RDBMS and Hadoop Framework
Parameters Traditional RDBMS Hadoop
Structure Relational database management Node based flat structure
Access Used for OLTP processing Used for analytical and big data processing
Storage concept
It is row column database Hadoop store the data in the file system
Storage cost It is costly to store and process Hadoop is less costly compared to Traditional system
Data size Deals with the gigabytes Deals with the petabytes
Scalability RDBMS has scalability issue. Because scale by adding lots of RAM and CPU to a single or set of database servers.
1325 | P a g e
Best situation to used
RDBMS will be more useful when looking for one record from big data
Hadoop will be useful in a case when wanting big data in one short and perform analysis on that later.
Deals with RDBMS used for the transactional system to report and archive the data
Hadoop deals with storage and process a huge volume of data in distributed file system.
Language supported
Structured query language (SQL) will be used to extract data that stored in these tables.
Hadoop framework is written in Java
Latency RDBMS can give a very fast response when the data size is ideal
Hadoop is following batch processing and results are only available after a large amount of data has been processed. So Hadoop is not ideal platform when expected for immediate result
Throughput It refers to the amount of the data is processed in the period of time. RDBMS throughput is less.
Hadoop throughput higher than the RDBMS
ACID property
It follows ACID property Hadoop nothing like ACID property exist
Manufacturers Sql Server, MySql, Oracle etc. Hadoop implementation by Cloudera, Intel, IBM, Amazon, Hortonworks Updates Read and write many times Write once and read many times
Model Data It always model the data It not model the data
Storage deployment concept
It follows the centralized concept It spread data across the servers
Velocity Handles the data that coming in low velocity
Handles the data that coming in high velocity
Sources of the data
Data is arriving from 1 or few locations
Data is arriving from the multiple locations
Deployment of structure
Deploy in the vertical fashion Deploy in horizontal fashion
Nature of the data
1326 | P a g e
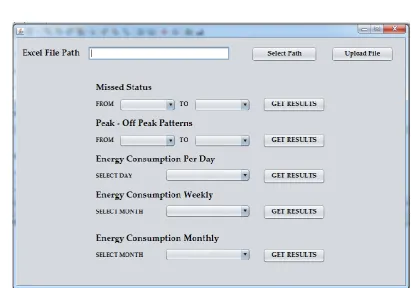
III. RESULTSIn this section, it shows the results when applying the Hadoop concept on the database. When runs the smart meter data analytics project than front view of the project is shown in Figure 1. In this view first select the path where the file exists and after select, the file goes to the upload file button. That is automatically uploading the selected file for the system. After this various analysis performs on the dataset that is [3]:
Missed Status
Peak-Off Peak Patterns
Energy Consumption per Day
Energy Consumption Weekly
Energy Consumption Monthly
Figure 1 Front end of meter data analytics
3.1 Missed Status
1327 | P a g e
In the excel sheet, ‘F’ means fail status of poll and ‘-’ shows the ok status of poll
Figure 2 Missed Read on a Particular Day
3.2 Peak-Off Peak Patterns
For making smart grid it is the critical requirement is to flatten the load curve. The benefits to flatten the load curve are cost saving on infrastructure, energy savings due to reducing the grid losses. The consumption pattern of electricity usage has enabled the utility to design the time of the tariff. To get the result select the range according to date after this step it shows the result. Figure 3 shows the peak and off peak patterns of the grid. From a consumer point of view, this study helps to predict at what hour of time energy usages is high. The energy usage is high in the tariff of the day then it will increase the bill to manage this problem by applying fewer loads on that time interval.
Figure 3 Peak Vs off Peak patterns
3.3 Energy Consumption per Day
1328 | P a g e
Figure 4 snapshot of daily energy consumption on a day basisFor better energy management this information helps to consumers. To get the result select the date from drop down list. A typical consumption pattern of a consumer on a particular day collected through smart meter shown in below Figure 4. Energy consumption varies daily due to certain reasons likeweatherchanges, occupancy, and different consumer’s consumption behavior toward electricity use [7]. For the customer’s point of view to see
the energy consumption on daily basis helps for increasing the security and decreases the energy consumption bill. Daily monitoring helps to consumers have exclusive information about their electricity usage behavior. An abnormal change in consumption pattern will alert to take serious action.
3.4 Energy Consumption Weekly
Further, weekly and monthly analysis of consumer consumption behavior has helped to utilities to identifies the consumption pattern in normal working days and non-working (weekend) and accordingly plan energy requirement for working days and holidays. Figure 5 shows consumption pattern of consumers in that grid during weekly.
1329 | P a g e
1.5 Energy Consumption MonthlyTraditionally energy meter recorded the energy usage by real power consumption only that means a number in terms of units read at the end of each month for the record of energy consumed
pattern
Figure 6 Snapshot of Energy consumption on the monthly basis
This process meter was not read the grained interval data so monthly energy consumption data was provided the few details on consumption [1]. With the advent of the smart meter, it records each type (Real, Active, Apparent Energy/Power) of data at the interval of minutes. Figure 6 represents the energy consumption pattern on monthly basis.
IV. CONCLUSION
Smart grid provides taking control of the electricity used by the consumer will present the new dimensions in the entire electricity system. Smart meter sends the consumption data of individual meter at the small interval of time that is generating big data at the end. To process and store this amount of data is difficult with the traditional database system. A large amount of data is required for accurate results and to process more granular data is required and to overcome the big data problems Hadoop concept is used. The Smart meter helps for planning and meeting the energy requirement of the different users. Data analytics on smart meter data helps the consumers to view their electricity consumption behavior pattern. This process helps to control their energy consumption and optimize to reduce the electricity bill by shifting the load from the day of the tariff to non-peak interval of time.
V. FUTURE WORK
1330 | P a g e
problems, first to update the previous meter with smart meter takes a cost and then second internet facility is still not present in most of the rural area.
REFERENCES:
1. Lu, Ning . "Smart Meter Data Analysis." PES T&D 2012 (2012).
2. Prasad, Srikrishna, and S B Avinash. "Smart Meter Data Analytics Using Opentsdb and Hadoop". 2013 IEEE Innovative Smart Grid Technologies-Asia (ISGT Asia) (2013).
3. Jha, I S, Subir Sen, and Vineeta Agarwal. "Advanced Metering Infrastructure Analytics- A Case Study." 2014 Eighteenth National Power Systems Conference (NPSC) (2014).
4. Liu, Xiufeng, Lukasz Golab, and Ihab F. Ilyas. "SMAS: A Smart Meter Data Analytics System". 2015 IEEE 31st International Conference on Data Engineering (2015): 1476-1479.
5. Balaji k. bodkhe, sanjay p.sood. “Analysis of smart meter data using Hadoop”. International journal of current engineering and scientific research (IJCESR). Volume 2 issue-9, 2015.
6. Shyam R, Bharathi Ganesh HB. "Apache Spark A Big Data Analytics Platform For Smart Grid". Procedia Technology 21 (2015): 171-178. DOI: 10.1016/j.protcy.2015.10.085.
7. LIU, X., GOLAB, L., GOLAB, W., ILYAS, I. F. AND JIN, S. "Smart Meter Data Analytics." ACM Transactions on Database Systems 42.1 (2016): 1-39.
8. Alahakoon, Damminda, and Xinghuo Yu. "Smart Electricity Meter Data Intelligence for Future Energy Systems: A Survey". IEEE Transactions on Industrial Informatics 12.1 (2016): Pages: 425 - 436, DOI: 10.1109/TII.2015.2414355.
9. Alahakoon, Damminda, and Xinghuo Yu. "Advanced Analytics For Harnessing The Power Of Smart Meter Big Data". 2013 IEEE International Workshop on Inteligent Energy Systems (IWIES) (2013):.Pages: 40 - 45, DOI: 10.1109/IWIES.2013.6698559
10. Joseph, Shibily, Jasmin E.A., and Soumya Chandran. "Stream Computing: Opportunities and Challenges in Smart Grid". Procedia Technology 21 (2015): 49-53. DOI 10.1016/j.protcy.2015.10.008