24
Genotype x Environment Interaction and Stability
Analysis for Yield And Quantitative Traits in Maize
(
Zea Mays
L.) Under Different Dates of Sowing
Gideon J. Synrem*
1, Shailesh Marker
2, Ibadaiahun Myrthong
3 1Department of Genetics and Plant Breeding, Sam Higginbottom University of Agriculture,
Technology and Sciences, Allahabad-211007 (India)
2
Department of Genetics and Plant Breeding, Sam Higginbottom University of Agriculture,
Technology and Sciences, Allahabad-211007 (India)
3
Department of Environmental Science, Sam Higginbottom University of Agriculture, Technology
and Sciences, Allahabad-211007, Allahabad-211007 (India)
ABSTRACT
Maize (Zea mays L.) cultivars vary in their performance and response to variable environmental conditions. Climate change is the most talked and concerned phenomena of this century, where agricultural scientists are looking for answers to maintain the ever increasing demand for food and sustainability. Hence,an experiment was conducted during kharif 2013 to evaluate 45 maize single cross hybrids and 10 parents including 3checks to study the stability parameters and G x E interaction for grain yield and yield component traits under three different environments created by the different dates of sowing at Allahabad. Among the treatments studied, early and timely sown seeds recorded the highest and positive environment index for the traits Chlorophyll content, Leaf area/ plant, Kernel rows/Cob, Number of kernels/ row and Grain yield/ plant. Analysis of variance and stability analysis were computed by Eberhart and Russell model. Variances due to genotypes, environments and G x E interaction were significant for grain yield and its related traits.Significant variance due to environments (linear) for all the traits studied indicated considerable differences among the environments and their pre-dominant effects on the traits. Grain yield and its related traits were taken into account while evaluating genotypes for stability performance over the environments. Stability analysis for grain yield indicated that six hybrids viz., CML 41 x Early yellow, CML 41 x CML 359, QPM-28 x CM 129, DMR-QPM-28 x LM-13, CM- 124 x CM 129, LM-13 x CM 129 recorded mean value higher than population mean, positive phenotypic index (Pi>1), regression coefficient near to unity (βi≈1) and non-significant deviation from regression (s2di) there by indicating its stability performance over the environments. The hybrid POP 31 Q2 x POP 445 had negative phenotypic index (Pi<1), regression coefficient near to unity (βi≈1) and non-significant deviation from regression (s2di) there by indicating its stability over all environments and suitability for early maturity. Some hybrids showed relatively good performance in one environment whereas some in other, indicating the possibility to develop environment specific hybrids.
Key words:Maize (Zea mays L.), G x E interaction, environment, stability, regression, grain yield,
25
I.INTRODUCTION
Maize or Indian corn (Zea mays L.) is the third important cereal crop of the world after wheat and rice in terms of growing area, production and grain yield [1].Among the maize growing countries, USA stands first followed by China and Brazil accounting for 35% of the total maize produced in the world. India is the sixth largest producer of maize in the world, and contributed about 2 per cent to the global maize production of 855.72 million tonnes (Mt) in 2012-13[2]. In the state of Uttar Pradesh the area and production during 2015-2016 was 0.67 m ha and 1255 mt, respectively with productivity of 1848 kg/ha, which is less compared to the center with the area and production of 8.69 mha and 21.80 mt, and productivity of 2509 kg/ha [3].
Maize has a wider range of uses than any other cereals as animal feed, human food and for hundreds of industrial purposes [4].Maize produced is used as stock feed, eg. 40% in tropical areas and up to 85 % in developed countries [5],[6].The growing demand for maize is mainly attributed to its multipurpose use and its importance in today’s world agricultural scenario.
Being a C4 plant, it is physiologically more efficient and being a photo insensitive crop, maize has wider adaptation over a range of environmental conditions [7]. Since maize is a highly cross pollinated crop it offers great scope for exploitation of heterosis by development of hybrids. But the performances of these hybrids are not the same at all the places. Hence the plant breeder has to select hybrids which perform consistently across all the environments. Hence, the study on the genotype x environment interaction for grain yield and quantitative traits in maize hybrids is of paramount importance assessing their stability grown under different environments.Phenotype (P) is the product of the genotype (G) of the individual, the environment (E) that the phenotype is exposed to and the interaction that occurs between the genotype of the individual and the environment (G x E). Genotype x environment interactions is of major importance to the scientist in developing improved varieties. When varieties are compared over a series of environments, the relative ranking usually differs. For plant breeders, large genotype by environment (G x E) interaction impede progress from selection and have important implications for testing and cultivar release programme. In fact, G x E interactions is a function of the genotype as they are of the environment and so are partly heritable [8]. Statistically, G x E interactions are detected as a significantly different pattern of response among the genotypes across environments and biologically, this will occur when the contributions (or level of expression) of the genes regulating the trait differ among environments [9]. Therefore, an ideal approach in plant breeding is to develop cultivars that have fairly uniform performance (low G x E) over a range of environments with the ability to utilize the resources in high yielding environment. When the performance of cultivars is compared across environments, several cultivar attributes are considered, of which grain yield is one of the most important [10].Wide adaption to the particular environment and consistent performance of recommended genotypes is one of the main objectives in breeding programme. A genotype is considered to be stable if it possesses an un-changed or least un-changed performance regardless of any variation in the environmental conditions. Such stability analysis in maize has been reported by many authors like [11], [12], [13].
26
II.MATERIALS AND METHODS
During Kharif 2013, forty five single cross maize hybrids developed from crossing 10 x 10 half diallel mating design,(P1, )and two hybrid checks and one composite (K-25, GA-85 and Navjyot) were evaluated at three different dates of sowing viz., Environment 1 (E1); 1st July (Early sown), Environment 2 (E2); 15th July (Timely sown) and Environment 3 (E3); 31st July (Late sown) in the field experimentation center of the Department of Genetics and Plant Breeding, Sam Higginbottom University of Agriculture, Technology and Sciences, Allahabad. The trialswere conducted in Randomized Block Design (RBD) with three replications. For raising a healthy crop, therecommended package of practices were followed and fertilizer application i.e., N:P:K@120:60:60kg/ha was applied.Data were recorded on 10 randomly selected plants for the traits;Days to 50 % tasselling, Days to 50 % silking, Days to 50% brown husk, Plant height, Cob length, Cob girth, Kernel rows per cob, Number of Kernels per row, Grain yield per plant, Biological yield per plant, Harvest index, Chlorophyll content, Leaf relative water content, Flag leaf area per plant, Leaf area per plant, Leaf area index, Leaf area ratio, Specific leaf weight and Specific leaf area. The soil analysis revealed Sandy loam type withsoil pH (7.6-7.8) which is slightly alkaline.The stability of yield performance for each genotype was calculated by regressing the mean yields of individual genotypes on environmental index and calculating the deviations from regression as suggested [14], the behavior of the cultivars was assessed by the model Yij= m +iIj+ ij+ ij,
where Yij= observation of the i-th (i = 1, 2, ..., g) cultivar in the j-th (j = 1, 2, ...n) environment, m = general
mean, i = regression coefficient, Ij= environmental index obtained by the difference among the mean of
each environment and the general mean (Ij= 0), ij= the regression deviation of the i-th cultivar in the
j-th environment and ij= effect of the mean experimental error.
III. RESULTS AND DISCUSSION
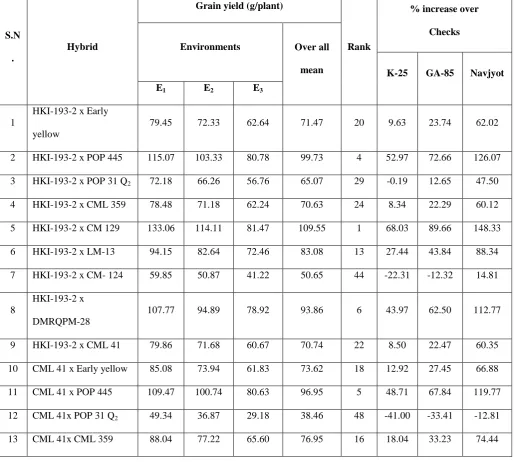
The experimental results on the basis of overall performance over three environments with respect to grain yield (g/plant), revealed 37 entries, could statistically out yield the hybrid check K-25 and GA-85, while 43 hybrids recorded highermean values over the composite checkNavjyot (Table 1). The mean grain yield of the hybrids across the environments ranged from 38.46 g/plant (CML 41x POP 31 Q2) to 109.55 g/plant(HKI-193-2 x CM 129). The top five ranked hybrids based on over all mean performance were HKI-193-2 x CM 129 (109.55 g), CM- 124 x LM-13 (108.60 g), DMR-QPM-28 x CM- 124 (102.75 g), HKI-193-2 x POP 445 (99.73 g) and CML 41 x POP 445 (96.95 g) respectively.The above top five entries also exhibited variable percent increase, 48.00 to 68.00 %over the check K-25, 67.00 to 89.00 % over GA-85and 119.00 to 148.00 %over the Composite check Navjyot.This indicated that the percentage of the genotypes varied from one environment to the other environment confirming the presence of G x Einteraction and for high yield potential a more specific breeding approach is necessary for specific environment.
27
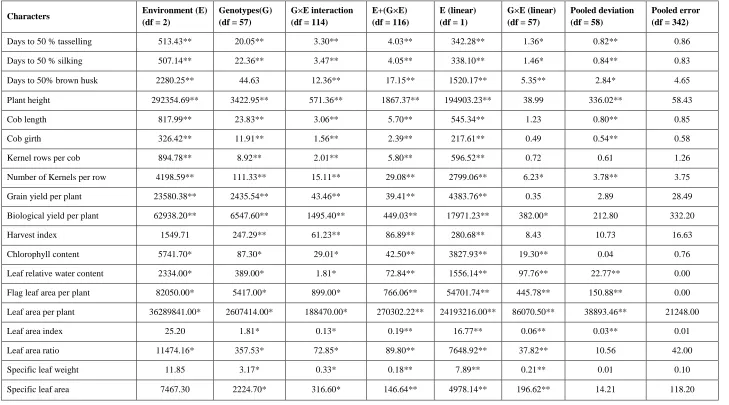
Significant variance due to environments (linear) for all the traits studied indicated considerable differences among the environments and their pre-dominant effects on the traits. This could be due to the variations in the genotypes, weather, rainfall, different dates of sowing and soil conditions over different environments. The results were well supported by the earlier findings of researcher [15].Significant pooled deviations for all the traits suggested that the deviation from linear regression also contributed substantially towards the differences in stability of hybrids thereby indicating difficulty in predicting the performance of hybrids over environments for these traits. Similar results in maize have been reported[16], [17].
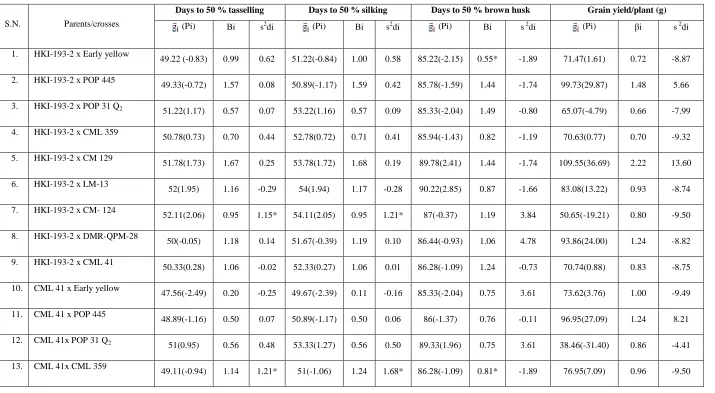
Stability analysis for grain yield indicated that six hybridsviz., CML 41 x Early yellow, CML 41 x CML 359, DMR-QPM-28 x CM 129, DMR-QPM-28 x LM-13, CM- 124 x CM 129, LM-13 x CM 129 had positive phenotypic index (Pi>1), regression coefficient near to unity (βi≈1) and non-significant deviation from regression (s2di) there by indicating its stability over all environments, therefore these hybrids were considered suitable and stable in performance in different environments for high grain yield per plant (Table 3).Theparental line P5 (CM-129) showed non-significant (s2di) and regression coefficient higher than unity (βi>1), with mean values higher than the population mean, thereby indicating that this parent is stable under favorable environments with high yield potential. The results were well supported by the findingsof earlier workers[18], [19], [20], [21].
Stability results for days to 50% tasseling and days to 50 % silking showed that out of 45 hybrids, 33 hybrids showed non-significant deviation from regression (s2di) hence their behavior was predictable, while 12 hybrids showed significant deviation from regression (s2di) there by their behavior was unstable. The hybrid HKI-193-2 x Early yellow however, showed negative phenotypic index (Pi<1), regression coefficient near to unity (βi≈1) and non-significant deviation from regression (s2di) there by indicating its stability over all environments and suitability for early tasseling and for early silking. Parental line P5 (CM 129) showed non-significant deviation from regression (s2di) and regression coefficient less than unity (βi<1), with mean values lesser than the population mean, thereby indicating its adaptability under un-favorable environments and suitable for early tasseling. Parental line P4 (CML 359) showed non-significant s2di and regression coefficient greater than unity (βi>1), with mean values lesser than the population mean, thereby indicating their adaptability under favorable environments and suitability for early tasseling and silking. Similar results were observed by earlier scientists [22], [23], [24].
28
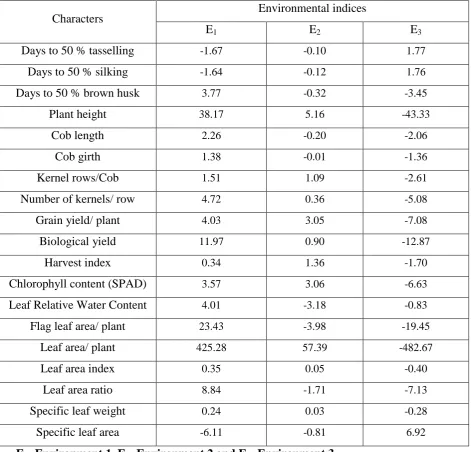
The environmental indices of the 58 genotypes for days to 50 % tasselling ranged from -1.67 in (E1) to 1.77 in (E3) while for days to 50 % silking it ranged from -1.64 in (E1) to 1.76 in (E3) indicating significant variations across the environments. While for days to 50 % brown husk environmental indices ranged from -3.45 in (E3) to 3.77 in (E1)owing to the different dates of sowing. The environmental indices for grain yield ranged from -7.08 (E3) to 4.03 (E1) indicating significant variations across the environments (Table 4). Among the treatments studied, early sown i.e. environment (E1) and timely sown i.e. environment (E2) seeds recorded the highest and positive environment index for the traits Chlorophyll content, Leaf area/ plant, Kernel rows/Cob, Number of kernels/ row and Grain yield/ plant.Highest and positive environmental index was recorded in irrigated condition [28].Hence, these traits appeared to be the most favorable for timely sown in maize.Table 1. Overall performance of maize hybrids for grain yield (g/plant) under different
Environments (E
1, E
2and E
3) during
kharif
2013
S.N
.
Hybrid
Grain yield (g/plant)
Rank
% increase over
Checks
Environments Over all
mean K-25 GA-85 Navjyot
E1 E2 E3
1
HKI-193-2 x Early
yellow
79.45 72.33 62.64 71.47 20 9.63 23.74 62.02
2 HKI-193-2 x POP 445 115.07 103.33 80.78 99.73 4 52.97 72.66 126.07
3 HKI-193-2 x POP 31 Q2 72.18 66.26 56.76 65.07 29 -0.19 12.65 47.50
4 HKI-193-2 x CML 359 78.48 71.18 62.24 70.63 24 8.34 22.29 60.12
5 HKI-193-2 x CM 129 133.06 114.11 81.47 109.55 1 68.03 89.66 148.33
6 HKI-193-2 x LM-13 94.15 82.64 72.46 83.08 13 27.44 43.84 88.34
7 HKI-193-2 x CM- 124 59.85 50.87 41.22 50.65 44 -22.31 -12.32 14.81
8
HKI-193-2 x
DMRQPM-28
107.77 94.89 78.92 93.86 6 43.97 62.50 112.77
9 HKI-193-2 x CML 41 79.86 71.68 60.67 70.74 22 8.50 22.47 60.35
10 CML 41 x Early yellow 85.08 73.94 61.83 73.62 18 12.92 27.45 66.88
11 CML 41 x POP 445 109.47 100.74 80.63 96.95 5 48.71 67.84 119.77
12 CML 41x POP 31 Q2 49.34 36.87 29.18 38.46 48 -41.00 -33.41 -12.81
29
14 CML 41x CM 129 80.13 71.65 60.37 70.72 23 8.47 22.43 60.3115 CML 41x LM-13 93.06 83.98 72.76 83.27 11 27.72 44.16 88.76
16 CML 41x CM- 124 91.48 77.65 80.54 83.22 12 27.66 44.08 88.66
17
CML 41x
DMR-QPM-28
79.33 67.81 63.78 70.31 25 7.84 21.72 59.38
18
DMR-QPM-28 x Early
yellow
68.28 60.96 51.90 60.38 37 -7.38 4.54 36.87
19
DMR-QPM-28 x POP
445
97.85 80.63 69.86 82.78 14 26.98 43.32 87.65
20
DMR-QPM-28 x POP
31 Q2
56.06 42.44 32.65 43.72 47 -32.94 -24.31 -0.90
21
DMR-QPM-28 x CML
359
69.32 59.54 48.80 59.22 38 -9.16 2.53 34.25
22
DMR-QPM-28 x CM
129
95.25 84.18 72.67 84.03 10 28.90 45.49 90.49
23 DMR-QPM-28 x LM-13 103.07 92.70 78.85 91.54 8 40.41 58.48 107.51
24
DMR-QPM-28 x CM-
124
123.73 102.90 81.62 102.75 3 57.61 77.89 132.92
25 CM- 124 x Early yellow 73.15 62.80 51.62 62.52 34 -4.10 8.25 41.73
26 CM- 124 x POP 445 64.67 53.34 42.55 53.52 41 -17.91 -7.34 21.32
27 CM- 124 x POP 31 Q2 92.03 81.68 70.84 81.52 15 25.04 41.13 84.79
28 CM- 124 x CML 359 63.08 53.66 42.67 53.14 42 -18.49 -8.00 20.45
29 CM- 124 x CM 129 85.21 72.79 62.43 73.48 19 12.71 27.21 66.56
30 CM- 124 x LM-13 132.42 112.19 81.18 108.60 2 66.58 88.01 146.18
31 LM-13 x Early yellow 73.06 63.36 53.11 63.18 30 -3.09 9.38 43.21
32 LM-13 x POP 445 110.08 92.71 77.43 93.41 7 43.28 61.72 111.74
33 LM-13 x POP 31 Q2 82.45 66.59 52.94 67.33 26 3.27 16.56 52.62
34 LM-13 x CML 359 72.03 61.86 50.69 61.53 35 -5.62 6.52 39.47
30
36 CM 129 x Early yellow 61.83 51.85 40.83 51.50 43 -21.00 -10.83 16.7537 CM 129 x POP 445 76.01 65.07 54.72 65.27 27 0.11 13.00 47.95
38 CM 129 x POP 31 Q2 74.86 62.87 50.44 62.72 33 -3.79 8.59 42.19
39 CM 129 x CML 359 104.15 91.75 75.70 90.53 9 38.87 56.74 105.23
40
CML 359 x Early
yellow
62.48 56.72 46.09 55.10 40 -15.49 -4.61 24.90
41 CML 359 x POP 445 75.59 64.33 52.44 64.12 31 -1.65 11.01 45.35
42 CML 359 x POP 31 Q2 74.45 63.59 51.05 63.03 32 -3.32 9.12 42.88
43
POP 31 Q2 x Early
yellow
59.25 49.35 37.93 48.84 45 -25.08 -15.44 10.72
44 POP 31 Q2 x POP 445 82.08 71.58 60.74 71.47 21 9.62 23.73 62.01
45 POP 445 x Early yellow 71.06 62.57 50.50 61.38 36 -5.85 6.26 39.13
46 K-25(Check 1) 76.06 65.61 53.91 65.19 28 0.00 12.87 47.79
47 GA-85(Check 2) 67.45 57.04 48.79 57.76 39 -11.40 0.00 30.94
48 Navjyot (Check 3) 56.33 42.67 33.34 44.11 46 -32.33 -23.63 0.00
Grand Mean 83.04 71.71 59.46 71.40 -
Range
49.34-
133.06
36.87-
114.11
29.18-
81.62
38.46-
109.55
-
C.V. (%) 7.83 2.50 1.50 7.60 -
S.E. 3.68 1.40 0.85 4.35 -
31
Table 2.Combined analysis of variance for stability for different characters in maize (
Zea mays
L.) over three environments
Characters Environment (E)
(df = 2)
Genotypes(G) (df = 57)
G×E interaction (df = 114)
E+(G×E) (df = 116)
E (linear) (df = 1)
G×E (linear) (df = 57)
Pooled deviation (df = 58)
Pooled error (df = 342)
Days to 50 % tasselling 513.43** 20.05** 3.30** 4.03** 342.28** 1.36* 0.82** 0.86
Days to 50 % silking 507.14** 22.36** 3.47** 4.05** 338.10** 1.46* 0.84** 0.83
Days to 50% brown husk 2280.25** 44.63 12.36** 17.15** 1520.17** 5.35** 2.84* 4.65
Plant height 292354.69** 3422.95** 571.36** 1867.37** 194903.23** 38.99 336.02** 58.43
Cob length 817.99** 23.83** 3.06** 5.70** 545.34** 1.23 0.80** 0.85
Cob girth 326.42** 11.91** 1.56** 2.39** 217.61** 0.49 0.54** 0.58
Kernel rows per cob 894.78** 8.92** 2.01** 5.80** 596.52** 0.72 0.61 1.26
Number of Kernels per row 4198.59** 111.33** 15.11** 29.08** 2799.06** 6.23* 3.78** 3.75
Grain yield per plant 23580.38** 2435.54** 43.46** 39.41** 4383.76** 0.35 2.89 28.49
Biological yield per plant 62938.20** 6547.60** 1495.40** 449.03** 17971.23** 382.00* 212.80 332.20
Harvest index 1549.71 247.29** 61.23** 86.89** 280.68** 8.43 10.73 16.63
Chlorophyll content 5741.70* 87.30* 29.01* 42.50** 3827.93** 19.30** 0.04 0.76
Leaf relative water content 2334.00* 389.00* 1.81* 72.84** 1556.14** 97.76** 22.77** 0.00
Flag leaf area per plant 82050.00* 5417.00* 899.00* 766.06** 54701.74** 445.78** 150.88** 0.00
Leaf area per plant 36289841.00* 2607414.00* 188470.00* 270302.22** 24193216.00** 86070.50** 38893.46** 21248.00
Leaf area index 25.20 1.81* 0.13* 0.19** 16.77** 0.06** 0.03** 0.01
Leaf area ratio 11474.16* 357.53* 72.85* 89.80** 7648.92** 37.82** 10.56 42.00
Specific leaf weight 11.85 3.17* 0.33* 0.18** 7.89** 0.21** 0.01 0.10
32
*Significant at 5% level of significance; **Significant at 1%level of significance.Table 3.Stability parameters for maize hybrids over three environments
S.N. Parents/crosses
Days to 50 % tasselling Days to 50 % silking Days to 50 % brown husk Grain yield/plant (g)
(Pi) Βi s2di (Pi) Βi s2di (Pi) Βi s 2di (Pi) βi s 2di
1. HKI-193-2 x Early yellow
49.22 (-0.83) 0.99 0.62 51.22(-0.84) 1.00 0.58 85.22(-2.15) 0.55* -1.89 71.47(1.61) 0.72 -8.87
2. HKI-193-2 x POP 445
49.33(-0.72) 1.57 0.08 50.89(-1.17) 1.59 0.42 85.78(-1.59) 1.44 -1.74 99.73(29.87) 1.48 5.66
3. HKI-193-2 x POP 31 Q2 51.22(1.17) 0.57 0.07 53.22(1.16) 0.57 0.09 85.33(-2.04) 1.49 -0.80 65.07(-4.79) 0.66 -7.99
4. HKI-193-2 x CML 359
50.78(0.73) 0.70 0.44 52.78(0.72) 0.71 0.41 85.94(-1.43) 0.82 -1.19 70.63(0.77) 0.70 -9.32
5. HKI-193-2 x CM 129
51.78(1.73) 1.67 0.25 53.78(1.72) 1.68 0.19 89.78(2.41) 1.44 -1.74 109.55(36.69) 2.22 13.60
6. HKI-193-2 x LM-13
52(1.95) 1.16 -0.29 54(1.94) 1.17 -0.28 90.22(2.85) 0.87 -1.66 83.08(13.22) 0.93 -8.74
7. HKI-193-2 x CM- 124
52.11(2.06) 0.95 1.15* 54.11(2.05) 0.95 1.21* 87(-0.37) 1.19 3.84 50.65(-19.21) 0.80 -9.50
8. HKI-193-2 x DMR-QPM-28
50(-0.05) 1.18 0.14 51.67(-0.39) 1.19 0.10 86.44(-0.93) 1.06 4.78 93.86(24.00) 1.24 -8.82
9. HKI-193-2 x CML 41
50.33(0.28) 1.06 -0.02 52.33(0.27) 1.06 0.01 86.28(-1.09) 1.24 -0.73 70.74(0.88) 0.83 -8.75
10. CML 41 x Early yellow
47.56(-2.49) 0.20 -0.25 49.67(-2.39) 0.11 -0.16 85.33(-2.04) 0.75 3.61 73.62(3.76) 1.00 -9.49
11. CML 41 x POP 445
48.89(-1.16) 0.50 0.07 50.89(-1.17) 0.50 0.06 86(-1.37) 0.76 -0.11 96.95(27.09) 1.24 8.21
12. CML 41x POP 31 Q2
51(0.95) 0.56 0.48 53.33(1.27) 0.56 0.50 89.33(1.96) 0.75 3.61 38.46(-31.40) 0.86 -4.41
13. CML 41x CML 359
33
14. CML 41x CM 12949.78(-0.27) 1.23 2.42* 51.78(-0.28) 1.23 2.52** 85.89(-1.48) 1.43 6.99* 70.72(0.86) 0.85 -8.79
15. CML 41x LM-13
50.67(0.62) 1.18 0.14 52.67(0.61) 1.19 0.10 89.33(1.96) 0.91 -0.50 83.27(13.41) 0.87 -9.18
16. CML 41x CM- 124
50.11(0.06) 1.25 0.39 52.11(0.05) 1.25 0.44 86.94(-0.43) 1.10 -1.37 83.22(13.36) 0.46 39.36
17. CML 41x DMR-QPM-28
49.89(-0.16) 0.87 -0.25 51.89(-0.17) 0.87 -0.24 85.44(-1.93) 0.90 0.12 70.31(0.45) 0.66 1.34
18. DMRQPM-28 x Earlyyellow
48.56(-1.49) 0.78 -0.28 50.22(-1.84) 0.79 -0.29 86(-1.37) 0.77 -1.38 60.38(-9.48) 0.70 -9.28
19. DMR-QPM-28 x POP 445
50.11(0.06) 0.49* -0.31 52.11(0.05) 0.49* -0.31 88.33(0.96) 1.13 0.92 82.78(12.92) 1.20 -0.15
20. DMR-QPM-28 x POP 31 Q2 51.11(1.06) 1.16 -0.14 53.22(1.16) 1.26 -0.21 88.89(1.52) 0.79 -1.75 43.72(-26.14) 1.00 -5.82
21. DMR-QPM-28 x CML 359
50.78(0.73) 0.38 -0.21 52.78(0.72) 0.38 -0.20 89.22(1.85) 0.44 0.48 59.22(-10.64) 0.88 -9.49
22. DMR-QPM-28 x CM 129
51.44(1.39) 1.14 1.21* 53.44(1.38) 1.14 1.28* 90(2.63) 0.52 -0.85 84.03(14.17) 0.97 -9.47
23. DMR-QPM-28 x LM-13
51.89(1.84) 1.05 0.86 54.33(2.27) 1.15 0.67 90.78(3.41) 0.38 -1.73 91.54(21.68) 1.04 -8.39
24. DMR-QPM-28 x CM- 124
49.78(-0.27) 1.07* -0.31 51.89(-0.17) 1.18 -0.30 89.33(1.96) 1.33 5.65* 102.75(32.89) 1.81 -9.29
25. CM- 124 x Early yellow
47.89(-2.16) 0.87 -0.25 49.56(-2.50) 0.87 -0.24 84.11(-3.26) 1.27 0.66 62.52(-7.34) 0.92 -9.50
26. CM- 124 x POP 445
49(-1.05) 1.16 -0.29 51(-1.06) 1.17 -0.28 85.67(-1.70) 1.48 5.07 53.52(-16.34) 0.95 -9.19
27. CM- 124 x POP 31 Q2
49.22(-0.83) 1.52 2.10** 50.89(-1.17) 1.52 2.22** 85.89(-1.48) 0.88 -1.78 81.52(11.66) 0.91 -9.48
28. CM- 124 x CML 359
50.89(0.84) 0.87 -0.25 52.89(0.83) 0.87 -0.24 90.33(2.96) 0.18* -1.88 53.14(-16.72) 0.88 -9.39
29. CM- 124 x CM 129
34
30. CM- 124 x LM-1349.89(-0.16) 0.29 -0.28 51.89(-0.17) 0.29 -0.28 89.89(2.52) 0.14* -1.85 108.60(38.74) 2.21 3.64
31. LM-13 x Early yellow
48.22(-1.83) 0.39 -0.26 50.22(-1.84) 0.40 -0.26 85(-2.37) 0.92 -1.76 63.18(-6.68) 0.86 -9.49
32. LM-13 x POP 445
47.89(-2.16) 0.38 0.04 49.89(-2.17) 0.38 0.05 84.61(-2.37) 0.94 24.63** 93.41(23.55) 1.40 -7.68
33. LM-13 x POP 31 Q2 49.11(-0.94) 1.65* -0.31 51.11(-0.95) 1.66* -0.30 86.11(-1.26) 1.31 -1.17 66.22(-3.64) 1.12 -9.49
34. LM-13 x CML 359
51.33(1.28) 0.88 -0.22 53.33(1.27) 0.89 -0.23 90.11(2.74) 0.43 -1.27 61.53(-8.33) 0.92 -9.49
35. LM-13 x CM 129
51.89(1.84) 1.52 2.10* 54(1.94) 1.43 1.76* 89.33(1.96) 1.14 -1.14 75.48(5.62) 0.98 -9.49
36. CM 129 x Early yellow
47.44(-2.61) 0.79 -0.11 49.44(-2.62) 0.79 -0.13 84(-3.37) 0.64 -1.82 51.50(-18.36) 0.90 -9.49
37. CM 129 x POP 445
49.22(-0.83) 0.89 0.01 51.22(-0.84) 0.89 -0.01 86.56(-0.81) 1.17 1.46 65.27(-4.59) 0.91 -9.18
38. CM 129 x POP 31 Q2 48.67(-1.83) 1.58 1.76** 50.67(-1.39) 1.60 1.65* 85.22(-2.15) 1.54 -1.10 62.72(-7.14) 1.05 -9.46
39. CM 129 x CML 359
49.67(-0.38) 1.67 0.73 51.67(-0.39) 1.69 0.65 87.33(-0.04) 1.10 4.01 90.53(20.67) 1.22 -8.38
40. CML 359 x Early yellow
48.22(-1.83) 0.39 -0.26 50.22(-1.84) 0.40 -0.26 85.33(-2.04) 0.75 -1.62 55.10(-14.76) 0.71 -6.47
41. CML 359 x POP 445
46.33(-3.72) 0.39* -0.31 48.22(-3.84) 0.40 -0.26 84(-3.37) 0.37* -1.87 64.12(-5.74) 0.99 -9.49
42. CML 359 x POP 31 Q2
49.22(-0.83) 1.78 2.53** 51(-1.06) 1.90 2.80** 84.67(-2.70) 2.03** -1.89 63.03(-6.83) 1.01 -9.39
43. POP 31 Q2 x Early yellow
48(-2.05) 1.80 4.66** 50.11(-1.95) 1.72 5.14* 84.44(-2.93) 1.73 -0.71 48.84(-21.02) 0.92 -9.41
44. POP 31 Q2 x POP 445 47.67(-2.38) 0.60 0.24 49.67(-2.39) 0.61 0.22 85.22(-2.15) 0.95 -0.11 71.47(1.61) 0.92 -9.46
45. POP 445 x Early yellow
35
46.K-25 (Check 1) 52.89(2.84) 1.29 1.48* 55.33(3.27) 1.41 1.73* 91.44(4.07) 0.42* -1.89 65.19(-4.67) 0.95 -9.47
47.
GA -85 (Check 2) 51.11(1.06) 1.14 1.21* 53.11(1.05) 1.14 1.28* 88.56(1.19) 0.86 -0.21 57.76(-12.10) 0.80 -8.14
48.
NAVJYOT 3 (Check 3) 52.78(2.73) 0.89 0.40 54.78(2.72) 0.90 0.36 92.67(5.30) 1.05 -1.21 44.11(-25.75) 0.98 -5.02
Parents
49. EARLY YELLOW (P1)
51(0.95) 1.04 1.53* 53.11(1.05) 0.95 1.21* 86.56(-0.81) 1.17 -0.82 62.03(-7.83) 0.98 -9.42
50. POP- 445 (P2)
50.33(0.28) 0.76 0.52 52.33(0.27) 0.76 0.56 85.78(-1.59) 1.04 1.24 51.29(-18.57) 0.85 -9.29
51. POP -31 Q2 (P3)
50.67(0.62) 1.85 -0.28 52.67(0.61) 1.86* -0.29 87(-0.37) 1.82 15.67** 67.85(-2.01) 1.01 -8.86
52. CML -359 (P4)
49.67(-0.38) 1.27 -0.25 51.67(-0.39) 1.28 -0.26 87.78(0.41) 1.13 1.91 61.14(-8.72) 0.88 -9.30
53. CM 129 (P5)
50(-0.05) 0.88 -0.22 52.33(0.27) 0.89 -0.23 90.33(2.96) 0.36 -0.97 83.68(13.82) 1.09 -7.55
54. LM 13 (P6)
50.67(0.62) 0.48 -0.09 52.67(0.61) 0.48 -0.08 88.78(1.41) 0.57 1.10 68.57(-1.29) 0.96 -9.37
55. CM- 124 (P7)
50.78(0.73) 0.38 -0.21 52.89(0.83) 0.29 -0.28 87.78(0.41) 0.89 3.24 51.98(-17.88) 0.90 -9.17
56. DMR QPM-28 (P8)
53.22(3.17) 0.78 -0.28 55.56(3.50) 0.29 -0.28 91(3.63) 1.04 -0.39 51.76(-18.10) 0.92 -8.92
57. CML- 41 (P9)
51.44(1.39) 1.72 1.39* 53.44(1.38) 1.73 1.50* 90.33(2.96) 1.41 1.70 61.03(-8.83) 0.94 -9.20
58. HKI-193-2 (P10)
51.67(1.62) 0.39* -0.31 54(1.94) 0.39* -0.31 89(1.63) 1.10 9.04* 66.26(-3.60) 0.97 -6.31
Mean 50.05 - - 52.06 - - 87.37 - - 69.86 - -
36
Table 4.Environmental indices for different characters in maize across the environments
Characters
Environmental indices
E
1E
2E
3Days to 50 % tasselling
-1.67
-0.10
1.77
Days to 50 % silking
-1.64
-0.12
1.76
Days to 50 % brown husk
3.77
-0.32
-3.45
Plant height
38.17
5.16
-43.33
Cob length
2.26
-0.20
-2.06
Cob girth
1.38
-0.01
-1.36
Kernel rows/Cob
1.51
1.09
-2.61
Number of kernels/ row
4.72
0.36
-5.08
Grain yield/ plant
4.03
3.05
-7.08
Biological yield
11.97
0.90
-12.87
Harvest index
0.34
1.36
-1.70
Chlorophyll content (SPAD)
3.57
3.06
-6.63
Leaf Relative Water Content
4.01
-3.18
-0.83
Flag leaf area/ plant
23.43
-3.98
-19.45
Leaf area/ plant
425.28
57.39
-482.67
Leaf area index
0.35
0.05
-0.40
Leaf area ratio
8.84
-1.71
-7.13
Specific leaf weight
0.24
0.03
-0.28
Specific leaf area
-6.11
-0.81
6.92
E
1=Environment 1, E
2=Environment 2 and E
3=Environment 3
IV.CONCLUSION
37
different environments for high grain yield per plant. The hybrid POP 31 Q2 x POP 445 however, showed negative phenotypic index (Pi<1), regression coefficient near to unity (βi≈1) and non-significant deviation from regression (s2di) there by indicating its stability over all environments and suitability for early maturity.The result also indicated that the genotypes interacted differently towards the different environment conditions, indicating the possibility to develop environment specific hybrids. The distribution of rainfall during the growing period and the date of sowing also may be determining factors for the performance of maize genotypes for stability performance of yield and other quantitative traits.V.ACKNOWLEDGEMENTS
The Authors are sincerely grateful to the Hon‘ble Vice-Chancellor, Director Research and Head of Department
of Geneticsand Plant Breeding, Sam Higginbottom Institute of Agriculture, Technology and Sciences, Allahabad, for providing the necessary facilities for completing the research work.
REFERENCES
[1] M Shiri, R, Choukan and RT, Aliyev, Drought tolerance evaluation of maize hybrids using biplot method, Trends Applied Science Research 5, 2010, 129-137.
[2] R Kumar, K, Srinivas and N, Sivaramane, Assessment of the maize situation, outlook and investment
opportunities in India, Country Report – Regional Assessment Asia (MAIZE-CRP), National Academy of
Agricultural Research Management, Hyderabad, India. 2013, pp xii.
[3] Director’s Review, ICAR-Indian Institute of Maize Research, Ludhiana, 2016-17, 1-19.
[4] BS.Dhillon, Maize. In. Hybrid cultivar development.Ed. Banaga, S.S. and S.K. Banga.Naosa Publishing House. New Delhi, India.1998.
[5] RL Paliwal, Uses in maize. In.: R.L. Paliwal, G Granados, HR Lafitte, AD Vololle, eds. Tropical Maize: Improvement and Production, Food and Agriculture Organization of the United Nations Rome, 2000, 45-57.
[6] DE Farnham, G O, Benson and RB.Pearce, Corn perspective and culture.Chapter 1. In: PJ White, LA Johnson, eds. Corn: chemistry and technology, Edition 2nd, American Association of Cerial Chemicals, Inc. St. Paul, Minesota, USA. 2003, 1-33.
[7]CR Dowswell, RL. Paliwal, and RP. Cantrell, Maize in the third world, Westview Press, Boulder, USA. 1996. [8] J Hill, Genotype x environment interaction: A challenge for plant breeding, Journal of Agricultural Science,
85, 1975, 477- 493.
[9] KE., Basford and M. Cooper, Genotype x environment interactions and some considerations of their implications for wheat breeding in Australia, Australian Journal of Agriculture Research, 1998, 4:153-174. [10] M Vargas, J. Crossa, FA. vanEeuwijk, ME. Ramirez, and K. Sayre, Using partial least squares regression,
factorial regression, and AMMI models for interpreting genotype x environment interaction, Crop Science, 39, 1999, 955–967.
38
[12] H Rahman, Durreshawar, S, Ali, F, Iftikhar, IH, Khalil, SMA, Shah, H, Ahmad, Stability analysis of maizehybrids across North west of Pakistan, Pakistan Journal of Botany 42(2), 2010, 1083-1091.
[13] M Shiri, Grain yield stability analysis of maize (Zea mays L.) hybrids in different stress conditions using GGE biplot analysis, Crop Breeding Journal 3(2), 2013, 107-112.
[14] S Eberhart, and W. Russell, Stability parameters for comparing varieties, Crop Science, 6, 1966, 36-40. [15] B Bharathiveeramani, M. Prakash, A. Seetharam, and BS Kumar, Evaluating tropical single cross maize
hybrids for adaptability and commercial value, Maydica, 61, 2016, 1-6.
[16] S Lata, S. Guleria, J. Dev, G. Katna, BC. Sood, V. Kalia and A. Singh, Stability analysis in maize (Zea mays L.) hybrids across locations, Electronic Journal of Plant Breeding, 1(3): 2010, 239- 243.
[17] C Scapim, V. Oliveira, A. Braccin, C. Cruz, C. Andrade and M. Vidigal, Yield stability in maize and correlations among the parameters of Eberhart and Russell, Lin and Binns and Huehn models, Genetics and Molecular Biology, 23: 2000, 287-292.
[18] VP Mani and NK Singh, Stability analysis in maize (Zea mays L.), Indian Journal of Agricultural Science, 77, 1999, 38-41.
[19] J Shrestha and MP Tripathi, Grain Yield Stability of Quality Protein Maize Genotypes across Diverse Environments of Terai and Mid Hills in Nepal, International Journal of Agriculture System,2 (2), 2014, 113-118.
[20] IA Khalil, HU. Rahman, NU. Rehman, M. Arif, IH. Khalil, M. Iqbal, HK. Afridi, M. Sajjad and M. Ishaq, Evaluation of maize hybrids for grain yield stability in north-west of Pakistan, Sarhad Journal of Agriculture, 27(2), 2011, 213.
[21] A Biswas, U. Sarker, BR. Banik, MM. Rohman, and MZA. Talukder, Genotype x environment interaction for grain yield of maize (Zea mays L.) inbreds under salinity stress,Bangladesh Journal of Agriculture Research, 39(2), 2014, 293-301.
[22] M Worku, H. Zelleke, G. Taye, B. Tolessa, L. Wllde, W. Abera, A. Gula and H. Tuna, Yield stability of maize genotypes across locations, Seventh Berseen and Southern African Regional Maize Conference, Feb. 11-15: 2001, 139-142.
[23] S Rasul, M. Khan, M. Javed and I. Haq, Stability and adaptability of maize genotypes of Pakistan, Journal of Applied Science and Research, 1, 2005, 307-312.
[24] R Kaundal and BK. Sharma, Genotype x Environment interaction and stability analysis for yield and other quantitative traits in maize (Zea mays L.) under rainfed and high rainfall valley areas of the sub mountain, Research on Crops, 7, 2006, 171-180.
[25] NS Dodiya and VN Joshi, Genotypic x environment interaction and stability analysis for yield and maturity in maize (Zea mays L.), Crop Research, 26, 2003, 110-113.
[26] MAA Hassan, Stability Parameters for Grain Yield and Other AgronomicTraits of Promising White Maize Hybrids Alex, Journal of Agriculture Research, 60(1), 2015, 17‐23.