Highlights from HAWC
H. León Vargas1,∗for the HAWC Collaboration∗∗
1Instituto de Física, Universidad Nacional Autónoma de México, Apartado Postal 20-364, México D.F. 01000, México
Abstract.The HAWC (High Altitude Water Cherenkov) observatory, located on the slopes of the Sierra Negra volcano in the state of Puebla, Mexico, was designed with the goal of detecting gamma-rays in the Tera-electron-volt energy range. However, most of the air showers that are detected with the observatory, with a rate of≈27 kHz, are of hadronic origin. This makes that, after three years of operations, HAWC has accumulated a very large data set that allows to perform cosmic-ray analysis of high precision. The details of the observatory operation, as well as a selection of recent results in cosmic-ray physics are discussed in this work.
1 Introduction
The HAWC observatory is a second generation ground based instrument designed to characterize electromagnetic showers with high precision. This allows to obtain the best gamma/hadron rejection obtained so far for this particular
type of instrument. The observatory is located at an alti-tude of≈4100 m above sea level and is made of 300 de-tector units or WCDs (Water Cherenkov Dede-tectors). Each WCD is a cylindrical stainless steel tank that contains a plastic bladder that can hold a water volume of up to 200 000 litres. The dimensions of a WCD are: 7.3 meters of diameter and 5 meters of height. Every detector unit is instrumented with four photomultiplier tubes (PMTs): three 8 inch Hamamatsu R5912 and one 10 inch R7081, anchored at the base of the bladder and looking at the water volume upwards. The WCDs detect the passage of charged particles in the air showers, as they produce Cherenkov light inside the water volume. The main ar-ray of the observatory covers a surface of approximately 22000 m2. HAWC has been taking data with his full
con-figuration since its inauguration on March 20, 2015.
2 Data Acquisition System
The HAWC PMTs are connected, using RG-59 cables, to Front-End Boards (FEBs) that were previously used by the Milagro experiment [1]. The high voltage supplied to each PMT is chosen so the gain is uniform across the array. The FEBs are connected to Time to Digital Converters (TDCs). The TDCs are used as continous recorders of edge timing, so the experiment acquires and trasmits all of the TDC-digitized edges to a computer farm. The amount of light that each PMT measures is approximated using the ToT (Time over Threshold) method, using two thresholds; the first at ≈1/4 of a photoelectron (PE), and the second at
≈4 PEs. HAWC operates with a software trigger, with
∗e-mail: [email protected]
∗∗https://www.hawc-observatory.org/collaboration/
an event selection based on a simple multiplicity trigger that requires that a certain number of PMTs have been hit within a time window of 150 ns. The system stores infor-mation of hits that happened 500 ns before and 1000 ns after the trigger. At the time of the writing of this work, the trigger threshold is of 28 PMTs, that produces a rate of
≈28 kHZ, primarily due to hadronic air showers. The de-tails of the data acquisition system of the observatory can be found in [2].
3 Air shower reconstruction
A subset of the hits recorded by the data acquisition sys-tem is used in the the air shower reconstruction. The algo-rithms use hits that occurred between -150 and+400 ns
around the trigger time. The first step of the reconstruction chain is the air shower core reconstruction. The core posi-tion is given by the highest concentraposi-tion of secondary par-ticles in the shower plane, as it passes through the detector array. The core position is calculated iteratively in three steps, with an increasingly restrictive selection criteria of the hits related to the candidate shower plane, with the last step comprising only hits within 50 ns of the reconstructed plane. Once the shower plane and core are defined, two gamma/hadron separators are calculated using the
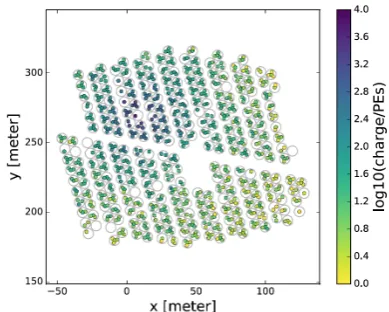
proper-ties of only the hits within 20 ns of the best approximation of the plane. Figure 1 shows an event display, of a real air shower, using an overhead view of the HAWC obser-vatory main array. The larger circles in the figure show the WCD positions, whereas the small coloured circles the four PMTs located inside the WCDs. The color code indi-cates the measured deposited light in PEs, clearly showing the shower core.
3.1 Gamma/hadron separation
Figure 1.Event display of the signals produced by an air shower that passed through the HAWC detector. The color code indicates the amount of light detected by each PMT in PE units [3].
shower front is several nanoseconds thick. This is taken into account in the hits selected for the gamma/hadron
sep-aration variables, as mentioned before. The first variable is called compactness (C), and is defined by Equation 1
C= Nhit
CxPE40 (1)
whereCxPE40is the largest effective charge detected by a
PMT outside a radius of 40 m measured from the shower core. In order to be able to use all of the PMTs on an equal basis for the calculations, we use the effective charge
in-stead of the measured charge for the larger and more ef-ficient Hamamatsu R7081. The effective charge, for the
case of the 8 inch PMTs is just the measured charge, but for the larger 10 inch PMT the charge is scaled so that the PMT response matches that of the 8 inch PMTs. Nhit is the number of PMTs hit during the air shower. In general, hadronic air showers contain sporadic hits with high charge deposits far from the shower core, primar-ily due to muons with large transverse momentum. Thus, for a fixed value ofNhit,CxPE40 is on average larger for
hadronic showers, causing a smaller value ofCcompared to that of electromagnetic showers. The second parameter used to differentiate electromagnetic from hadronic
show-ers is called PINCness (Parameter for Identifying Nuclear cosmic-rays). This parameter quantifies the "clumpiness" of the air showers, which is larger for hadronic showers due to additional hadronic subshowers that are not com-mon in showers with an electromagnetic origin. The defi-nition of PINCness is given in Equation 2
P= 1
N
N
i=0
(ξi− ξi)2
σ2ξi (2)
whereξi =log10(Qeff,i), andξiis the average of all the PMTs that are contained within an annulus of width 5m that contains the given hit. The values ofσξi are obtained
from data, from a sample of gamma-ray candidates from the Crab Nebula. As Pdescribes the axial uniformity of the charge distribution, and an hadronic shower contains high charge hits due to muons, the value of Pwould in
this case be larger than that obtained from electromagnetic showers. Figure 2 shows the lateral distribution of two air showers: in the left panel from a strong candidate of one produced by a cosmic-ray, and in the right panel from a strong gamma-ray candidate. One can clearly observe hits with large deposits of charge far from the shower core in the hadronic shower candidate.
Both separation parameters are well described by the simulations. The top panels from Figure 3 show the dis-tribution of events measured from the vicinity of the Crab Nebula, and from a background region (from an annulus around the signal region), using both separation parame-ters. The bottom panels of Figure 3 show the background substracted distributions. The data corresponds to large showers, that produce signals in≈80% of the whole array. The agreement between the simulation and data is clear.
A complete description of the reconstruction algo-rithms used by HAWC and the detector performance can be found in [3]. Now we will describe some recent re-sults related to cosmic-ray astrophysics obtained with the HAWC observatory.
4 Constraints on the antiproton to proton
ratio at TeV energies
Recent results from the Alpha Magnetic Spectrometer (AMS-02) show that the antiproton to proton ratio as a function of rigidity does not show the expected decrease predicted in pure secondary production models in the range between 60 to 500 GV [4]. The unexpected excess of antiparticles may have several possible sources: the de-cay or annihilation of exotic particles, unaccounted astro-physical sources or uncertainties in the cross sections used to predict the antiparticle flux from secondary production. Using the Moon shadow, HAWC has been able to provide the most constrained upper limits of the antiproton to pro-ton ratio in the energy range between 1 and 10 TeV. The energy estimation for hadronic showers used in this study is based on probability tables that contain the lateral dis-tribution of PMT hits for a set of simulated proton ener-gies and zenith angles. For each PMT, a likelihood value is extracted from the tables for a shower with a given re-constructed zenith angle and core position. Then, for each simulated bin of proton energy, the likelihood values are summed for all the PMTs. The maximum likelihood is used to assign the energy of the shower. The cosmic-ray flux is analized by making a sky-map of the data using HEALPix [5]. Each pixel of the map is centered at a right ascension and declination given by (α,δ) and cover an
an-gular width of≈0.1. The excess or deficit of cosmic-ray counts in every pixel is estimated taking as a baseline an isotropic background. The relative intensity δI, the frac-tional excess or deficit of counts in a given pixel, is given by Equation 3
δI=N(αi, δi)− N(αi, δi)
N(αi, δi) (3)
whereN(αi, δi) is the number of events in the data map, and N(αi, δi) is the counts in the baseline reference
Figure 2.Distribution of the logarithm of the effective charge as a function of the distance of the hit to the reconstructed shower core.
The plot on the left corresponds to a strong candidate of a cosmic-ray shower, while the right distribution to a gamma-ray candidate from the Crab Nebula [3].
Figure 3.Compactness (C) and PINCness (P) distributions for events close to the Crab Nebula. The data corresponds to air showers that produce signals in≈80% of the observatory. The top panels show the raw events, while the bottom panels the background substracted events [3].
map. To estimate the reference map, the direct integration method is used [6].
The method used by HAWC to estimate the ratio of an-tiprotons to protons is based on observations of the Moon shadow. The Moon acts as a shield for incoming cosmic-rays, creating a deficit, or shadow, of events in the direc-tion of the Moon. This shadow is displaced from the actual position of the Moon due to the deflection of the cosmic-rays in the magnetic field of the Earth. The displacement is thus a function of the energy of the primary cosmic-ray. In order to create a map centred on the Moon, the equatorial
coordinates of the Moon are substracted from the coordi-nates of each shower. Figure 4 shows an example proton shadow at 1.6 TeV. The shape of the shadow is fitted with an asymmetric 2D Gaussian, and the centroid of the shape is used to characterize the offset in the position. The map is
smoothed with a 1◦top-hat function to enhance the
visibil-ity of the shadow. The offset in the centroid of the shadow,
caused by the geomagnetic deflection, is highest at 1 TeV, being of 1.9◦ in right ascension and 0.3◦ in declination.
At 10 TeV, this offset decreases to 0.21◦in right ascension
Figure 4.Proton shadow at 1.6 TeV. The overlaid black ellipses show the 1σand 2σwidth contours of the Gaussian fit. The ex-pected position of an antiproton shadow is shown with the white ellipses [8].
Antiprotons should deflect in the opposite direction to that of the protons, creating another region of deficit as shown in Figure 4 with the white ellipses. The relative intensity of this second shadow would be proportional to the flux of antiprotons being blocked by the Moon. We fitted the sum of two 2D Gaussian functions to the data map in order to estimate the antiproton to proton ratio. The first step is to fit only the proton shadow with a single 2D Gaussian, fixing its six parameters: centroid coordinates (x0,y0), its widthsσxandσy, the tilt angleθbetween the shadow and the right ascension axis, and the amplitude
A. Then, the antiproton shadow is fitted, fixing the widths and reflecting the centroid position of the proton shadow. The amplitude of the antiproton shadow can be written as
r×A, withr=p¯/p, the antiproton to proton ratio. Using
a maximum likelihood method to calculate the antiproton shadow we obtain a null result. We calculated upper limits using the Feldman & Cousins method [7], and the results are shown in Figure 5.
The results are restricted to energies of 10 TeV and below, because of the increased abundance of helium at higher energies that may bias the results. The details of this analysis can be found in [8].
5 All-particle cosmic-ray spectrum
The HAWC observatory can play an important role in the studies of the cosmic-ray spectrum, since it can pro-vide data at an energy range between of that covered by direct detection instruments and much larger PeV air shower arrays. This is illustrated in Figure 6, where one can compare the HAWC measurements of the all-particle cosmic-ray spectrum (blue circular markers), compared to the spectra measured by ATIC-2 [9], ARGO-YBJ [10], GRAPES-3 [11], IceTop [12] and Tibet-III [13]. For
com-parison, the data from CREAM [14] of the light compo-nent is also shown. The double sided arrow in the figure shows the shift in the flux of the HAWC measurement that would occur from a shift of 10% in the energy scale. The measured spectrum shows agreement, within systematic uncertainties, with several experiments in the 10-500 TeV energy range.
We performed two possible fits to the HAWC mea-surements: a power law and a broken power law. A test of the goodness of fit of these two possibilities showed that the broken power law model was favoured with a p value of 4.6×10⁻⁷. Figure 7 shows a zoom of the region
around the observed spectral break. For comparison, the same figure shows the data from ATIC-2 and the CREAM light component spectra. One can notice that the data from other experiments already suggest the presence of a spec-tral break. The presence of a specspec-tral break in the light component measured by CREAM, together with the ob-servations made by HAWC, suggest that the light compo-nent is responsible for the spectral break. The HAWC data is consistent with a spectrum described by a broken power law with an index ofγ1=-2.49±0.01 prior to a break at
45.7±0.1 TeV, followed by a spectral index ofγ2=-2.71 ±0.01.s
These measurements demonstrate the HAWC capabil-ity to bridge the data from direct detection experiments into the regime of the ground-based air-shower arrays. The details of the analysis of the cosmic-ray spectrum mea-sured by HAWC can be found in [15].
6 The positron excess and extended
sources
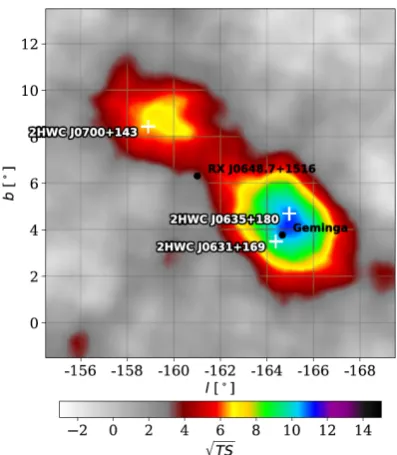
Among the 39 gamma-ray sources found up to now with HAWC [16], some of them are extended sources associ-ated to pulsars. These sources are particularly interesting because among the possible explanations for the positron excess above 10 GeV detected by the PAMELA satellite-borne experiment [17] and AMS-02 [18], is that this flux could be produced by nearby pulsars. However, the pulsar hypothesis require certain characteristics from the sources: that these are old enough so its electron and positron wind has had enough time to reach Earth, but also young enough so the sources could still be emitting this wind. There are not many candidates that can fulfil these requirements. Among the possible sources is Geminga, which was found to be a TeV gamma-ray emitter by the predecessor of HAWC, the Milagro experiment. With HAWC, we found a new source similar to Geminga: 2HWC J0700+143.
Fig-ure 8 shows a map in Galactic coordinates that contains both sources. These are very extended, with an apparent angular size around an order of magnitude larger than that of the Moon. Due to its very large angular extent, HAWC is up to now the only instrument capable of characterizing the TeV emission from these objects.
Figure 4.Proton shadow at 1.6 TeV. The overlaid black ellipses show the 1σand 2σwidth contours of the Gaussian fit. The ex-pected position of an antiproton shadow is shown with the white ellipses [8].
Antiprotons should deflect in the opposite direction to that of the protons, creating another region of deficit as shown in Figure 4 with the white ellipses. The relative intensity of this second shadow would be proportional to the flux of antiprotons being blocked by the Moon. We fitted the sum of two 2D Gaussian functions to the data map in order to estimate the antiproton to proton ratio. The first step is to fit only the proton shadow with a single 2D Gaussian, fixing its six parameters: centroid coordinates (x0,y0), its widthsσxandσy, the tilt angleθbetween the shadow and the right ascension axis, and the amplitude
A. Then, the antiproton shadow is fitted, fixing the widths and reflecting the centroid position of the proton shadow. The amplitude of the antiproton shadow can be written as
r×A, withr=p¯/p, the antiproton to proton ratio. Using
a maximum likelihood method to calculate the antiproton shadow we obtain a null result. We calculated upper limits using the Feldman & Cousins method [7], and the results are shown in Figure 5.
The results are restricted to energies of 10 TeV and below, because of the increased abundance of helium at higher energies that may bias the results. The details of this analysis can be found in [8].
5 All-particle cosmic-ray spectrum
The HAWC observatory can play an important role in the studies of the cosmic-ray spectrum, since it can pro-vide data at an energy range between of that covered by direct detection instruments and much larger PeV air shower arrays. This is illustrated in Figure 6, where one can compare the HAWC measurements of the all-particle cosmic-ray spectrum (blue circular markers), compared to the spectra measured by ATIC-2 [9], ARGO-YBJ [10], GRAPES-3 [11], IceTop [12] and Tibet-III [13]. For
com-parison, the data from CREAM [14] of the light compo-nent is also shown. The double sided arrow in the figure shows the shift in the flux of the HAWC measurement that would occur from a shift of 10% in the energy scale. The measured spectrum shows agreement, within systematic uncertainties, with several experiments in the 10-500 TeV energy range.
We performed two possible fits to the HAWC mea-surements: a power law and a broken power law. A test of the goodness of fit of these two possibilities showed that the broken power law model was favoured with a p value of 4.6×10⁻⁷. Figure 7 shows a zoom of the region
around the observed spectral break. For comparison, the same figure shows the data from ATIC-2 and the CREAM light component spectra. One can notice that the data from other experiments already suggest the presence of a spec-tral break. The presence of a specspec-tral break in the light component measured by CREAM, together with the ob-servations made by HAWC, suggest that the light compo-nent is responsible for the spectral break. The HAWC data is consistent with a spectrum described by a broken power law with an index ofγ1=-2.49±0.01 prior to a break at
45.7±0.1 TeV, followed by a spectral index ofγ2=-2.71 ±0.01.s
These measurements demonstrate the HAWC capabil-ity to bridge the data from direct detection experiments into the regime of the ground-based air-shower arrays. The details of the analysis of the cosmic-ray spectrum mea-sured by HAWC can be found in [15].
6 The positron excess and extended
sources
Among the 39 gamma-ray sources found up to now with HAWC [16], some of them are extended sources associ-ated to pulsars. These sources are particularly interesting because among the possible explanations for the positron excess above 10 GeV detected by the PAMELA satellite-borne experiment [17] and AMS-02 [18], is that this flux could be produced by nearby pulsars. However, the pulsar hypothesis require certain characteristics from the sources: that these are old enough so its electron and positron wind has had enough time to reach Earth, but also young enough so the sources could still be emitting this wind. There are not many candidates that can fulfil these requirements. Among the possible sources is Geminga, which was found to be a TeV gamma-ray emitter by the predecessor of HAWC, the Milagro experiment. With HAWC, we found a new source similar to Geminga: 2HWC J0700+143.
Fig-ure 8 shows a map in Galactic coordinates that contains both sources. These are very extended, with an apparent angular size around an order of magnitude larger than that of the Moon. Due to its very large angular extent, HAWC is up to now the only instrument capable of characterizing the TeV emission from these objects.
Based on the gamma-ray emission, it is possible to infer the properties of the propagation of electrons and positrons to Earth, because the observed high-energy gamma-ray emission is produced by these leptons as they
Figure 5.Upper limits on the antiproton to proton ratio obtained by HAWC and measurements in the GeV range by other experiments. The shaded bands show the systematic uncertainty and the yellow boxes the HAWC sensitivity [8].
Figure 6.All-particle cosmic-ray energy spectrum measured by HAWC, compared to the measurements performed by other in-struments. The shaded areas indicate the systematics uncertain-ties. The statistical uncertainties in the HAWC data are negligible due to the large event sample (8×10⁹reconstructed air showers)
[15].
diffuse in the interstellar medium. Figure 9 shows the
re-sults obtained for the contribution of the positron flux mea-sured at Earth from Geminga. The estimated contribution from 2HWC J0700+143 is negligible and does not even
appear in the same figure due to the axis range. It is clear that according to our results, the excess positron flux can-not be explained by the pulsars associated to Geminga and 2HWC J0700+143. The complete analysis and discussion
about these results can be consulted in [19].
7 The HAWC Sparse Outrigger Array
The HAWC observatory has just finished its first upgrade: the sparse outrigger array. The goal of the upgrade is to in-crease the sensitivity for air showers with energies larger that 10 TeV, by increasing the precision of the shower core location. The outrigger array is composed of 345 tanks that contain a water volume of≈2500 litres and a single
Figure 7. The HAWC all-particle spectrum compared to the same measurements performed by ATIC-2, together with the light component measurement by CREAM. The dashed line shows the best fit to the HAWC data, obtained using a broken power law [15].
PMT anchored at the bottom of the tank. With these new detectors, HAWC increases its instrumented area by a fac-tor of four. The upgrade is taking data together with the main array since August 2018.
After three years of operations, the HAWC observa-tory has produced several interesting results related to cosmic-rays astrophysics. Other results not discussed in this summary, but also published in these proceedings include the study of the anisotropy in the arrival direction of cosmic-rays.
Acknowledgement
Figure 8. Test statistic (TS) map for an extended source of gamma-rays (2◦) hypothesis in the region around Geminga, that also contains 2HWC J0700+143. Sources are identified if their TS value is larger than 25 [3].
Figure 9. Positron energy flux at Earth produced by Geminga
(blue line). The green data points show the AMS-02 data. The shaded area shows the statistical uncertainty obtained from sim-ulations. Other individual lines indicate the effect in our results from the variation of differente systematic effects [19].
References
[1] The MILAGRO Collaboration (R. Atkins et al.), The Astrophysical Journal595, 803-811 (2003)
[2] The HAWC Collaboration (A.U. Abeysekara et al.),
Nuclear Inst. and Methods in Physics Research A888,
138-146 (2018)
[3] The HAWC Collaboration (A.U. Abeysekara et al.), The Astrophysical Journal843:39, 1-17 (2017) [4] AMS Collaboration (M. Aguilar et al.), Physical
Re-view Letters117, 091103-(1-10) (2016)
[5] K. M. Górski, E. Hivon, A. J. Banday, B. D. Wandelt, F. K. Hansen, M. Reinecke, and M. Bartelmann, The Astrophysical Journal622, 759-771 (2005)
[6] R. Atkins et al., The Astrophysical Journal595, 803-811 (2003)
[7] G.J. Feldman and R.D. Couins, Physical Review D57, 3873 (1998)
[8] The HAWC Collaboration (A.U. Abeysekara et al.),
Physical Review D97, 102005-(1-9) (2018)
[9] A.D. Panov et al., Bulletin of the Russian Academy of Sciences:Physics73, 564-567 (2009)
[10] G. Di Sciascio for the ARGO-YBJ Collaboration, arXiv:1408.6739 (2014)
[11] H. Tanaka et al., Journal of Physics G: Nuclear and Particle Physics39, 025201-(1-16) (2012)
[12] IceCube Collaboration (M.G. Aartsen et al.),
Physi-cal Review D88, 042004-(1-15) (2013)
[13] The Tibet ASγCollaboration (M. Amenomori et al.),
Advances in Space Research42, 467-472 (2008)
[14] Y.S. Yoon et al., The Astrophysical Journal728, 122-(1-8) (2011)
[15] The HAWC Collaboration (R. Alfaro et al.), Physical
Review D96, 122001-(1-14) (2017)
[16] The HAWC Collaboration (A.U. Abeysekara et al.), The Astrophysical Journal843:40, 1-21 (2017) [17] O. Adriani et al., Nature458, 607-609 (2009) [18] AMS Collaboration (M. Aguilar et al.), Physical
Re-view Letters110, 141102-(1-10) (2013)
![Figure 2. Distribution of the logarithm of the effective charge as a function of the distance of the hit to the reconstructed shower core.The plot on the left corresponds to a strong candidate of a cosmic-ray shower, while the right distribution to a gamma-ray candidatefrom the Crab Nebula [3].](https://thumb-us.123doks.com/thumbv2/123dok_us/8009170.1331170/3.595.103.497.295.583/distribution-logarithm-eective-reconstructed-corresponds-candidate-distribution-candidatefrom.webp)