584 | P a g e
OPTIMIZATION AND ANALYSIS SEGMENTATION
TECHNIQUE IN IMAGE PROCESSING USING
MATLAB
Parul Dixit
1, Nidhi Tyagi
21
School of Computer Science & Information Technology, Shobhit University, Meerut, U.P., (India)
2
Meerut Institute of Engineering and Technology Meerut, UP (India)
ABSTRACT
In the present communication, we have a categorized survey of different image thresholding techniques applied to five images, which illustrate the shortcomings and advantages of the different methods. The various algorithm parameters have been optimized for each image. The different techniques like mean thresholding, histogram thresholding, edge thresholding, variable thresholding and P-tile thresholding are applied on these images. The performances of these techniques are measured on the basis of black pixels ratio (BPR). The image having less number of black pixels is good binary image. We concluded that in histogram thresholding BPR is less as compare to other methods. So, it is the best thresholding method.
Keyword Segmentation, Image Processing,MATLAB
I. INTRODUCTION
Thresholding is a powerful tool for the separation of the objects from the background [1]. Image is divided into
homogeneous regions in Image Segmentation process. Image segmentation is typically used to highlight lines,
curves, etc. Each pixel in the image is similar with respect to some property (color, intensity, texture etc). Many
algorithms are defined for segmentation of an image on the basis of one of the two properties intensity values
discontinuity and similarity. In the first approach, image is partition on abrupt changes in intensity, such as
edges in an image and another one is based on region based partition that is similar according to predefined
criteria. Histogram Threshold approaches second category [2]. However, a popular technique in image
segmentation is thresholding, which are computationally simpler, such as boundary detection or
region-dependent techniques. Thus, if a computational requirement is of important consideration, as in machine vision,
the thresholding technique is preferred to other techniques and is a widely used for image segmentation [3].
Also if thresholding is inappropriate, it leads to blotches, streaks, erasures, fractures of character shapes in the
document. These are usually the main reasons for deterioration of OCR performance. Thresholding algorithms
depend on factors such as distribution of the gray level of the document, presence of denser, non-text
components such as photographs, local shading effects, the quality of the paper etc. There have been a number
of survey papers on thresholding. Lee, Chung and Park [4] conducted a comparative analysis of five global
thresholding methods and advanced several useful criteria for thresholding performance evaluation. In an earlier
paper Weszka and Rosenfeld [5] also defined several evaluation criteria. Palumbo, Swaminathan and Srihari [6]
585 | P a g e
extensive comparison basis (19methods) in the context of character segmentation from complex backgrounds.Sahoo et al. [8] surveyed nine thresholding algorithms and illustrated comparatively their performance. Glasbey
[9] pointed out the relationships and performance differences between 11 histogram-based algorithms based on
an extensive statistical study.
II. METHODOLOGY
This section deals with developing and implementing the various thresholding techniques algorithm for finding
the threshold value so that binarisation of image can be done easily. Segmentation of an image entails the
division or separation of the image into regions of similar attribute. The basic attribute for segmentation is
image amplitude-luminance for a monochrome image and color components for a color image. Image edges and
textures are also useful attributes for segmentation [10]. There is no theory of image segmentation. As a
consequence, no single standard method of image segmentation has emerged. Rather, there are a collection of
adhoc methods that have received some degree of popularity. Because the methods are adhoc, it would be useful
to have some means of assessing their performance. The main goal of image segmentation is domain
independent partitioning of an image into a set of disjoint regions that are visually different, homogeneous and
meaningful with respect to some characteristics or computed properties, such as grey level, texture or color to
enable easy image Discontinuity and similarity/homogeneity are two basic properties of the pixels in relation to
their local neighborhood used in many segmentation methods [11].
Algorithm of thresholding techniques:
Under this section the algorithms are defined for various thresholding methods. Keeping the thresholding
techniques in mind we have made algorithms for finding the threshold value so that binarisation of an image can
be done easily.
Algorithm for Mean Thresholding:
In this the average of pixel value is calculated and is used as threshold. Various steps involved are:
1. Sum of pixel value is calculated.
2. Sum of pixels is calculated.
3. Threshold value is calculated as t=sum of pixel value/ sum of pixels (using 2 & 3).
4. This threshold value is used to convert a gray scale image into binary image.
Algorithm for Histogram thresholding:
In histogram thresholding, there are so many methods of thresholding but we are taking mid -point method for
our consideration. Various steps involved are:
1. An initial threshold value is determined, t.
2. Two different mean values are calculated for below (m1) and above (m2)
3. The new threshold value is calculated. tn = (m1 + m2) / 2.
4. If the threshold is stabilized (t = tn), then this would indicate that the new threshold level is this one. Else wise, t would become tnand it would also reiterate from step2.
Algorithm for Variable thresholding:
In variable thresholding, threshold value is changed from pixel to pixel of an image. The steps for variable
586 | P a g e
1. Input image is divided into different sub images p1, p2, p3 …p8.2. Take p1= I (1:32; 1:256).
3. Sum of pixel values of sub image is calculated.
4. Sum of pixels of sub image is calculated.
5. The threshold value is calculated as, t=sum of pixel value/ sum of pixels.
6. This threshold value is used to convert a gray scale sub image into binary sub image.
7. Steps 3 to 6 are repeated for all eight sub images.
8. All binary sub images are combined together to a single binary sub image.
The variable thresholding is also named as adaptive thresholding as threshold value is different for different sub
images.
Algorithm for Edge thresholding:
In edge thresholding method, boundaries of an object are detected. The steps involved are:
1. Gaussian filter is used to smooth the image. g(x,y)=G(x,y)*i(x,y).
2. Gradient and magnitude of g(x,y) is computed. M(x,y)=sqrt(gx2(x,y)+gy2(x,y)).
3. Direction is computed θ(x,y)=tan-1(gy(x,y)/ gx(x,y)).
4. Using a particular threshold image is thresholded.
5. Non- maxima pixel in θ(x,y) is suppressed.
6. Image is thresholded using two thresholds T1 & T2 to obtain binary images.
7. Edge segments are linked to get complete edges.
Algorithm for P-tile thresholding:
1. Set threshold by finding the intensity level.
2. Grey level is calculated by using histogram value H(g).
3. P% should have intensity less than the grey level.
4. To find the best threshold, H(g) is examined in the neighborhood of g.
III. RESULTS
The images used for investigation are bird image, boy image, building image, cameraman image and rose image
which are all grey scale images of size 256x256. Six thresholding methods are applied to all the five grey scale
images for converting them to the binary images. The parameter which is used for comparison is black pixels
ratio (BPR). The black to white pixels ratio (BWR) is calculated for each image and then the BPR is calculated
which is tabulated for comparison.
3.1 Result of Mean thresholding:
In mean thresholding results are evaluated by taking a bird image for testing purpose. The size of the image is
256x256. The picture is a gray scale image. After mean thresholding it will convert into binary image as shown
587 | P a g e
Input image Image after thresholding
Fig.1 Result of Mean thresholding
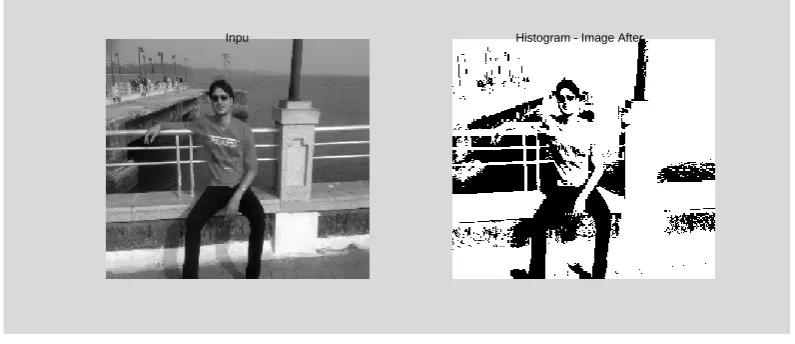
3.2 Result of Histogram thresholding:
In Histogram thresholding results are evaluated by taking boy image as an input image. The size of image is
256x256. The picture is a gray scale image. After taking a particular threshold it will convert into binary image
as shown below:
Input image Image after thresholding
Fig. 2 Result of Histogram thresholding
Parts of input image Image after thresholding
Fig. 3 Result of Variable thresholding
Inpu t Ima ge
Histogram - Image After Thresholding Input
Imag e
588 | P a g e
3.3 Result of Variable thresholding:
In variable thresholding we take a building image as a testing image. The size of image is 256x256. Image is a
gray scale image. The result of variable thresholding is as shown above where variable thresholding image is
first separated into different patches. Then individual threshold is chosen for each image and thresholding is
done. Fig.3 shows parts of input image. Image is divided into eight parts. Then threshold of each part is done.
The threshold parts of image are as shown in fig. These parts are then combined into a complete image. The
complete image is as shown below:
Fig.4 Complete thresholded image
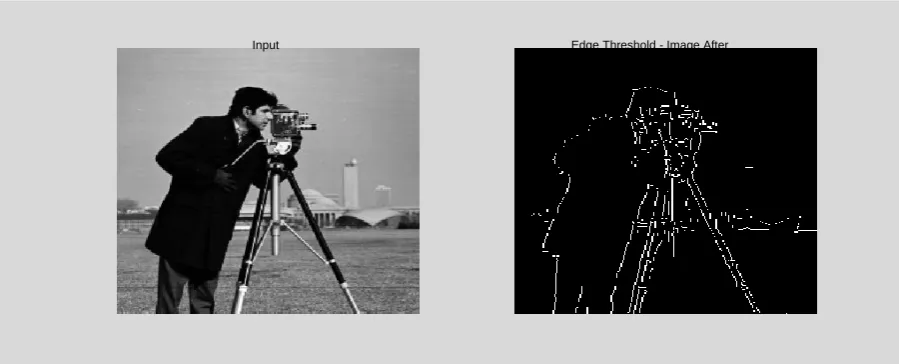
3.4 Result of Edge thresholding
In this we take cameraman image as a testing image. Edge detection is a method in which boundaries are
characterised. Edge detecting an image significantly reduces the amount of data and filters out useless
information, while preserving the important structural properties in an image. The result of edge detection with
sobel operator are as shown below:
Fig. 5 Result of Edge thresholding
3.5 Result of P-tile thresholding:
In P-tile thresholding rose image is considered as a testing image. Image used is a gray scale image of size
256x256. Result of P-tile thresholding is as shown below: Input
Image
Edge Threshold - Image After thresholding
589 | P a g e
Fig. 6 Result of P-tile thresholding
IV. COMPARISON OF VARIOUS THRESHOLDING TECHNIQUES
An objective of research work is to compare various thresholding techniques and compare them to find the best
method out of them. For this purpose various images are used for comparison by using Mean thresholding,
Histogram thresholding, Variable thresholding, Edge thresholding and P-tile thresholding method. The
parameter for comparing is Black Pixels Ratio (BPR). After applying all the five techniques to the images to be
investigated the black to white pixel ratio and black pixel ratio is calculated which is than compared and
thresholding method having the less number of BPR is evaluated which is the best method among all the five
methods and this comparison is tabulated.
Bird image:
Greyscale Image Mean thresholding Histogram thresholding
Variable thresholding Edge thresholding P-tile thresholding
Variable thresholding Edge thresholding P-tile thresholding
`
Fig 7 Comparison of bird image
input thresholding
590 | P a g e
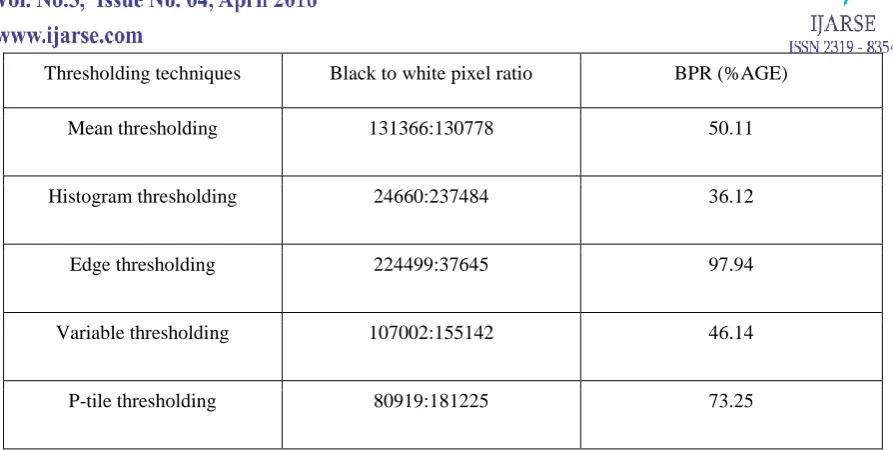
Thresholding techniques Black to white pixel ratio BPR (%AGE)Mean thresholding 131366:130778 50.11
Histogram thresholding 24660:237484 36.12
Edge thresholding 224499:37645 97.94
Variable thresholding 107002:155142 46.14
P-tile thresholding 80919:181225 73.25
Table 1 Comparison of thresholding techniques for bird image
From above table we can investigate that Histogram thresholding is the best thresholding method.V. CONCLUSION
In this paper, we make a categorized survey of image thresholding techniques. The different techniques of
thresholding have been applied to five images, which illustrate the shortcomings and advantages to the different
methods. Images are bird, boy, building, cameraman and rose. All the images are grey scale images having size
of 256x256. The performance of these techniques is taken on the basis of black pixels ratio (BPR). The image
having less number of black pixels is good binary image. We conclude that in histogram thresholding BPR is
less as compare to other methods. So, it is the best thresholding method. The images do not show sharpness. In
future such kind of thresholding methods can be developed which shows good sharpness in an image.
REFRENCES
[1] Sankur, B. and Sezgin,M., 2004, “Survey over image thresholding techniques and quantitative
performance evaluation”, Journal of Electronic Imaging 13(1), pp. 146–165.
[2] Polak, M., Zhang, H. and Pi, M., 2009,”An evaluation metric for image segmentation of multiple
objects”,Image and Vision Computing 27(8),1223-1227.
[3] Sang, U.K. LEE, Seok, Y. C., and Rae, H. P., 1990, “A Comparative Performance Study of Several
Global Thresholding Techniques for Segmentation”, Computer Vision, Graphics, And Image
Processing”52, pp. 171-190.
[4] Le, S. U., Chung, S. Y., Park, R. H., 1990, “ A Comparative Performance Study of Several Global
Thresholding Techniques for Segmentation”, Graphical Models and Image Processing, 52, 171-190
[5] Weszka, J. S., Rosenfeld, A., 1978, “Threshold evaluation techniques”, IEEE Trans. Systems, Man and
Cybernetics, SMC-8(8) 627-629.
[6] Palumbo, P. W., Swaminathan, P., Srihari, S. N., 1986, “Document image binarization: Evaluation of
algorithms”, Proc. SPIE Applications of Digital Image Proc., SPIE Vol. 697, pp:278-286.
[7] Trier, O. D., Jain, A. K., 1995, “Goal-directed evaluation of binarization methods”,IEEE Tran. Pattern
591 | P a g e
[8] Sahoo, P. K., Soltani, S., Wong, A.K.C. , Chen, Y., 1998, “A Survey of Thresholding Techniques”,Computer Graphics and Image Process, 41, 233-260
[9] Glasbey, C.A., 1993, “An analysis of histogram-based thresholding algorithms”, Graphical Models
andImage Processing, 55, 532-537.
[10] Fekete, G., Eklundh, J. O., Rosenfeld, A., 1981,”Relaxation: Evaluation and Applications”, IEEE
Transactions on Pattern Analysis and Machine Intelligence, PAMI-3 No. 4, 459-469.
[11] Ayed, I. B. and Mitche, A. ,2008. “A Region Merging Prior for Variational Level Set Image
Segmentation”. IEEE, 17(12), pp.2301-2311.
BIBLIOGRAPHY
Parul Dixit working as Assistant Professor in Gyan Bharti institute of technology ,She obtained his M-Tech
(C.E.) from Shobhit University She has been member of several academic and administrative bodies. During her
teaching she has coordinated several Technical fests and National Conferences at Institute and University Level.
She has attended several seminars, workshops and conferences at various levels. Her area of research includes
Image processing ,MATLAB , MANET (Mobile Ad-Hoc network), Database and Cloud Computing.
Nidhi Tyagi, Ph.D. in Computer Engineering in 2013, from Shobhit University,Meerut.Presently,she is
working as Associate Professor in Department of Computer Science and Engineering at Meerut Institute of
Engineering and Technology .She has a teaching experience of more than 13 years.Her research interest