Visual Challenges among Drivers: A Case
Study in Delhi, India
Dr. Neelima Chakrabarty
1, Arun Lakshman
2Kamini Gupta
3, Ankit Bhatnagar
4Principal Scientist, CSRI-CRRI, Mathura Road New Delhi, India
Sr. Marketing Manager, IDTR, Maruti Suzuki, New Delhi, India
Sr. Technical Officer, CSRI-CRRI, Mathura Road New Delhi, India
Research Intern, CSRI-CRRI, Mathura Road New Delhi, India 2
Abstract: During the last two decades, developing countries such as India have been exhibiting rapid increase in human population and vehicles, and increase in road accidents. Inappropriate driving behaviour is considered one of the major causes of road accidents in India as compared to defective geometric design of pavement or mechanical defects in vehicles.
Apart from the other factors causing accidents such as poor road design ,vehicle conditions, driver characteristics of frequent traffic violations, increase in crashes due to self-centred driving, etc. it can also be resulted in conditions such as lack of psychophysical abilities e.g. poor eye sight, poor vision at night time, glare blindness etc. Hence, improved driver screening facilities accompanied by availability of good driving aids such as anti glare glasses can be an effective and preventive measure to inhibit crash risks.
This article is based on a case study jointly done by CSIR-Central Road Research Institute and Institute of Driver Training & Research, Maruti, Loni Border, Delhi, India to highlight visual limitations among the learner drivers which can influence (as per the literature review) driving behaviour with crash chances, which can be reduced through improving safety accompanied with better driver screening, providing free visual aids and modifying present licensing procedures..
Keywords: Visual Limitation, Visual Acuity, Colour Blindness; fatigue ; Porto glare; glare blindness; Colour Perception.
I. INTRODUCTION
People driving down a highway are bombarded with a steady flow of information. Most of the informations (90%) are visual inputs about the road itself, other vehicles, pedestrians, signs, the passing scenery, etc. rest of the informations, the driver may be processing through other information sources such as auditory inputs (listening to the radio, talking on a cell phone, carrying on a conversation with another passenger), or internal inputs (remembering directions or planning for other things).Research has shown that road accidents occur for one of three main reasons. The first is
perceptual error. Sometimes critical information was below the threshold for seeing the light was too dim, the driver was blinded by glare, or the pedestrian's clothes had low contrast. In other cases, the driver made a perceptual misjudgement (a curve's radius or another car's speed or distance). The second, and far more common cause, is that the critical information was detectable but that the driver failed to attend/notice because his mental resources were focused elsewhere. Literature review have shown that one may be less likely to perceive an object if he/she is looking directly at it than if it falls outside the centre of the visual field. This "inattentional blindness" phenomenon is doubtless the cause of many accidents1.
BIOLOGICAL FACTORS EFFECTING VISION OF THE DRIVERS
Visual Acuity
Visual acuity refers to spatial resolution or the measure of one‟s vision with respect to clarity, sharpness, or sight ability. This ability results from the coherent focus of light from the region of the cornea on to the retina of the eye (Garcia, et al., 2000, 2002) [2,3]. Spatial resolution allows one to discern objects, read text, and interpret symbols and signage. Although these functions are paramount to safe driving practices at anytime and anywhere, many drivers are visually deficient due to the aging processes, heredity, medication, or trauma. A driver of any age compromises the safe operation of a motor vehicle when medical or pharmaceutical conditions prevail. Cataracts, diabetic retinopathy, glaucoma, and macular degeneration, among other vision loss conditions (Gottleib, et al. 1997)[4] may weaken colour perception, contrast sensitivity, depth perception, glare recovery, or peripheral vision components. Ultimately, these vision impairments elevate the risks of traffic collisions and violations.
Colour Vision
Colour vision, the ability to see and process differences in colours, and perception, the cognitive ability to discern among wavelengths of light, allow the driver to effectively and readily respond to signage and change of traffic signals. Individuals that are red colour blind appear Medical Conditions and Driving: to have almost twice as many rear-end collisions as those with both red and green colour deficit and normal (Verriest, Naubaauer, Marre, and Vvijls, 1980; Vingrys and Cole, 1988)[5]. Results from Steward and Cole (1989)[6] suggest that individuals with colour vision defects have difficulty, in general, when driving. In their study, a questionnaire was administered to 102 individuals with congenital colour blindness. Twenty-nine percent of the sample reported having difficulty distinguishing the colour of traffic signal lights, 32 percent to having confused traffic lights with streetlights, and 13 percent reported having difficulty in detecting brake lights on other cars. Despite the reported difficulties with colour vision discrimination while driving, it is unlikely that colour vision impairments, in general, represent a driving hazard, particularly now that the position of traffic lights has been generally standardized (Canadian Medical Association, 1999)[7]. According to Staplin (2005)[8], research does not confirm a relationship between colour deficiency and collision risk. Also, a minimum of ten minutes per computerized test may be required “…to obtain a reliable measure of colour efficiency/blindness …where the display quality (of the monitor) must be checked repeatedly to insure precise stimulus properties and a large number of trials are required to be confident of test results..”. Surprisingly, there are few studies available with data relevant to colour vision defects and crash rates.
Night Vision
Night vision is the ability to see in low light conditions. Whether by biological or technological means, night vision is made possible by a combination of two approaches: sufficient spectral range, and sufficient intensity range. Humans have poor night vision compared to many animals, in part because the human eye lacks a tapetum lucidum (Taeko Chijiiwa, Tatsuro Ishibashi, Hajime Inomata,1990)
[
9]
.An automotive night vision system is a night vision system used to improve a vehicle driver's perception and seeing distance in darkness or poor weather. Such systems typically use infrared cameras, sometimes combined with active illumination techniques, to collect information that is then displayed to the driver. Such systems are currently offered as optional equipment on certain premium vehicles.Glare Recovery
According to the Dr Sanjay Dhawan [10] “Glare can be defined as the contrast lowering effect of stray light in a visual scene. Glare forms a veil of luminance which reduces the contrast and thus the visibility of a target is decreased. We cannot see intensity differences efficiently in the presence of a high background of light intensity. And the sensitivity to glare is amplified as scattering in cornea or lens increases. High beam of head-light of an on-coming car has blinding effect and decreases visibility dangerously. A fielder in the outfield of a cricket match misses a crucial catch because of glare from the flood lights or the sun.”
IMPORTANT ISSUES PERTAINING TO THE PRESENT LICENSING SYSTEM IN INDIA AND ABROAD
Inadequate Visual Screening System
No vision tests at driver‟s license bureaus in the United States and other countries include a screening component for glaucoma or Age-Related Macular Degeneration (AMD), two of the fastest growing diseases that can result in vision loss.
No vision tests at driver‟s license bureaus in the United States and other countries offer “Dynamic Vision Assessment for Drivers” (ESRA DVAT ™) that include responses to ambient light and simulated weather conditions, useful for the
vision screening of at-risk drivers, novice drivers, and older drivers.
Results from a large-scale study (Diller, Cook, Leonard, Dean, Reading, and Vernon, 1998) [12] indicate that individuals who have a history of eye conditions that may affect driving have a higher risk of crashes compared to controls matched on age, gender, and county of residence.
Current Driving Licensing System in India
In India, issuing license is considered officially a state matter. In each state, driving license is issued by the Regional Transport Offices (RTOs). Unfortunately, prior driver education is not mandatory for getting a driver license. All matters related to driver education and licensing in India are presently regulated by the Motor Vehicle Act 1988 and the Central Motor Vehicles Rule 1989. The following are some of the glaring lacunae in these regulations.
• As per Sub-section (1) of Section-4 of the Motor Vehicle Act 1988, a motorcycle with engine capacity not exceeding 50 cc and without gear (provided parents/guardian consent obtained) may be driven in a public place by a person after attaining the age of 16 years. This is potentially hazardous as young drivers are more involved in crashes and two-wheeler drivers are among the vulnerable road users.
• As per Sub-section (3) of Section-8 of the Motor Vehicle Act 1988, a self-declaration, medical certificate from a registered medical practitioner in case of a non-transport and transport vehicle respectively, is sufficient for grant of learner’s license in India. If not declared with truthfulness, this could pose serious safety hazards due to presence of drivers with certain physical abnormalities in traffic and which may hinder the driver from safe driving. This risk is clearer from the recent study of Chauhan [13].
• As per Sub-section (3) of Section-9 of the Motor Vehicle Act 1988, where the application is for a driving license to drive a motor vehicle (not being a transport vehicle), the licensing authority may exempt the applicant from the test of competence to drive a vehicle prescribed under this sub-section, if the applicant possesses a driving certificate issued by any institution recognized by the state government. This also poses road safety risks as the driver is given license merely based on a certificate, which may not have been issued after subjecting the individual to adequate training and education which is very much essential.
• Sub-section (3) of Section-15 of the Central Motor Vehicles Rules 1989 lays down criteria of only practical driving test, which focuses only on basic vehicle control and manoeuvring capabilities. However, even these criteria are seldom followed by the person conducting the test.
• Section-31 of the Central Motor Vehicles Rules 1989 elaborates the syllabus to be followed by driving schools for imparting theoretical instructions in driving of motor vehicles. This includes only basic driving, traffic and vehicle maintenance education, which is seldom pursued by driving schools in India. Also, no formal published material
(based on the prescribed syllabus) is available to impart the driver education.
Above all, the present system in India is totally based on conventional driver education and testing, which has serious limitations with respect to road safety as highlighted by Christie [14].
Studies Conducted in India
Three per cent of the drivers failed in the phoria test, which checks for proper eye muscles and co-ordination of both eyes to correctly identify the placement of an object ahead. If a particular driver performs „unacceptable‟ in this test, then it indicates that the driver may not be able to identify the position of an object such as, vehicle, pedestrian, etc. in front of him/her on the road correctly.
Seven per cent of the drivers failed in the glare recovery test, which is an important parameter for safe driving during night, especially on undivided roads, which are predominant in India, and where there is a substantial glare of headlight of the opposing vehicles.
Five per cent of the drivers were found to have problem of tunnel vision while driving, which shows that such drivers may not be able to identify the side obstructions and correspondingly respond to the stimulus on time. Fifteen per cent of the drivers were found to have unacceptable acuity vision in one of the eyes and 4% in
both the eyes.
Five per cent of the drivers had problem with night vision (vision in the presence of headlight). Performance of 5% of the drivers was found „unacceptable‟ in colour vision test.
Similarly, based on a study conducted in Hyderabad[15] in India, it was observed that about 11% of motorized two wheeler drivers drive the vehicle without possessing driving license. This tendency was higher in the case of drivers aged between 16 and 25 years. Also, 0.5% was found to get a driver license before 15 years of age. Out of all license holders who were surveyed in the study, 21.4% had obtained the license without taking the mandatory driving test. Thirty per cent of the drivers were found to overtake other vehicles from any side depending on traffic conditions. Over 50% were found to drive the vehicle in the direction opposite to the flow of traffic. Out of all the drivers who were caught by the traffic police, 56% paid the fine while 26% paid bribe to escape. Regarding vehicle conditions, 49% of drivers had no rear view mirror.
Studies Conducted in Other Countries
Studies have shown that problems with visual acuity affect more than 2.4 million Americans (1.98 percent) age 40 years and over (Taylor and Mitchell, 2004)[16]. In most states, the measurement of visual acuity, a primary gauge of the extent of functional impairment due to vision loss (National Research Council, 2002)[17], is required to pass a driver‟s license test. At a standard distance, a patient views the Snellen Eye Chart, a letter chart that is nearly universal in its application to clinical and research usages. The Snellen Eye Chart, developed in 1862 by Dr. Hermann Snellen, a Dutch ophthalmologist, may today include a series of letters or letters and numbers, with the largest at the top. Snellen-type charts are generally prescribed under ideal conditions (daytime lighting) and the absence of extraneous light sources. According to the National Research Council (2002)[17], the results of this visual acuity test “…are usually expressed in Snellen notation, the ratio of the test distance to the distance at which the critical detail of the smallest optotype resolved would subtend 1 minute of visual angle.” Opto types refer to the letters, numbers, and symbols that assess the function of different retinal areas.
Although visual loss conditions and visual deterioration can affect people at any age, these most often impact older drivers as part of the aging process. In 2002, among the drivers with any violation, daylight conditions account for the majority of collisions in the age 55 years and older population. The cohorts age 65 years and older constitute the largest percentage of drivers who fail to yield the right of way (Williams et al., 2003)[18]. The proportionally higher number of these types of collisions in Arizona suggests that the current visual acuity testing methods for drivers may be inadequate. According to Pitts, visual acuity rapidly declines with increasing age after age 50 years. Studies by Decina and Staplin (1990)[19] reveal the onset of this change at approximately age 45 years. This study demonstrates that an increase in at-fault collision involvement coincides with the drivers, age 50 to 59 years, in both Arizona and Florida. Drivers age 80 to 89 years primarily exhibit the highest Relative Accident Involvement Ratio (RAIR). They are most likely at-fault in collisions, compared to their younger counterparts. These values are in good agreement with that illustrating collision involvement due to visual defects.
Margins, column widths, line spacing, and type styles are built-in; examples of the type styles are provided throughout this document and are identified in italic type, within parentheses, following the example. Some components, such as multi-leveled equations, graphics, and tables are not prescribed, although the various table text styles are provided. The formatter will need to create these components, incorporating the applicable criteria that follow.
II. PRESENT STUDY
Sample Size and characteristics
Out of two hundred drivers of different age groups, one hundred and forty six drivers could complete the whole series of tests. All of the subjects were male and were comprised of different age groups, educational background and economic status.
Tools
Porto Clinic and Porto Glare were used to measure all the tests, these two equipments are semi microprocessor based, hence results are objective.
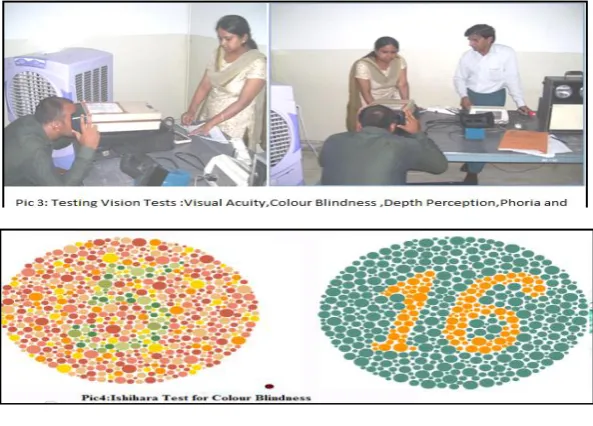
Porto Clinic: It is portable apparatus for testing automotive operators for visual acuity, colour blindness, depth perception, horizontal field test & phoria (Pic 1). In the test the driver has to read the Snellen chart letters or similar numbers, followed by the Ishihara colour blindness test where the driver has to identify the correct number inside the chart (Pic 4), to see the driver‟s comfortability no time limits are set for these tests.
Porto Glare: is equipment for measuring the drivers‟ reaction towards glare and low luminance (night time visibility). With this equipment two tests i.e. night vision and glare recovery test are measured.
Glare recovery Test: As described above ,the test conducted by CSIR-CRRI ,the Porto glare instrument was used in which head lights (standardized as of vehicles headlights) were flashed on the eyes of the driver for a fixed (computerised) time them Snellen chart letters are shown on the white screen presented below the headlight (computerised). The driver has to identify the letters correctly within 8 secs. In case he fails to read within time then he has a problem with glare (glare blind).
Night Vision Test: As described above, the test conducted by CSIR-CRRI, the Porto glare instrument was used in night vision test, in which Snellen chart letters are shown on the white screen at standardized luminance (computerised). The driver has to identify the letters correctly within 8 secs. In case he fails to read within time then he has a problem with night time visibility.
LIST OF TABLES
Table-I: Performance of the drivers on Glare Test
Grade Remarks Number of drivers Percentage
10 Outstanding 2 1
9 Excellent 5 3
8 Very Good 25 17
7 Good 46 32
6 Reasonably Good 27 18
5 Satisfactory 22 15
4 Above Average 4 3
3 Average 3 2
2 Below Average 8 5
1 Poor 4 3
Table-II: Performance of the drivers on Night Vision Test
Grade Remarks Number Percentage
10 Outstanding 4 3
9 Excellent 11 8
8 Very Good 50 34
7 Good 34 23
6 Reasonably Good 14 10
5 Satisfactory 18 12
4 Above Average 3 2
3 Average 3 2
2 Below Average 6 4
1 Poor 3 2
Table -III: Performance of the drivers on Colour-Blindness Test
Grade Remarks Number percentage %
3 Normal 95 65
2 Retest Needed 26 18
Table-IV (a): Performance of the drivers on Both Eyes Visual Acuity Test
Grade Remarks Number %
3 Normal 91 62
2 Retest Needed 39 27
1 Un Successful 16 11
Table-IV (b): Performance of the drivers on Right Eye Visual Acuity Test
Grade Remarks Number Percentage
3 Normal 80 55
2 Retest Needed 43 29
1 Un Successful 23 16
Table-IV (c): Performance of the drivers on Left Eye Visual Acuity Test
Grade Remarks Number Percentage
3 Normal 98 67
2 Retest Needed 30 21
1 Un Successful 18 12
Table- V: Performance of the drivers on Phoria Test
Grade Remarks Number Percentage
3 Normal 106 73
2 Retest Needed 27 18
1 Un Successful 13 9
Table-VI: Performance of the drivers on Horizontal Field Test (Left Side)
Grade Remarks Number %
3 Normal 124 73
2 Retest Needed 18 18
1 Un Successful 4 9
Table-VII: Performance of the drivers on Horizontal Field Test (Right Side)
Grade Remarks Number %
3 Normal 123 84
2 Retest Needed 19 13
1 Un Successful 4 3
IV. ANALYSIS OF THE RESULTS
Glare Recovery Test:
Observations: The observance of the data analysis has shown that in glare test 28% drivers have performed satisfactory or below for glare recovery time, where 5% have shown below average and 3% have shown poor for glare recovery time ( table-I).
Night Vision Test:
Observations: The observance of the data analysis has shown that in glare test 22% drivers have performed satisfactory or below for glare recovery time, where 4% have shown below average and 2% have shown poor for glare recovery time (table-II).
Suggestions: These drivers should avoid night driving and consult medical practitioner before providing any license.
Colour Blindness Test
Observations: The observance of the data analysis has shown that in 18% drivers needed retesting and 17% have performed have poor for colour blindness (table-III).
Suggestions: For colour blindness the driver should consult medical practitioner before provided license.
Visual Acuity Test:
Observations: Visual Acuity Test (Both Eyes): The observance of the data analysis has shown that in the visual acuity test for the both eyes 27% drivers needed retesting and 11% have performed have poor for visual acuity test (table-IVa).
Visual Acuity Test (Right Eye): The observance of the data showed that in the visual acuity test for the right eye 29% drivers needed retesting and 16% have performed have poor or failed for visual acuity test (table-IVb).
Visual Acuity Test (Left Eye): The observance of the data showed that in the visual acuity test for the left eye 21% drivers needed retesting and 12% have performed have poor or failed for visual acuity test (table-IVc).
Suggestions: As 90% of the information inputs are provided through the driver‟s Eye only so the drivers with poor eye sight should be provided proper eye glasses and consult medical practitioner before providing learning or permanent license.
Test of Phoria:A phoria is a latent deviation, or misalignment, of the eyes that is only apparent some of the time. A phoria appears when fixation on a single object is broken and the eyes are no longer looking at the same object. If a large amount of phoria is detected, your eyes are not aimed at the target while at rest. Keeping both eyes fixated on the target requires an effort by you, possibly causing eyestrain or headaches.
Horizontal Field Test: The central field of vision for most people covers an angle of between 50° to 60°. Within this angle, both eyes observe an object simultaneously. This creates a central field of greater magnitude than that possible by each eye separately. This central field of vision is termed the 'binocular field' and within this field images are sharp, depth perception occurs and colour discrimination is possible The International Council of Ophthalmology has suggested the driving field requirements, which have been adopted by the Driver and Vehicle Licensing Agency (DVLA) in both the United Kingdom and US; this states that 120 degrees of horizontal field for both eyes are required for passing marks for obtaining license.
V. CONCLUSION OF THE STUDY
The study concludes that a) 8% drivers below average and poor in glare test b) 6% below average and poor in night vision test c) 17% drivers performed poor in colour blindness test d) 11% drivers failed in visual acuity test for both eyes e) 16 % drivers performed poor in visual acuity test for right eye f) 12 % drivers performed poor in visual acuity test for left eye.
VI. MERITS OF THE STUDY
All the equipments are computerised hence the results are objective and compared with international standards. Time and instructions are set and standardized as per Norms.
VII. LIMITATIONS OF THE STUDY
Study was conducted in IDTR premises for a short time period hence the sample population was small. Moreover, each equipment has different controlled parameters or dependent variables (D.V.) e.g. Porto glare equipment needs dark room condition, for achieving such D.V.s for each equipment separately in the same room, more time was consumed so the numbers of less number of subjects could be tested.
VIII. RECOMMENDATIONS
Currently, India follows a single-phase licensing system with probationary period. It is worth amending the driving licensing system in India considering the international experience quoted in this paper and hence the following preliminary recommendations have been made for improving the road safety situation in India.
A. Need for a Comprehensive Vision Assessment System
For achieving UNO Mission Road Safety Vision - 2020, even one percent of drivers should not be spared for unsafe capabilities. For this there exists an urgent need for automated visual acuity testing for each applicant of refresher course trainee or learner /permanent license. A fast and effective visual acuity test, such as the B1Max ™ 3-D Computer-Automated Threshold Amsler Grid Test (3DAGT), appropriately called the Modified 3DAGT may be used. This version potentially screens any visual disease or injury that affects the central visual field, including glaucoma and AMD of transportation licensees and applicants. An automated vision condition test is envisaged as part of the ESRA Dynamic Vision Assessment for Transportation (ESRA DVAT ™).This combines high- and low- contrast visual acuity screening and offers successful deployment as demonstrated through the widespread distribution of Road wise Review® through AAA, the largest Automobile Association operating nationally and internationally.
Charman (1997)[20] discusses the challenges that countries face when setting or seeking to modify visual standards for drivers. These appear to relate directly to the difficulty of defining statistical thresholds of safe and unsafe drivers. While restricted licenses appear to strengthen visual standards of some drivers, others, especially drivers suffering from dementia, may go unnoticed due to the inadequate vision testing processes.
IX. SCOPE FOR FURTHER WORK
The recommendations made in this article to improve road safety in India are preliminary and there is substantial scope to work further in the following directions.
Quantification of the impacts of improved psychophysical traits on road safety and mobility in India. Developing the complete framework for driver education and licensing in India.
Addressing practical issues (differences of language, literacy level of applicants, etc.) in implementation of the proposed framework.
ACKNOWLEDGEMENT
This research paper is made possible with the help and support from everyone in the team. Especially, our acknowledgment of gratitude towards the following significant advisors and contributors: First and foremost, we would like to thank Director, Central Road Research Institute for his support and encouragement towards this research area. Second, we would like to thank Dr. S. Velmurugan, Head of the Department, Traffic Engineering and Safety Division for providing valuable suggestions for initialing the research project.
REFERENCES
[1] U.S. Department of Transportation Federal Highway Administration “Visual Disorders and Commercial Drivers” Office of Motor Carriers Washington, D.C. 20590, FHWA-MC-92-003, 1991.
[2] Garcia, A.; P. Cacho. "Evaluating relative accommodations in general binocular dysfunctions." Optometry and Vision Science 79(12): 779-87, 2002.
[3] Garcia, A., P. Cacho, et al. "The relation between accommodative facility and general binocular dysfunction." Ophthalmic and Physiological Optics 20 (2): 98-104,2000.
[4] Gottlieb DD, Fuhr A, Hatch WV, et al. Neuro-optometric facilitation of vision recovery after acquired brain injury. Neuro-Rehabilitation, 11:175–99, 1998.
[5] Verriest, G., Naubauer, O., Marre, M., & Uvijls, A New investigations concerning the relationships between congenital colour vision defects and road traffic security. International Ophthalmology, 2, 887-899, 1980.
[7] Canadian Medical Association “Determining medical fitness to drive a guide for physicians”. Ottawa, Canada; 2000.
[8] Staplin, L. and Lococo, K. H. Summary of Medical Advisory Board Practices in the United States. National Highway Traffic Safety Administration. Accessed October 15, 2005.
[9] Taeko Chijiiwa, Tatsuro Ishibashi, Hajime Inomata “Histological study of Choroidal Melanocytes in animals with tapetum lucidum cellulosum,” Graefe's Archive for Clinical and Experimental Ophthalmology, Volume 228, Issue 2, pp 161-168,1990.
[10] Sanjay Dhawan Site: www.sdhawan.com/ophthalmology/glare.html
[11] McCloskey, L. W., T. D. Koepsell, M. E. Wolf, and D. M. Buchner “Motor vehicle collision injuries and sensory impairments of older drivers.” Age Aging 23:4: 267-273, 1994.
[12] Diller, E., Cook, L., Leonard, D., Reading, J., Dean, J.M., and Vernon, D. “Evaluating Drivers Licensed with Medical Conditions in Utah”, 1992-1996. U.S.DOT/NHTSA Publication No. DOT HS 809 023. Washington, D.C. 1999.
[13] Chauhan, S., Influencing traffic problem parameters through improved driver education and licensing, B Tech Thesis, IIT, Guwahati, 2009. [14] R. Christie “Driver Licensing Requirements and Performance Standards including Driver And Rider Training” Driver Licensing Requirements
and Performance Standards Including Driver and Rider Training, Report Prepared by Dr Ron Christie, RCSC Services Pty Ltd, ISBN 0 642 54468 , May 2000.
[15] Dandona, R., Kumar, G. A. and Dandona, L., Risky behaviour of drivers of motorized two wheeled vehicles in India. J. Safety Res., 37(2), 149– 158, 2006.
[16] Taylor HR ; Congdon N, O'Colmain B, Klaver CC, Klein R, Muñoz B, Friedman DS, Kempen J, Mitchell P; Eye Diseases Prevalence Research Group “ Causes and prevalence of visual impairment among adults in the United States.” Arch Ophthalmology, 122(4):477-85, 2004. [17] National Research Council (2002) url: http://policy.ssa.gov/poms.nsf/lnx/0424535006
[18] Williams et al., url: http://www.esracorp.com/559LITERATUREREVIEW.pdf, 2003.
[19] Decina, L. E.; Staplin, L. & Spiegel, A. Correcting unaware vision impaired drive on tract No. 730008.Harrisburg: Pennsylvania Department of Transportation, 1990.