c e-ISSN: 2348-6848, p- ISSN: 2348-795X Volume 2, Issue 12, December 2015
International Journal of Research (IJR)
Available at http://internationaljournalofresearch.orgCut Detection in Wireless Sensor Networks
Mr D Shiva Rama Krishna
1& K Srishailam
21
Associate Professor, Dept of CSE, Marri Laxman Reddy Institute Of Technology & Management,
Hyderabad, Telangana
2
M.Tech CSE (PG Scholar), Dept of CSE, Marri Laxman Reddy Institute Of Technology &
Management, Hyderabad, Telangana
Abstract
—
A wireless sensor network can get separated into multiple connected components due to the
failure of some of its nodes, which is called a “cut”. In this article we consider the problem of detecting
cuts by the remaining nodes of a wireless sensor network. We propose an algorithm that allows (i) every
node to detect when the connectivity to a specially designated node has been lost, and (ii) one or more
nodes (that are connected to the special node after the cut) to detect the occurrence of the cut. The
algorithm is distributed and asynchronous: every node needs to communicate with only those nodes that
are within its communication range. The algorithm is based on the iterative computation of a fictitious
“electrical potential” of the nodes. The convergence rate of the underlying iterative scheme is
independent of the size and structure of the network. We demonstrate the effectiveness of the proposed
algorithm through simulations and a real hardware implementation.
Index Terms
—wireless networks; sensor networks; network separation; detection and estimation;
iterative computation
✦
1 INTRODUCTION
WIRELESS sensor networks (WSNs) are a promising technology for monitoring large regions at high spatial and temporal resolution. However, the small size and low cost of the nodes that makes them attractive for widespread deployment also causes the disadvantage of low operational reliability. A node may fail due to various factors such as mechanical/electrical problems, environmental degradation, battery depletion, or hostile tampering. In fact, node failure is expected to be quite common due to the typically limited energy budget of the nodes that are powered by small batteries. Failure of a set of nodes will reduce the number of multi-hop paths in the network. Such failures can cause a subset of nodes – that have not failed – to become disconnected from the rest, resulting in a ―cut‖. Two nodes are said to
be disconnected if there is no path between them. We consider the problem of detecting cuts by the nodes of a wireless network. We assume that there is a specially designated node in the network, which we call
the source node. The source node may be a base station
that serves as an interface between the network and its users; the reason for this particular name is the electrical analogy introduced in Section 2.2. Since a cut may or may not separate a node from the source node, we distinguish between two distinct outcomes of a cut for a particular node. When a node u is disconnected from the
source, we say that a DOS (Disconnected frOm Source) event has occurred for u. When a cut occurs in the network that does not separate a node u from the source node, we say that CCOS (Connected, but a Cut Occurred
• P. Barooah is with the Dept of Mechanical and
Aerospace Engineering, University of Florida, Gainesville, FL 32611. E-mail: [email protected]
• H. Chenji and R. Stoleru are with Dept of Computer
Science and Engineering, Texas A&M University,
College Station, TX 77845. E-mail:
[email protected], [email protected]
• T. Kalm´ar-Nagy is with the Dept of Aerospace
c e-ISSN: 2348-6848, p- ISSN: 2348-795X Volume 2, Issue 12, December 2015
International Journal of Research (IJR)
Available at http://internationaljournalofresearch.orgAvailable online:http://internationaljournalofresearch.org/ P a g e | 439
Somewhere) event has occurred for u. By cut detection we mean (i) detection by each node of a DOS event when it occurs, and (ii) detection of CCOS events by the nodes close to a cut, and the approximate location of the cut. By ―approximate location‖ of a cut we mean the location of one or more active nodes that lie at the boundary of the cut and that are connected to the source. Nodes that detect the occurrence and approximate locations of the cuts can then alert the source node or the base station.
To see the benefits of a cut detection capability, imag-ine that a sensor that wants to send data to the source node has been disconnected from the source node. With-out the knowledge of the network’s disconnected state, it may simply forward the data to the next node in the routing tree, which will do the same to its next node, and so on. However, this message passing merely wastes precious energy of the nodes; the cut prevents the data from reaching the destination. Therefore, on one hand, if a node were able to detect the occurrence of a cut, it could simply wait for the network to be repaired and eventually reconnected, which saves on-board energy of multiple nodes and prolongs their lives. On the other hand, the ability of the source node to detect the occurrence and location of a cut will allow it to undertake network repair. Thus, the ability to detect cuts by both the disconnected nodes and the source node will lead to the increase in the operational lifetime of the network as a whole. A method of repairing a disconnected network by using mobile nodes has been proposed in [1]. Algorithms for detecting cuts, as the one proposed here, can serve as useful tools for such network repairing methods. A review of prior work on cut detection in sensor networks, e.g. [2], [3], [4] and others, is included in the Supplementary Material.
In this article we propose a distributed algorithm to
detect cuts, named the Distributed Cut Detection (DCD)
asynchronous: it involves only local communication be-tween neighboring nodes, and is robust to temporary communication failure between node pairs. A key com-ponent of the DCD algorithm is a distributed iterative computational step through which the nodes compute their (fictitious) electrical potentials. The convergence rate of the computation is independent of the size and structure of the network.
The DOS detection part of the algorithm is applicable to arbitrary networks; a node only needs to communicate a scalar variable to its neighbors. The CCOS detection part of the algorithm is limited to networks that are deployed in 2D Euclidean spaces, and nodes need to know their own positions. The position information need not be highly accurate. The proposed algorithm is an extension of our previous work [5], which
partially examined the DOS detection problem.
2
D
ISTRIBUTEDC
UTD
ETECTION2.1 Definitions and Problem Formulation
Time is measured with a discrete counter k = −∞, . . . ,
−1, 0, 1, 2, . . . . We model a sensor network as a
time-varying graph G(k) = (V(k), E(k)), whose node set V(k)
represents the sensor nodes active at time k and the
edge set E(k) consists of pairs of nodes (u, v) such that
nodes u and v can directly exchange messages between each other at time k. By an active node we mean a node that has not failed permanently. All graphs
considered here are undirected, i.e., (i, j) = (j, i). The
neighbors of a nodeiis the setNiof nodes connectedto
i, i.e. Ni= {j|(i, j)∈ E}. The number of neighbors of i, |Ni
(k)|, is called its degree, which is denoted by di (k). A
path from i to j is a sequence of edges connecting i and
j. A graph is called connected if there is a path between
every pair of nodes. A component Gc of a graph G is a
maximal connected subgraph of G (i.e., no other
connected subgraph of G contains Gc as its subgraph).
In terms of these definitions, a cut event is formally
defined as the increase of the number of components of a graph due to the failure of a subset of nodes (as
depicted in Figure 1). The number of cuts associated
with a cut event is the increase in the number of components after the event.
The problem we seek to address is twofold. First, we want to enable every node to detect if it is disconnected from the source (i.e., if a DOS event has occurred). Second, we want to enable nodes that lie close to the cuts but are still connected to the source (i.e., those that experience CCOS events) to detect CCOS events and alert the source node.
c e-ISSN: 2348-6848, p- ISSN: 2348-795X Volume 2, Issue 12, December 2015
International Journal of Research (IJR)
Available at http://internationaljournalofresearch.orgV
H
R
(a) A cut (b) A cut
w
u
vVH
(c) Two holes (d) A hole
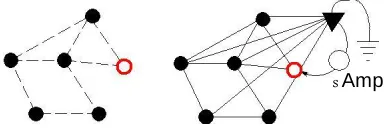
Fig. 1. Examples of cuts and holes. Filled circles rep-resent active nodes and unfilled filled circles represent failed nodes. Solid lines represent edges, and dashed lines represent edges that existed before the failure of the nodes. The hole in (d) is indistinguishable from the cut in
(b) to nodes that lie outside the region R.
the possibility that the algorithm may not be able to tell a
large hole (one whose circumference is larger thanℓmax) from a cut, since the examples of Figure 1(b) and (c) show that it may be impossible to distinguish between them. Note that the discussion on hole detection part is limited to networks with nodes deployed in 2D.
2.2 State update law and electrical analogy
The DCD algorithm is based on the following electrical analogy. Imagine the wireless sensor network as an electrical circuit where current is injected at the source
node and extracted out of a common fictitious node that
is connected to every node of the sensor network. Each
edge is replaced by a 1Ω resistor. When a cut sepa-rates
certain nodes from the source node, the potential of
each of those nodes becomes 0, since there is no
current injection into their component. The potentials are computed by an iterative scheme (described in the sequel) which only requires periodic communication among neighboring nodes. The nodes use the computed potentials to detect if DOS events have occurred (i.e., if they are disconnected from the source node).
To detect CCOS events, the algorithm uses the fact that the potentials of the nodes that are connected to the source node also change after the cut. However, a change in a node’s potential is not enough to detect CCOS events, since failure of nodes that do not cause a cut also leads to changes in the potentials of their neighbors. Therefore, CCOS detection proceeds by using probe messages that are initiated by certain nodes that encounter failed neighbors, and are forwarded from one node to another in a way that if a short path exists
around a “hole” created by node failures, the message
s Amp
Fig. 2. A graph describing a sensor network G (left), and the associated fictitious electrical network Gelec (right). s
Amp current is injected into the electrical network through the “source node” (unfilled circle), and extracted through the “ground” node (filled triangle). The line segments in the electrical network are 1Ω
resistors.
will reach the initiating node. The nodes that detect CCOS events then alert the source node about the cut.
Every node keeps a scalar variable, which is called its
state. The state of nodeiat timek is denoted byxi(k).Every
node i initializes its state to 0, i.e., xi(0) = 0,∀i. During the time interval between the kth and k + 1th iterations, every node i
broadcasts its current state xi (k) and listens for broadcasts from its current neighbors. Let Ni(k) be the set of neighbors of node i at time k. Assuming successful reception, i has access to thestates of its neighbors, i.e., xj(k) for j∈ Ni(k), at the end of this time period. The node then updates its state according to the following state update law (the index i = 1 corresponds to the source node), where the source strength s (a positive number) is a design parameter:
1
X
xi (k + 1) = di (k) + 1 xj (k) + s1{1}(i) , (1)
j∈NI (k)
where di(k) :=|Ni(k)| is the degree of node i at time k, and 1A(i) is the indicator function of the set A. That is,
1{1}(i) = 1 if i= 1 (source node), and 1{1}(i) = 0 if i6= .1 After
the state is updated, the next iteration starts. At
deployment, nodes go through a neighbor discovery and every node i determines its initial neighbor set Ni(0). After that, i can update its neighbor list Ni(k) as follows. If no messages have been received from a neighboring
node for the past τdrop iterations, node i drops that node
from its list of neighbors. The integer parameter τdrop is a
design choice.
To understand the state update law’s relation to the
electrical analogy described earlier, given an undirected
c e-ISSN: 2348-6848, p- ISSN: 2348-795X Volume 2, Issue 12, December 2015
International Journal of Research (IJR)
Available at http://internationaljournalofresearch.orgAvailable online:http://internationaljournalofresearch.org/ P a g e | 441
an electrical network (Gelec, 1) is imagined by assigning to
every edge of Gelec a resistance of 1 Ω. Figure 2 shows a graph G and the corresponding fictitious electrical network
(Gelec,1). It will be shown later in Theorem 1 (Section 2.4) that the state update law is simply an iterative procedure to
u
v
(a) G before cut
(b) G(k) for k >100
5 x 10⁻³
0.02
4 0.015
(
)k3 0.01
( ) k
u2 v
x x
1 0.005
00 50 100 150 00 50 100 150
k k
(c) state of node u (d) state of node v
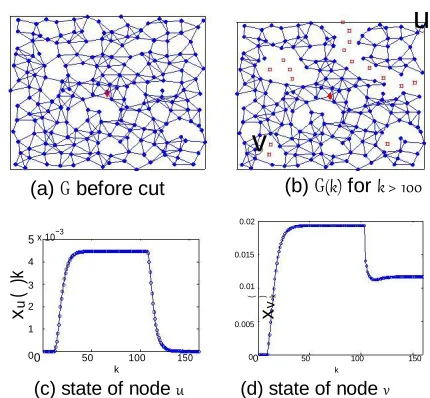
Fig. 3. (a)-(b): A sensor network with 200 nodes, shown before and after a cut. The cut occurs, at k=100, due to the failure of the nodes shown as red squares. The source node is at the center. (c)-(d): The states of two nodes u and v as a function of iteration number.
compute the node potentials in the electrical network (Gelec, 1) in which s
Ampere current is injected at the source node and extracted through
the grounded node g. The potential of the grounded node g is held at 0.
When the sensor network G is connected, the state of a
node converges to its potential in the electrical network (Gelec, 1), which is a positive number. If a cut occurs,
the potential of a node that is disconnected from the
source is 0; and this is the value its state converges to. If
reconnection occurs after a cut, the states of reconnected nodes again converge to positive values. Therefore, a node can monitor whether it is connected or separated from the source by examining its state.
The above description assumes that all updates are done synchronously. In practice, especially with wireless communication, an asynchronous update is preferable. The algorithm can be easily extended to asynchronous setting by letting every node keep a buffer of the last received states of its neighbors. If a node does not receive messages from a neighbor during the interval between two iterations, it updates its state using the last successfully received state from that neighbor. In the asynchronous setting every node keeps a local iteration counter that may differ from those of other nodes by arbitrary amount.
Figure 3 shows the evolution of the node states in a
network of 200 nodes when the states are computed using the update law described above. The source node is at the center. The nodes shown as red squares in
Figure 3(b) fail at k=100, and thereafter they do not
par-ticipate in communication or computation. Figure 3(c-d)
show the time evolution of the states of the two nodes u
and v, which are marked by circles in Figure 3(b). The
state of node u (that is disconnected from the source due
to the cut) decays to 0 after reaching a positive value, whereas the state of the node v (which is still connected after the cut) stays positive.
2.3 The Distributed Cut Detection (DCD) Algorithm
2.3.1 DOS detection
The approach here is to exploit the fact that if the state is close to 0 then the node is disconnected from the source, otherwise not (this is made precise in Theorem 1 of Section 2.4). In order to reduce sensitivity of the algorithm to variations in network size and structure, we use a normalized state. DOS detection part con-sists of steady-state detection, normalized state compu-tation, and connection/separation detection. Every node
i maintai ns a binar y variable d ( k), whic h is set t o 1
DOSi
if the node believes it is disconnected from the source
and 0 otherwise. This variable, which is called the DOS
status, is initialized to 1 since there is no reason to
believea node is connected to the source initially.
A node keeps track of the positive steady states seen in the past using the following method. Each node i computes the normalized state difference δxi (k) as follows:
xI (k)−xI (k−1)
if xi (k − 1) > ǫ
δx
i(k) =
(
∞
xI(k−1)zero
otherwise
where ǫzero is a small positive number. A node i keeps a Boolean
variable PSSR (Positive Steady State Reached) and updates
PSSR(k) ← 1 if |δxi (κ)| < ǫ x for κ = k − τguard, k − τguard + 1, . . . , k
(i.e., for τguard consecutive iterations), where ǫ x is a small positive
number and τguard is a small integer. The initial 0 value of the state
is not considered a steady state, so PSSR(k) = 0 for
k = 0, 1, . . . , τguard.
Each node keeps an estimate of the most recent
“steady state” observed, which is denoted by xˆssi (k). This
estimate is updated at every time k according to the
following rule: if PSSR(k) = 1, then xˆssi (k) ← xi (k),
other-wise xˆssi (k) ← xˆssi (k − 1). It is initialized as xˆssi (0) = ∞.
Every node i also keeps a list of steady states seen in the past, one value for each unpunctuated interval of time during which the state was detected to be steady.
This information is kept in a vector Xˆ iss(k), which is
initialized to be empty and is updated as follows. If PSSR(k)
= 1 but PSSR(k −1) = 0, then xˆss (k) is appended
to Xˆ iss(k) as a new entry. If steady state reached was
detected in both k and k − 1 (i.e., PSSR(k) = PSSR(k −
c e-ISSN: 2348-6848, p- ISSN: 2348-795X Volume 2, Issue 12, December 2015
International Journal of Research (IJR)
Available at http://internationaljournalofresearch.org1) = 1), then the last entry of Xi (k) is updated to xˆi
For instance, for the node v in the network shown in
Figure 3(a-b), ˆ ss (3) = φ (empty), ˆ ss (60) = [0.0019]
Xv Xv
ˆ ss
(150) = [0.019, 0.012]T . For future use, we also
and Xv
define an unsteady interval for a node i, which is a set of two local time counters [ki(1), ki(2)] such that the state xi (ki(1) − 1) is a steady-state (i.e., PSSR(ki(1) − 1) = 1) but xi (ki(1)) is not, and xi (ki(2) ) is not steady but xi
(ki(2) +1) is.
With reference to Figure 3(d), the last unsteady interval
for node v at time 150 is [81, 101]T .
Each node computes a normalized state xnormi (k) as:
xI (k) ss norm xˆSS
(k) if xˆi (k) > 0
xi
(k) :=
(
∞
I otherwise ,where xˆss (k) is the last steady state seen by i at k, i.e., the
i
ˆ ss
(k). If the normalized state of i
last entry of the vector Xi
is less than ǫDOS, where ǫDOS is a small positive number,
then the node declar es a c ut has taken plac e: d ← 1.
DOSi
If the normalized state is ∞, meaning no steady state
was s een until k, t hen d ( k) is set t o 0 if t he st at e is
DOSi
positive (i.e., xi (k) > ǫzero) and 1 otherwise.
2.3.2 CCOS detection:
The algorithm for detecting CCOS events relies on find-ing a short path around a hole, if it exists, and is partially inspired by the jamming detection algorithm proposed in [6]. The method utilizes node states to assign the task of hole-detection to the most appropriate nodes. When a node detects a large change in its local state as well as failure of one or more of its neighbors, and both of these events occur within a (predetermined) small time inter-val, the node initiates a PROBE message. The pseudo-code for the algorithm that decides when to initiate a probe is included in Section 2 of the Supplementary Material.
Each PROBE message p contains the following
infor-mation: (i) a unique probe ID, (ii) probe centroid Cp (see
Algorithm PROBE INITIATION in the Supplementary Material), (iii) destination node, (iv) path traversed (in chronological order), and (v) the angle traversed by the probe around the centroid. The probe is forwarded in a manner such that if the probe is triggered by the creation
of a small hole or cut (with circumference less than ℓmax),
the probe traverses a path around the hole in a counter-clockwise (CCW) direction and reaches the node that initiated the probe. In that case, the net angle traversed
by the probe is 3600. On the other hand, if the probe was
initiated by the occurrence of a boundary cut, even if the probe eventually reaches its node of initiation, the net angle traversed by the probe is 0. Nodes forward a probe only if the distance traveled by the probe (the
number of hops) is smaller than a threshold value ℓmax.
Therefore if a probe is initiated due to a large internal cut/hole, then it will be absorbed by a node (i.e., not forwarded because it exceeded the distance threshold constraint), and the absorbing node declares that a CCOS event has taken place. Details on when the source node is alerted about the occurrence of a cut in the network is included in the Supplementary Material.
The information required to compute and update these probe variables necessitates the following assumption for CCOS detection:
Assumption 1: i) The sensor network is a
two-dimensional geometric graph, with Pi∈ R2 denoting the
location of the i-th node in a common Cartesian reference frame; ii) Each node knows its own location as well as the locations of its neighbors.
The location information needed by the nodes need not be precise, since it is only used to compute destina-tions of probe messages. The assumption of the network being 2D is needed to be able to define CW or CCW direction unambiguously, which is used in forwarding probes. At the beginning of an iteration, every node starts with a list of probes to process. The list of probes is the union of the probes it received from its neighbors and the probe it decided to initiate, if any. The manner in which the information in each of the probes in its list is updated by a node is described in Section 2 of the Supplementary Material.
2.4 Performance analysis
The evolution of the node states with and without the occurrence of cuts in the general asynchronous and time-varying setting is stated in the next theorem. In the
statement of Theorem 1 and Assumption 2, ki is the
local iteration counter at node i, and k is a global time counter. The global counter is used solely for the ease of exposition; a node does not need to have access to it. The following assumptions are used:
Assumption 2: i) Communication between nodes is symmetric; ii) If a node fails permanently, each of its neighbors can detect its failure within a fixed time period; iii) The source node never fails; iv) Every node takes part in the communication and state update
in-finitely often, i.e., as k1 → ∞, ki → ∞ for ∀i.
Theorem 1: Let the nodes of a sensor network G(k) execute the state update law in an asynchronous manner, subject to Assumption 2.
1) Let G1(k) = (V1(k), E1 (k)) be the component of G(k) that contains the source node. If there exists
k0 such that G1 (k) = G1 (k0) for all k ≥ k0, then for every node i ∈ V1(k) the state xi (k) converges
to a positive number as k → ∞ that is equal
to the potential of the node i in the electrical
network (G1elec(k0 ), 1) with s Ampere flowing from the source
c e-ISSN: 2348-6848, p- ISSN: 2348-795X Volume 2, Issue 12, December 2015
International Journal of Research (IJR)
Available at http://internationaljournalofresearch.orgAvailable online:http://internationaljournalofresearch.org/ P a g e | 443
2) Let ¯ k be a component of k that does not
G( ) G( )
contain the source node for all k ≥ k0 for some positive integer k0. Then, for every initial condition
X(k0) := [x1(k0), . . . , xn(k0)]T, the state of every
¯
node in G(k) converges to 0 as k → ∞.
The proof of this result is presented in Section 4 of the Supplementary Material. It is important to notice
that ¯ k is allowed to change with time in the second
G( )
statement of the theorem; the only requirement is that the source node never be a part of it. Therefore, even if the graph keeps changing with time, e.g., due to node mobility, the states of the nodes that are disconnected from the source will converge to 0.
The DOS detection part of the proposed algorithm comes with a guarantee on the maximum delay incurred, which is stated in the following Lemma. The proof is provided in Section 4 of the Supplementary Material.
Lemma 1: Let the nodes ofG(k)execute the DCD algo-rithm in a synchronous manner starting from k = 0, with s
≫ ǫzero and ǫzero chosen such that ǫzero < 12 Vmin, where Vmin is the minimum node potential in the fictitious electrical
network Gelec(0). Let the sequence G(k) be time
invariant at all k except at one specific time instant kfail > 0, at
which time certain nodes fail leading to a
cut in the network.
(1) If kfail > K ( 1s ǫzero) + τguard, where K (·) is defined as:
K (x) := log x , x > 0,
log(1 − 1
)
2+dMAX
where dmax is the maximum node degree of the network
G(0), then f or ever y node i , we have d ( k) = 0 f or all
DOSi
k ∈ [k0 kfail] where k0 is some integer that is less than
kfail.
(2) If kfail > K ( 1s ǫzeroǫ x), then for each node i that is
disconnected from the source after the cut, DOSi(k) = 1
for all k that satisfies k − kfail > K ( 1ǫzeroǫDOS).
s that the nodes
The first statement of the Lemma means d
correctly determine that they are connected to the source at some time after deployment before the cut occurs. The second statement means that after some time after the cut, the nodes that are disconnected correctly determine the disconnection.
Lemma 1 follows from a number of technical results, which are stated and proved in the Supplementary Ma-terial. The key result among them is that the convergence rate of the state update law (1) does not depend on the size or topology of the network (see Proposition 1 in the Supplementary Material). The reason for this surprising attribute of the state update law is the following. Al-though communication takes place only among nearby neighbors in the physical network, every node can be thought of as communicating directly with the grounded node at every
iteration in the fictitious electrical network. This is due to the +1 in the denominator in the update law (1), which averages the state of the grounded node (always 0) along with that of all other neighbors. Every node is one hop away from the grounded node in the fictitious electrical network, irrespective of the size and structure of the sensor network G. As a result, the time it takes for each node’s state to get arbitrarily close to its limiting value, is independent of the network’s size and structure. This property makes the DCD algorithm scalable to large networks.
3
P
ERFORMANCEE
VALUATIONPerformance of the DCD algorithm was tested using MATLAB simulations (conducted in a synchronous man-ner) and then on a real WSN system consisting of micaZ motes [7]. Two important metrics of performance for the DCD algorithm are (1) detection accuracy, and (2) detection delay. Detection accuracy refers to the ability to detect a cut when it occurs and not declaring a cut when none has occurred. DOS detection delay for a node i that has undergone a DOS event is the minimum number of iterations (after the node has been disconnected) it takes
befor e t he node s witc hes its d flag from 0 to 1. CCO S
DOSi
detection delay is the minimum number of iterations it takes after the occurrence of a cut before a node detects it. A third metric, communication overhead, is discussed in the Supplementary Material.
In detecting DOS (disconnection from source) events,
two kinds of inaccuracies are possible. A DOS0/1 error
is said to occur if a node concludes it is connected to the source while it is in fact disconnected, i.e., node i
decl ares d t o be 0 whil e it shoul d be 1. A DO S1/ 0 error
DOSi
is said to occur if a node concludes that is disconnected from the source while in fact it is connected. In CCOS detection, again two kinds of inaccuracies are possible. A CCOS0/1 error is said to occur when cut (or a large hole) has occurred but not a single node is able to detect it. A CCOS1/0 error is said to occur when a node concludesthat there has been a cut (or large hole) at a particular location while no cut has taken place near that location.
c e-ISSN: 2348-6848, p- ISSN: 2348-795X Volume 2, Issue 12, December 2015
International Journal of Research (IJR)
Available at http://internationaljournalofresearch.orgevents (cuts or large holes) that are not detected by any nodes to the total number of such events in the network. The probability of CCOS1/0 error is the ratio between the number of nodes who declare that a CCOS event has taken place erroneously (i.e., due to absorbing a probe that was triggered by a small hole) to the number of nodes that initiate probe messages. Due to the fundamental difficulty in distinguishing cuts from holes discussed in Section 2.1, it is not considered an error if a node declares that a CCOS event has taken place in response to the creation of a large hole.
3.1 Choice of parameters
The parameters ǫzero, ǫDOS, ǫΔx, τ guard, τ drop, ℓmax and
r ss have to be specified to all the nodes a-priori. The
parameter s has to be specified only to the source node. A detailed discussion on the choice of parameters and their effect on the DCD algorithm’s performance is provided in Section 5 of the Supplementary Material.
The main conclusions are that (i) ǫzero should be chosen
as small as possible and s should be chosen as large as possible to minimize detection error, (ii) a smaller value
of the parameter ǫDOS decreases probability of DOS1/0
error but increases DOS detection delay, and (iii) the rest of the parameters do not seem to have a significant effect on the algorithm’s performance. The values of the parameters used in all the simulations and experimental evaluations reported in this paper are shown in Table 1.
3.2 Evaluation through Simulations
Simulations are conducted on the five networks that are shown in Figure 4(a)-(e).
3.2.1 DOS Detection Performance
In simulations with each of the five networks, the node failures occur at k=100. Performance of the DOS detec-tion part of the algorithm in terms of error probabilities and detection delays are summarized in Table 2. The error probabilities shown are the ones that are empir-ically computed at k=60 and k=160, i.e., 60 iterations after deployment and after the node failures occurred, respectively. The mean and standard deviation of DOS detection delay for a network are computed by averag-ing over the nodes that detected DOS events. We see from Table 2 that the algorithm is able to successfully detect initial connectivity to the source and then DOS events for all the five networks without requiring the parameters to be tuned for each network individually.
3.2.2 CCOS Detection Performance
Recall that the CCOS detection part of the algorithm is not applicable to 3D networks, so it was only tested on networks 4(a)-(d). As a specific example, Figure 5 shows the path of the probes and their originating nodes
in the network of Figure 4(d). Two probes were triggered by nodes close to the cut on the upper right corner, both
TABLE 1
List of parameters that have to be provided to the nodes. The numerical values shown here are used for all simulations and experimental evaluations reported in
this document.
Symbol Name/description Value
s source strength 100
ǫzero value below which the state is con- 10−10 sidered to be 0
ǫDOS value below which the normalized 10−3 state is considered zero
ǫΔx value below which the normalized 10−3 state difference is considered zero
τguard time during which the normalized 3
state difference has to be below ǫΔx
for the state to be considered steady τdrop number of failed consecutive trans- 4
missions before a neighbor is de-clared to have failed.
ℓmax maximum path length for a probe 15 r SS threshold ratio of change in the 0.35
c e-ISSN: 2348-6848, p- ISSN: 2348-795X Volume 2, Issue 12, December 2015
International Journal of Research (IJR)
Available at http://internationaljournalofresearch.orgAvailable online:http://internationaljournalofresearch.org/ P a g e | 445
0.2
0.1
0
−0.1
0.5
0
0.5
0
Fig. 3(a) −0.5 −0.5
Fig. 3(b)
(a) (b) (c) (d) (e)
Fig. 4. Five networks before and after node failures: (a) 25-node 1D line network, (b) 100-node 2D grid, (c) 400-node 2D grid, (d) 200-400-node 2D random network, and (e) 256-400-node 3D grid (8×8×4).
TABLE 2
DOS detection performance for the networks shown in Figure 4. The two values of the probability shown in each cell correspond to k=60 and k=160, respectively.
Network (a) (b) (c) (d) (e)
Prob(DOS0/1 error) 0/0 0/0 0/0 0/0 0/0 Prob(DOS1/0 error) 0/0 0/0 0/0 0/0 0/0 DOS Delay (mean) 20 17 20 35 31 DOS Delay (std. dev.) 4.2 5.4 4.3 3.9 2
TABLE 3
CCOS detection performance for four networks in
Figures 4(a)-(d). The error probabilities are at k=160.
Network (a) (b) (c) (d)
Prob(CCOS1/0 error) 0 0 0 0.33 Prob(CCOS0/1 error) 0 0 0 0
CCOS Delay 33 40 37 40
Fig. 6. Partial view of the 24 node outdoor deployment.
Fig. 5. The path of the probe messages in the network of Figure 4(d). Each probe path is marked with a distinct legend (circle, triangle, square, etc.), and the node that initiated the probe is shown as the one with the larger legend.
of them were absorbed when the length of their path
traversed exceeded ℓmax hops, which led to correctly
detecting CCOS events. Among three probes that were triggered by nodes near small holes in this network, one
of them – near the hole in the upper left corner – failed
to find a path back to its originating node, leading to an erroneous declaration of an CCOS event by the absorbing node. The probability of a CCOS1/0 error in
this case is therefore 0.33.
Table 3 summarizes the performance of the CCOS detection part of algorithm (executed with parameter values shown in Tables 1). The CCOS detection error probabilities are 0 except in case of the network in
Figure 4(d) as described above.
Simulation studies reported in the Supplementary Ma-terial (Section 5) shows that imprecise position informa-tion has little effect on the performance of the CCOS detection part of the algorithm. Analysis of communica-tion cost of the algorithm is also reported in Seccommunica-tion 5 of the Supplementary Material.
3.3 System Implementation and Evaluation
c e-ISSN: 2348-6848, p- ISSN: 2348-795X Volume 2, Issue 12, December 2015
International Journal of Research (IJR)
Available at http://internationaljournalofresearch.orgoutdoors in a grassy field at Texas A&M University for a
total deployment area of approximately 13×5m2. A
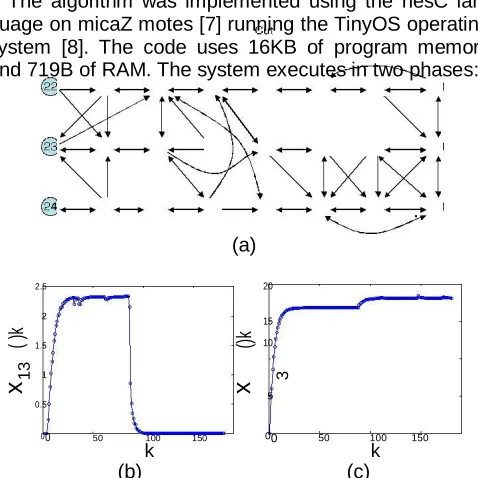
partial view of the outdoor deployment is shown in Figure 6. The network connectivity is depicted in Figure 7(a).
The algorithm was implemented using the nesC lan-guage on micaZ motes [7] running the TinyOS operating system [8]. The code uses 16KB of program memory and 719B of RAM. The system executes in two phases:
(a)
2.5
20
( )k
2
15
()
k
1.5 10
13 1
3
x
x
50.5
00 50 100 150
00 50 100 150
k k
(b) (c)
Fig. 7. (a) The network for the outdoor deployment. (b)-(c) The states of nodes 13 and 3, which are disconnected from and connected to, respectively, the source after the cut has occurred.
the Reliable Neighbor Discovery (RND) phase and the DCD Algorithm phase. In the RND phase each mote broadcasts a beacon within a fixed time interval of 5s for 15 such intervals. Upon receiving a beacon, the mote updates the number of beacons received from that partic-ular sender. To determine whether a communication link is established, each mote first computes for each of its neighbors the Packet Reception Ratio (PRR), defined as the ratio of the number of successfully received beacons and the total number of beacons sent by a neighbor. A neighbor is deemed reliable if the PRR>0.8. Next, the DCD algorithm executes. After receiving state informa-tion from neighbors, a node updates its state according to equation (1) in an asynchronous manner and broadcasts its new state. The state is stored in the 512KB on board flash memory at each iteration (for a total of about 1.6KB for 200 iterations) for post-deployment analysis.
Experimental results for two of the sensor nodes de-ployed are shown in Figure 7. The states of all nodes converged after about 30 iterations. At iteration k=83 a cut is created by turning off motes inside the rectangle
labeled “Cut” in Figure 7(a). The states for this network
approach their new steady state values around iteration k=117. Figures 7(b) and 7(c) show the states for nodes u and v, as depicted in Figure 7(a), which were connected and disconnected, respectively, from the source node after the cut.
c e-ISSN: 2348-6848, p- ISSN: 2348-795X Volume 2, Issue 12, December 2015
International Journal of Research (IJR)
Available at http://internationaljournalofresearch.orgAvailable online:http://internationaljournalofresearch.org/ P a g e | 447
of 4. The DOS detection delays can be substantially
reduced by choosing a larger value for ǫzero. The CCOS
detection part was executed offline, after the state data was collected from the nodes. Node 7 was the only node that initiated a probe, which reached node 7 again by traveling through the edges (7,4), (4,2), (2,7), with a net angle of 0 around the probe centroid. Thus, 7 detected a CCOS event, with its former neighbor 10 as a boundary of the cut (or large hole).
4
C
ONCLUSIONSThe DCD algorithm we propose here enables every node of a wireless sensor network to detect DOS (Discon-nected frOm Source) events if they occur. Second, it enables a subset of nodes that experience CCOS (Con-nected, but Cut Occurred Somewhere) events to detect them and estimate the approximate location of the cut in the form of a list of active nodes that lie at the boundary of the cut/hole. The DOS and CCOS events are defined with respect to a specially designated source node. The algorithm is based on ideas from electrical network theory and parallel iterative solution of linear equations.
Numerical simulations, as well as experimental evalu-ation on a real WSN system consisting of micaZ motes, show that the algorithm works effectively with a large classes of graphs of varying size and structure, without requiring changes in the parameters. For certain scenar-ios, the algorithm is assured to detect connection and disconnection to the source node without error. A key strength of the DCD algorithm is that the convergence rate of the underlying iterative scheme is quite fast and independent of the size and structure of the network, which makes detection using this algorithm quite fast. Application of the DCD algorithm to detect node sepa-ration and reconnection to the source in mobile networks is a topic of ongoing research.
R
EFERENCES[1] G. Dini, M. Pelagatti, and I. M. Savino, “An algorithm for recon-necting wireless sensor network partitions,” in European Conferenceon Wireless Sensor Networks, 2008, pp. 253–267. [2] N. Shrivastava, S. Suri, and C. D. T oth,´ “Detecting cuts in sensor
networks,” ACM Trans. Sen. Netw., vol. 4, no. 2, pp. 1–25, 2008. [3] H. Ritter, R. Winter, and J. Schiller, “A partition detection system
for mobile ad-hoc networks,” in First Annual IEEE Communications Society Conference on Sensor and Ad Hoc Communications and Net-works (IEEE SECON 2004), Oct. 2004, pp. 489–497.
[4] M. Hauspie, J. Carle, and D. Simplot, “Partition detection in mobile ad-hoc networks,” in 2nd Mediterranean Workshop on Ad-Hoc Networks, 2003, pp. 25–27.
[5] P. Barooah, “Distributed cut detection in sensor networks,” in 47th IEEE Conference on Decision and Control, December 2008, pp. 1097 – 1102.
[6] A. D. Wood, J. A. Stankovic, and S. H. Son, “Jam: A jammed-area mapping service for sensor networks,” in IEEE Real Time System Symposium, 2003.
[7] http://www.xbow.com/Products/Product pdf files/Wireless pdf/ MICAZ Datasheet.pdf.
[8] J. Hill, R. Szewczyk, A. Woo, S. Hollar, D. Culler, and K. Pis-ter, “System architecture directions for networked sensors,” in
c e-ISSN: 2348-6848, p- ISSN: 2348-795X Volume 2, Issue 12, December 2015
International Journal of Research (IJR)
Available at http://internationaljournalofresearch.orgPrabir Barooah Dr. Prabir Barooah is currently an assistant professor in the Department of Me-chanical and Aerospace Engineering at Univer-sity of Florida. Dr. Barooah was born in Jorhat, Assam, India. He received the Ph.D. degree in Electrical and Computer Engineering in 2007 from the University of California, Santa Barbara. From 1999 to 2002 he was a research engineer at United Technologies Research Center, East Hartford, CT. He received the M. S. degree in Mechanical Engineering from the University of
Delaware in 1999 and the B.Tech degree in Mechanical Engineering from the Indian Institute of Technology, Kanpur, in 1996. Dr. Barooah is the winner of the NSF CAREER award (2010), General Chairs' Recognition Award for Interactive papers at the 48th IEEE Conference on Decision and Control (2009), Best Paper Award at the 2nd Int. Conf. on Intelligent Sensing and Information Processing (2005), and NASA group achievement award (2003). He serves on the editorial board of International Journal of Distributed Sensor Networks.
Radu Stoleru Dr. Radu Stoleru is currently an
assistant professor in the Department of Com-puter Science and Engineering at Texas A&M University. He received his Ph.D. in computer science from the University of Virginia in 2007, under Professor John A. Stankovic. While at the University of Virginia, Dr. Stoleru received from the Department of Computer Science the Outstanding Graduate Student Research Award for 2007. Dr. Stoleru's research interests are in deeply embedded wireless sensor systems,
distributed systems, embedded computing, and computer networking. He has authored or co-authored over 50 conference and journal papers with over 1,000 citations. He is currently serving as an editorial board member for 3 international journal and has served as technical program committee member on numerous international conferences. Dr. Stoleru is a member of IEEE and ACM.
Harsha Chenji Harsha Chenji joined the
De-partment of Computer Science and Engineering at Texas A&M University in August 2007. He is currently a Ph.D. candidate in the Embedded & Networked Sensor Systems (LENSS) Labo-ratory under the guidance of Dr. Radu Stoleru, after graduating with a M.S. (Computer Engi-neering) degree in Dec 2009. He obtained his Bachelor of Technology in Electrical and Elec-tronics Engineering from the National Institute of Technology Karnataka, Surathkal, India in May 2007.
Tamas´ Kalmar´-Nagy Dr. Tamas´ Kalmar´-Nagy