Scholarship@Western
Scholarship@Western
Electronic Thesis and Dissertation Repository
January 2013
Concrete Bridge Girders with Exposed Flexural Reinforcement
Concrete Bridge Girders with Exposed Flexural Reinforcement
Trevor K. Scott
The University of Western Ontario
Supervisor
Prof. F. M. Bartlett
The University of Western Ontario
Graduate Program in Civil and Environmental Engineering
A thesis submitted in partial fulfillment of the requirements for the degree in Master of Engineering Science
© Trevor K. Scott 2013
Follow this and additional works at: https://ir.lib.uwo.ca/etd Part of the Structural Engineering Commons
Recommended Citation Recommended Citation
Scott, Trevor K., "Concrete Bridge Girders with Exposed Flexural Reinforcement" (2013). Electronic Thesis and Dissertation Repository. 1090.
https://ir.lib.uwo.ca/etd/1090
This Dissertation/Thesis is brought to you for free and open access by Scholarship@Western. It has been accepted for inclusion in Electronic Thesis and Dissertation Repository by an authorized administrator of
CONCRETE BRIDGE GIRDERS WITH EXPOSED FLEXURAL
REINFORCEMENT
(Thesis format: Monograph)
by
Trevor K. Scott
Graduate Program in
Civil and Environmental Engineering
A thesis submitted in partial fulfillment of the requirements for the degree of
Master of Engineering Science
The School of Graduate and Postdoctoral Studies The University of Western Ontario
London, Ontario, Canada January 2013
ii
THE UNIVERSITY OF WESTERN ONTARIO
SCHOOL OF GRADUATE AND POSTDOCTORAL STUDIES
CERTIFICATE OF EXAMINATION
Supervisor
______________________________ Dr. F.M. Bartlett
Examiners
______________________________ Dr. M. A. Youssef
______________________________ Dr. W. Zhou
______________________________ Dr. S. Salisbury
The thesis by
Trevor K.
Scott
entitled:
Concrete Bridge Girders with Exposed Flexural Reinforcement
is accepted in partial fulfillment of the requirements for the degree of Master of Engineering Science
iii
ABSTRACT
Reinforced concrete highway bridge girders are regularly repaired by replacing
deteriorated concrete with new concrete, temporarily exposing the flexural reinforcement.
The absence of bond between the concrete and steel at this stage makes it difficult to
compute the flexural capacity and the current code criteria provide no guidance to assist
practitioners.
The research reported in this thesis rectifies this knowledge gap. A thorough examination
is presented of experimental and analytical investigations by others to determine the
typical behaviour, including probable failure modes, of reinforced concrete specimens
with exposed flexural reinforcement. Based on these findings, two analytical approaches
are developed to predict the longest length of flexural reinforcement that could be
exposed that ensures a girder will still exhibit a ductile failure with no reduction in yield
capacity. The Strain Compatibility Analysis derived by Harris was enhanced to involve
realistic concrete stress-strain relationships and was validated experimentally using five
4-metre T-section specimens subjected to simultaneous point and uniformly distributed
loading. A Strut-and Tie Analysis was also derived for this generic loading condition that
could only be indirectly validated experimentally. The ratios of the test failure load to the
failure load predicted using the Strain Compatibility Analysis had a mean value of 1.00
and a standard deviation of 0.068.
Keywords: Bridges; Girder; Exposed Reinforcement; Assessment/Repair; Rehabilitation;
iv
For my Grandma.
v
ACKNOWLEDGEMENTS
First and foremost, I want to offer my deepest thanks to my supervisor, Dr. Mike Bartlett.
His help, guidance, and invaluable knowledge have been instrumental in completing my
thesis. Dr. Bartlett has been a remarkable mentor and it has been a privilege to have met
and worked with him over the past three years.
Thank you to Mr. Wilbert Logan for all his insight and assistance throughout the
experimental testing in the UWO Structures Laboratory.
Thank you to all my fellow colleagues who I have shared these past three years with.
This journey has been an amazing experience and I am glad to have met and formed such
great friendships.
I gratefully acknowledge financial support from the Natural Sciences and Engineering
Research Council (NSERC), in the form of a CGS-M Grant and a Discovery Grant and
from the Faculty of Engineering at the University of Western Ontario.
A special thank you to my mother, father, and brother, for always being there and
supporting me throughout my whole life and helping me become the person I am today.
vi
TABLE OF CONTENT
PAGE
Certificate of Examination ... ii
Abstract ... iii
Acknowledgements ...v
Table of Content ... vi
List of Figures ... viii
List of Tables ... xi
List of Appendices ... xii
Nomenclature ... xiv
Chapter 1: Introduction ...1
1.1 Background ...1
1.1.1Chloride Intrusion ...2
1.1.2 Carbonation ...2
1.2 Bridge Rehabilitation Techniques ...3
1.3 Evaluation of Bridge Girders During Rehabilitation ...5
1.4 Objectives ...6
1.5 Outline of Thesis ...6
Chapter 2: Review of Literature ...8
2.1 Introduction ...8
2.2 Scope of Experimental Investigations ...8
2.3 Findings of Previous Experimental Investigations ...14
2.3.1 Observed Failure Modes ...14
2.3.2 Flexural Capacity ...15
2.3.3Cracking Patterns ...17
2.3.4 Effective Depth of the Flexural Reinforcement ...22
2.4 Analytical Model for Girders with Exposed Flexural Reinforcement ...22
2.5 Influence of the Important Parameters ...31
2.5.1 Configuration 2 ...32
2.5.2 Configurations 3 and 4 ...36
2.5.3Configuration 5 ...37
2.5.4Configurations 6 and 7 ...38
2.6 Summary and Conclusions ...40
Chapter 3: Analysis of Girders with Exposed Flexural Reinforcement ...43
3.1 Introduction ...43
3.2 Typical T-section ...44
3.3 Strain Compatibility Analysis ...45
3.3.1 Methodology ...46
3.4 Strut-and-Tie Analysis ...57
vii
3.4.2Case 1: Point Load (ω = 0) ...61
3.4.3Case 2: Uniformly Distributed Load (ω≠ 0, P = 0) ...64
3.4.4Case 3: Both Point and Uniformly Distributed Loads (ω ≠ 0, P ≠ 0) ...66
3.4.5Comparisons ...71
3.5 Summary and Conclusions ...72
Chapter 4: Experimental Investigation ...74
4.1 Introduction ...74
4.2 Objectives ...74
4.3 Control Specimen ...75
4.4 Testing Apparatus ...78
4.5 Specimens with Exposed Flexural Reinforcement ...85
4.6 Testing Procedure ...90
4.7 Results ...93
4.7.1 Control Specimen ...93
4.7.2 Specimens with Exposed Flexural Reinforcement ...97
4.7.3Effectiveness of Testing Apparatus ...99
4.7.4 Impact of Steel Spacers ...99
4.7.5 Effect of Unsymmetrical Loading Configurations ...102
4.8 Summary and Conclusions ...105
Chapter 5: Comparison of Experimental and Predicted Results ...108
5.1 Introduction ...108
5.2 Comparison to Strain Compatibility Analysis Predictions ...108
5.2.1 Ultimate Flexural Capacity ...109
5.2.2 Neutral Axis Depth ...111
5.2.3Reinforcement Strain at Failure ...111
5.3 Comparison to Strut-and-Tie Analysis Predictions ...113
5.3.1 Orientation of Principal Compressive Strains ...115
5.4 Summary and Conclusions ...117
Chapter 6: Summary, Conclusions and Recommendations for Future Research 119 6.1 Summary ...119
6.2 Conclusions ...122
6.3 Recommendations for Future Research ...124
References ...126
Appendice ...129
viii
LIST OF FIGURES
PAGE
Figure 1-1: Typical Deteriorated Reinforced Concrete Bridge Girders. ...1
Figure 1-2: Patch Repair Process: (a) Removal of Contaminated Concrete (b)
Concrete Replacement (MTO 2010). ...4
Figure 1-3: Compatible Strain Requirement: (a) Satisfied for Bonded Flexural Reinforcement, (b) Not Satisfied when Flexural Reinforcement is
Exposed. ...5
Figure 2-1: Elevation of Specimen with Exposed Flexural Reinforcement with Important Parameter Identified. ...11
Figure 2-2: Failure Modes Observed in the Previous Experimental Investigations. .15
Figure 2-3: Change in Longitudinal Strains in Concrete Section on Exposure of Flexural Reinforcement (Redrawn from Cairns and Zhao 1993). ...16
Figure 2-4: Contrast in Crack Patterns between: (a) Control Specimen and (b) Specimen with Exposed Flexural Reinforcement (Cairns and Zhao 1993). ...18
Figure 2-5: Crack Patterns of Specimens Designed to Exhibit a Shear Failure: (a) Control, (b) and (c) Specimens with Exposed Flexural Reinforcement (Cairns 1995). ...20
Figure 2-6: Loading and Cracking Patterns for (a) Specimen Configuration 3, and (b) Specimen Configuration 4 (Raoof and Lin 1997). ...21
Figure 2-7: Crack Patterns Observed with: (a) Loss of Cover Only, and (b) Loss of Cover and Flexural Bond (Minkarah and Ringo 1982). ...21
Figure 2-8: Location of the Neutral Axis Depth, c, for a Girder with no Flexural Reinforcement Exposed (Redrawn from Cairns and Zhao 1993). ...25
Figure 2-9: Location of the Neutral Axis Depth, c, for a Girder with Exposed
Flexural Reinforcement (Redrawn from Cairns and Zhao 1993). ...25
Figure 2-10: Location of the Neutral Axis Depth, c, for a Girder with Exposed Flexural Reinforcement to Maintain Compatibility, Eqn. [2.4]
(Redrawn from Cairns and Zhao 1993). ...26
Figure 2-11: Neutral Axis Depth, c, Variation Along Length of Test Specimen with Exposed Flexural Reinforcement (Bartlett 1998). ...26
Figure 2-12: Loading and Variation of the Neutral Axis Depth for Specimens: (a) Configuration 3 and, (a) Configuration 4 (Redrawn from Raoof and Lin 1997). ...27
Figure 2-13: Beam Action with Constant Lever Arm if Flexural Reinforcement is Fully Bonded. ...28
Figure 2-14: Arching Action with Varying Lever Arm if Flexural Reinforcement is Exposed. ...29
ix
Figure 2-16: Variation in Extreme Compressive Strain in Concrete with Length of Exposed Flexural Reinforcement at a Given Applied Moment for
Different Load Spacings (Redrawn from Cairns and Zhao 1993). ...35
Figure 2-17: Influence of Span/Depth Ratio on Behaviour using the Numerical Model (Redrawn from Cairns and Zhao 1993). ...36
Figure 2-18: Variation of the Reduction in Capacity with Changes in the Distance from the Left Support to the Left Two Point Load (Raoof and
Lin 1997). ...37
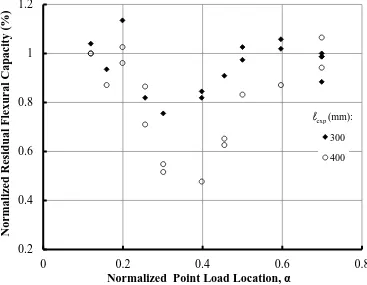
Figure 2-19: Variation of the Reduction in Capacity with Changes in the Position of the Single-point Load: Small-scale Specimens, L = 1760 mm
(Redrawn from Raoof and Lin 1997)...39
Figure 3-1: Typical T-section Cross-section. ...45
Figure 3-2: Flow Chart Depicting the Incremental Procedure of the Strain
Compatibility Analysis (SCA). ...47
Figure 3-3: Neutral Axis Depth, Strain Distribution, Stress Distribution and Internal Forces for both the Positive (+ve) and Negative (-ve)
Curvatures. ...50
Figure 3-4: Todeschini’s Compressive Stress-strain Relationship for a Concrete Strength, fc', of 40 MPa. ...53
Figure 3-5: Revised Neutral Axis Depth, Strain Distribution, Stress Distribution and Internal Forces for Cases 1 and 6. ...54
Figure 3-6: Basic Geometry of the Left Compressive Strut. ...59
Figure 3-7: Loading for Case 1 (α = 0.375 shown). ...62
Figure 3-8: Effect of the Location of the Point Load on the Critical Distance to the End of the Exposed Length, e, at Yield. ...63
Figure 3-9: Loading for Case 2. ...64
Figure 3-10: Load Case 2: (a) Shear Force Diagram, (b) Bending Moment
Diagram...65
Figure 3-11: Loading for Case 3 (α = 0.25 Shown). ...67
Figure 3-12: Effect of the Location of the Point Load on the Critical Distance to the End of the Exposed Length, eL, for Different Values of K at Yield. ...70
Figure 3-13: Effect of the Location of the Point Load on the Critical Distance to the End of the Exposed Length, eL, at Yield for Load Cases 1, 2 and 3. ...71
Figure 4-1: Control Specimen with Reinforcement Details: (a) Plan (Note: Web Reinforcement not Shown for Clarity), (b) Elevation, (c) Cross-section and (d) 180⁰ Standard Hook Detail for Flexural Reinforcement (All Dimensions in mm). ...76
Figure 4-2: Control Specimen: (a) Reinforcement and Formwork (b) Casting. ...78
x
Figure 4-4: End Joint to Accommodate Rotation: (a) Unassembled, and
(b) Installed. ...83
Figure 4-5: Flange Void Forms (a) 75 mm PVC Piping, (b) Bolt and Wing Nut Underneath Formwork. ...84
Figure 4-6: Elevations of Test Specimens with Loading Configuration, Void
Location and Steel Spacer Locations. ...86
Figure 4-7: Steel Spacer: (a) Illustration of the Load Transfer through the Steel Spacer and (b) Steel Spacer In-situ. ...88
Figure 4-8: Strain Gauges used in the Experimental Investigation: (a) Small 45 Degree Rosette Strain Gauges, (b) Constructed 45 Degree Rosette Strain Gauge, (c) Strain Gauge on Concrete Flange, and (d) Strain Gauges on Flexural Reinforcement and Stirrups. ...89
Figure 4-9: Foam Insulation Void Enclosing the Flexural Reinforcement. ...90
Figure 4-10: Designed Testing Procedure for Specimens. ...91
Figure 4-11: Elevations of Specimens with Crack Locations and Deflected Shapes. .94
Figure 4-12: Moment-deflection Relationships: (a) Control Specimen and Specimen 1; (b) Specimen 2 and 3; and, (c) Specimens 4 and 5. ...95
Figure 4-13: Testing Apparatus: Partial Elevations Showing Unloaded (Left) and Loaded (Right) for Control Specimen, (a) Predicted and,
(b) Observed...100
Figure 4-14: Impact of Steel Spacer under the Interior Load ω Near the Left
Support: (a) Specimen 2 and, (b) Specimen 3. ...102
Figure 4-15: Orientation of the Principal Compressive Strains at the End of the Exposed Length for Specimen 1 (Symmetrical Loading
Configuration). ...103
Figure 4-16: Orientation of the Principal Compressive Strains at the End of the Exposed Length for Specimen 2 (Unsymmetrical Loading
Configuration). ...104
Figure 4-17: Orientation of the Principal Compressive Strains at the End of the Exposed Length for Specimen 3 (Unsymmetrical Loading
Configuration). ...104
Figure 5-1: Variation of the SCA-predicted Neutral Axis Depth and
Compressive Force Centroid at Failure and Observed Cracking
Patterns. ...112
Figure 5-2: Orientation of the Predicted and Observed Principal
Compressive Strains at the Supports of Specimen 3: (a) Left,
xi
LIST OF TABLES
PAGE
Table 2-1: Test Specimens and Loading Configurations Studied by Others. ...9
Table 2-2: Parameters Investigated in Current Literature. ...12
Table 2-3: Details of Specimens with Exposed Flexural Reinforcement. ...13
Table 3-1: Summary of the Magnitude and Location of the Concrete Compressive Force for each Case (Compression Zone Shaded). ...51
Table 3-2: Summary of Critical Values for Load Case 3. ...69
Table 4-1: Whiffle Tree System Components. ...82
Table 4-2: Properties of Specimens with Exposed Flexural Reinforcement ...85
Table 4-3: Testing Loads for each Specimen. ...92
Table 4-4: Predicted and Observed Test Results. ...96
Table 5-1: Predicted Strain Compatibility Analysis and Test Results. ...110
xii
LIST OF APPENDICES
PAGE
Appendix A: Literature Review Details ...129
A.1: Introduction ...130
A.2: Minkarah and Ringo (1982) ...130
A.3: Nokhasteh, Eyre and McLeish (1992) ...131
A.4: Cairns and Zhao (1993) ...132
A.5: Raoof and Lin (1993, 1995, 1997) ...136
A.6: Nemec (1996)...138
A.7: Xoing, Liu and Xie (2000) ...138
A.8: Sharaf and Soudki (2002) ...140
Figure A-1: Details of: (a) Control Specimen (b) Test Specimen with Loss of Only Cover (c) Test Specimen with Loss of Cover and Flexural Bond (Minkarah and Ringo 1982). ...131
Figure A-2: Dimensions for a Typical Specimen with Exposed Flexural Reinforcement (Nokhasteh, Eyre and McLeish 1992). ...132
Figure A-3: Details of Test Specimens, all Dimensions in mm (Cairns and Zhao 1993). ...133
Figure A-4: Loading Configuration for the First Part of Study (Cairns and Zhao 1993). ...134
Figure A-5: Details of Test Series Specimens A, B, and C (Cairns 1995). ...135
Figure A-6: Details of Small-scale Test Specimens with Width = 75 mm (Raoof and Lin 1997). ...137
Figure A-7: Details of Large-scale Test Specimens (Raoof and Lin 1997). ...137
Figure A-8: Details of Test Specimens and Loading Configuration (Bartlett 1998). ...138
Figure A-9: Details of Short-term Test Specimens (Xiong, Liu and Xie 2000). ...139
Figure A-10: Details of Long-term Test Specimens (Xiong, Liu and Xie 2000). ...139
Figure A-11: Details of Test Specimens (Sharaf and Soudki 2002). ...140
Appendix B: Analysis of Specimens with Exposed Flexural Reinforcement ...141
B.1: Introduction ...142
B.2: Strain Compatibility Analysis (SCA) Derivation ...143
B.3: Strut-and-Tie Analysis (STA) Derivation ...157
Appendix C: Experimental Investigation ...166
xiii
C.2: Dead-to-live Load Moment Ratio for a Typical Reinforced Concrete
Bridge ...173
C.3: Design, Construction and Installation of Foam Void ...177
C.4: Testing Procedure ...182
C.5: Loading Histories of Specimens ...187
C.6: Cracking Moment, Mcr ...190
Figure C-1: Tensile Test for Bar Samples 1 and 2. ...169
Figure C-2: Stress-strain Approximations for Test Bar Samples 1 and 2. ...172
Figure C-3: Cedar Creek Road Underpass Bridge (MTO 2010). ...173
Figure C-4: Elevation of Cedar Creek Road Underpass (Dillon Consulting 2001). 174 Figure C-5: Typical Cross-section of Cedar Creek Road Underpass (Dillon Consulting 2001). ...174
Figure C-6: The Ratio of Dead Load Moment, MD, to Total Load Moment, MT, over the Positive Moment Region of the Cedar Creek Road Underpass Bridge. ...176
Figure C-7: Foam Insulation Void: (a) Plan of Individual Layers, (b) Section A-A at Stirrups, and (c) Section B-B between Stirrups (All Dimensions in mm). ...178
Figure C-8: Foam Insulation Void: (a) Layer 1, (b) Layer 2, (c) Layer 3 and (d) Layer 4. ...179
Figure C-9: Foam Insulation Void Placement: (a) Stirrups and Flexural Reinforcement Placement, (b) Layer 3 Placement, (c) Layer 4 Placement, (d) Beveled Edge of Layer 4. ...181
Figure C-10: Loading History for Control Specimen. ...188
Figure C-11: Loading History for Specimen 1. ...188
Figure C-12: Loading History for Specimen 2. ...188
Figure C-13: Loading History for Specimen 3. ...189
Figure C-14: Loading History for Specimen 4. ...189
Figure C-15: Loading History for Specimen 5. ...189
Appendix D: Comparison of Experimental and Predicted Results...193
D.1: Introduction ...194
D.2: Strain Compatibility Analysis Results for Specimen 1...194
D.3: Orientation of Principal Compressive Strains...206
Figure D-1: Loading Configuration for Specimen 1 (All Dimension in mm). ...195
Figure D-2: Orientation of the Predicted and Observed Principal Compressive Strains at the Supports of Specimen 1: (a) Left, (b) Right. ...207
Figure D-3: Orientation of the Predicted and Observed Principal Compressive Strains at the Supports of Specimen 2: (a) Left, (b) Right. ...208
xiv
NOMENCLATURE
Ab area of test bar sample in a reinforcement tensile test As area of tensile flexural reinforcement
As' area of top (flexural compression) reinforcement b width of concrete compression zone
bf overall flange width bw web width
C resultant compressive force / force in compressive strut
C(x) resultant compressive force in the concrete at centre of segment at x CL force in the left compressive strut
c neutral axis depth measured from the extreme compression fibre c(x) neutral axis depth at centre of segment
d effective depth of flexural tensile reinforcement
d' effective depth of top (flexural compression) reinforcement dc depth of concrete removed
Ec elastic modulus of concrete Es elastic modulus of steel
fc concrete compressive stress at extreme fibre fc' compressive strength of concrete
fc'' maximum compressive stress in Todeschini’s stress-strain relationship fc(x) stress in the extreme compression fibre at centre of segment at x fcr cracking strength of concrete
fcu limiting compressive stress in either the node or compressive strut fs tensile stress in flexural reinforcement
fy yield strength of steel fu ultimate strength of steel
H horizontal force component of the compressive strut h overall height
ha height of node at support
hamax maximum height of node at support hf flange thickness
hs depth of the top compressive strut or node at the location of the maximum moment
hw reduced web height where concrete is removed i iteration number
jd lever arm between the internal tensile and compressive force resultants jd(x) lever arm at the centre of segment at x
jdmax lever arm at the location of the maximum moment, Mmax K ratio of point load to total distributed load (K = P/ωL, K ≥ 0)
k1(x) average stress of the resultant compressive force coefficient at centre of segment at x
k2(x) line of action of the resultant compressive force coefficient, measured from the extreme compression fibre, at centre of segment at x
xv LT total length of specimen
L* gauge length of test bar samples
b
length of bearing at support
c
critical length of exposed flexural reinforcement
e
critical distance from support to end of exposed length
e L
critical distance from left support to end of exposed length
end
distance from support to end of exposed length
e R
critical distance from right support to end of exposed length
exp
length of exposed flexural reinforcement M applied bending moment
M(x) bending moment at centre of segment at x MD dead load moment
MG fraction of total live load moment applied to one girder ML live load moment
MP moment due to the point load
MSCA predicted ultimate moment using the Strain Compatibility Analysis (SCA) MSTA predicted ultimate moment using the Strut-and-Tie Analysis (STA)
MT total moment Mcr cracking moment
Mmax maximum applied moment My yield moment
Mu ultimate moment
Mω moment due to the simulated distributed load N number of specimens tested
n number of segments / modular ratio (Es/Ec) P point load
Py anticipated point load causing yield of flexural reinforcement Pb tensile load in test bar sample
Pby yield tensile load in test bar sample Pbu ultimate tensile load in test bar sample RL reaction at left support
RR reaction at right support
S spacing between two-point loads T tensile force in flexural reinforcement Ts tensile force in exposed stirrups V applied shear
VG fraction of total live load shear applied to one girder VT total live load shear
w width of compressive strut
x distance along the longitudinal axis of a girder from support to centre of segment
y(x) depth of the centroid of the resultant compressive force from the neutral axis at centre of segment at x
xvi
Greek Symbols
α normalized point load location from left support
α1 ratio of the average stress in a rectangular compression block to the specified concrete compressive strength
γc mass density of concrete (assumed 2300 kg/m3)
Δ displacement reading in a reinforcement tensile test Δb elongation of test bar sample
Δby elongation of test bar sample at yield
Δcs elongation of the concrete at the depth of the flexural reinforcement
Δm displacement of Tinius-Olsen Machine
Δmid midspan deflection of specimen
Δmy displacement attributed to the Tinius-Olsen Machine at yield of test bar sample
Δs elongation of exposed flexural reinforcement
ΔT change of tensile force in the flexural reinforcement Δx segment length
Δy observed displacement reading at yield in a reinforcement tensile test
εc compressive strain in concrete at extreme fibre
εcs extrapolated strain in the concrete at the depth of the exposed flexural reinforcement
εcu maximum compressive strain at extreme fibre
εc' strain corresponding to the maximum compressive stress in Todeschini’s concrete stress-strain relationship
εc(x) compressive strain in concrete at extreme fibre at centre of segment at x
εs tensile strain in the exposed flexural reinforcement
εy yield strain of steel
θL orientation of the principal compressive strains in the concrete web at the left support
θR orientation of the principal compressive strains in the concrete web at the right support
θSTA predicted orientation of the principal compressive strains / strut in the concrete web at the support using the Strut-and-tie Analysis (STA) θs inclination of compressive strut at support
θsL inclination of the compressive strut at the left support
θsR inclination of the compressive strut at the right support
ρ flexural reinforcement ratio
ω simulated uniformly distributed point load ωDL specified uniformly distributed dead load
ωapp simulated distributed point load due to the weight of the testing apparatus
ωow simulated distributed point load due to the self- weight of the specimen
ωs mechanical flexural reinforcement ratio
CHAPTER 1:
1.1
INTRODUCTION
Reinforced concrete highway bridge girders are susceptible to deterioration caused
primarily by corrosion of the reinforcing steel, as shown in
BACKGROUND
Figure 1-1. Concrete is
alkaline in nature and, when placed, generally has a pH value between 12 and 13
(Bertolini et al. 2004, Nehdi 2011, Minkarah and Ringo 1982). If the concrete is
uncracked, a passive oxide film forms around the reinforcement that prevents the
intrusion of moisture and oxygen (Bertolini et al. 2004, Nehdi 2011, Minkarah and Ringo
1982). In this condition, the reinforcement is stable in a high pH solution that prevents
the initiation of corrosion.
Figure 1-1: Typical Deteriorated Reinforced Concrete Bridge Girders.
The passive oxide film that forms around the reinforcement can begin to deteriorate
as the process of depassivation. Once the oxide film has completely deteriorated, the
corrosion of the reinforcement is initiated. The volume of rust created can be six times
that of the original steel (Nehdi 2011) and so can cause the concrete cover to crack,
delaminate, and spall. The cracks are highlighted by brown rust stains, reflecting the
pattern of the flexural reinforcement (Unterweger et al. 2009). When the delaminated
section spalls, the concrete cover to the reinforcement is lost, further exposing the
flexural reinforcement and initiating the next cycle of corrosion.
1.1.1 Chloride Intrusion
In Ontario, deicing salts are used on highways during the winter months to melt snow and
ice (MTO 2008). These salts mix with snow and water to form a liquid brine that
becomes an airborne spray due to traffic movement. When this spray comes into direct
contact with the underside of the bridge, chloride ions penetrate the cracks, voids and
surface pores of the concrete, lowering the pH (Bertolini et al. 2004). This dissolves the
oxide film, exposing the flexural reinforcement to the moisture and oxygen necessary for
corrosion to occur. This type of deterioration occurs at localized sections and causes
cracking, visible rust stains, delamination, and spalling. The depth of contamination is
typically greatest immediately above the travelled lanes (Bertolini et al. 2004, Nehdi
2011).
1.1.2 Carbonation
The flexural reinforcement can also be corroded by the carbonation process, where
atmospheric carbon dioxide, CO2, and moisture react with the concrete to gradually lower
reinforcement a process, similar to that for chloride intrusion, occurs. This type of
deterioration is usually more uniform over the length of the girder causing flaking rust
(Nehdi 2011).
1.2
Deteriorated reinforced concrete highway bridge girders are regularly repaired using the
patch repair process, where the flexural reinforcement must be repassivated by removing
the existing contaminated concrete and replacing it with new concrete (Nedhi 2010,
Bertolini et al. 2004), temporarily exposing the flexural reinforcement, as shown in
BRIDGE REHABILITATION TECHNIQUES
Figure 1-2. The repair of a reinforced concrete girder is typically intended to ensure the
structure achieves at least its original service life (Nehdi 2010). The three significant
steps in the patch repair process are:
1. Removal of all contaminated concrete.
2. Preparation of the surface of the existing concrete including cleaning and
application of a bonding agent.
3. Placement of the repair concrete.
The first step is most pertinent to the current study and so warrants further description. It
involves removal of all, or a significant amount, of the existing contaminated concrete to
expose a sound concrete substrate. This reduces the risk of further deterioration caused by
contaminated concrete remaining after the repair (Guettala et al. 2006).
The perimeter of each deteriorated area is first outlined by saw-cutting through the cover
in contact with and between the reinforcing bars is then removed using a light pneumatic
hammer (OPSS 1994).
Figure 1-2: Patch Repair Process: (a) Removal of Contaminated Concrete (b) Concrete Replacement (MTO 2010).
The remaining contaminated concrete is removed using a smaller chipping hammer,
which is easier to operate and reduces the possibility of damaging the uncontaminated
concrete substrate or the flexural reinforcement. For each deteriorated area, the removal
is preformed to a minimum of 25 mm beyond the inner surface of the first layer of
flexural reinforcement to ensure that there is sufficient space for the repair concrete to be
consolidated around the flexural reinforcement and to create an adequate bond (Emmons
et al. 2003). It has been independently established (Cairns and Zhao 1993) that a removal
of concrete to a depth of at least 20 mm behind the flexural reinforcement will result in a
durable repair with proper bond between the new material and the flexural reinforcement.
1.3
While the cause of reinforcement corrosion has been exhaustively researched, the
strength assessment of the girders with exposed flexural reinforcement has not been so
thoroughly investigated (Eyre et al. 1992). Rehabilitation using the patch repair process
causes the bond between the flexural reinforcement and concrete to be, at least
temporarily, lost. Consequently the flexural capacity of the girder is uncertain because,
while plane sections remain plane in the concrete at each cross section, the requirement
for compatible strains in the flexural reinforcement and the adjacent concrete no longer
holds, as shown in
EVALUATION OF BRIDGE GIRDERS DURING REHABILITATION
Figure 1-3 (Bartlett 1998, Cairns and Zhao 1993). The flexural
capacity is not easily computed because the usual provisions for design, as specified in
Section 8.8 of the Canadian Highway Bridge Design Code (CHBDC), CAN/CSA-S6-06
(CSA 2006) are not applicable. Sections 14 and 15 of the CHBDC outline the procedures
for the evaluation, rehabilitation and repair of existing bridges, but provide no guidance
to assist practitioners evaluating the capacity of reinforced concrete girders with exposed
flexural reinforcement.
Figure 1-3: Compatible Strain Requirement: (a) Satisfied for Bonded Flexural Reinforcement, (b) Not Satisfied when Flexural Reinforcement is Exposed.
1.4
The objective of the research reported in this thesis is to rectify the knowledge gap in the
current code criteria for evaluating reinforced concrete highway girders with exposed
flexural reinforcement. The research will provide an important tool to assist practicing
engineers in evaluating these girders safety during rehabilitation.
OBJECTIVES
The specific objectives of this research are as follows:
1. Examine thoroughly previous experimental and analytical investigations to
determine the observed behaviour and possible failure modes of reinforced
concrete beams with exposed flexural reinforcement.
2. Develop analytical methods that can accurately predict the maximum capacity of
reinforced concrete highway girders with a given length of exposed flexural
reinforcement or determine the maximum length that can be exposed that does not
cause a reduction of the flexural capacity.
3. Conduct an experimental investigation of reinforced concrete T-section specimens
with exposed flexural reinforcement to validate the analytical methods developed.
1.5
Chapter 2 presents a literature review of previous experimental and analytical
investigations concerning reinforced concrete specimens with exposed flexural
reinforcement. Chapter 3 presents two analytical approaches developed to analyze
reinforced concrete bridge T-section girders with exposed flexural reinforcement: (1)
Strain Compatibility Analysis (SCA), and (2) Strut-and-Tie Analysis (STA). Both
approaches can be used to predict the longest length of flexural reinforcement that can be
exposed that ensures a girder will still exhibit a ductile failure with no reduction in yield
capacity. Chapter 4 presents a description and the results of a new experimental
investigation of five 4-metre reinforced concrete T-section specimens with exposed
flexural reinforcement, that was undertaken to evaluate the accuracy of the analytical
approaches developed in Chapter 3. Chapter 5 presents a comparison of these
experimental results with the analytical predictions to assess their validity. Finally,
CHAPTER 2:
2.1
REVIEW OF LITERATURE
A literature review is necessary before developing analytical approaches and conducting
an experimental study. This chapter will therefore examine previous experimental
investigations to extract: a summary of the test specimen geometries and loading
configurations; the findings of the studies; and, a general description of the behaviour of
specimens with exposed flexural reinforcement.
INTRODUCTION
2.2
Since 1980, eight experimental investigations on the effect of exposed flexural
reinforcement have been conducted. A total of 219 specimens of moderate scale have
been tested, comprising either single- or two-point loading with spans ranging from 1500
to 4000 mm.
SCOPE OF EXPERIMENTAL INVESTIGATIONS
Table 2-1 summarizes the seven distinct specimen configurations tested.
Configurations 1 - 4 all involve specimens with two-point loading. For Configuration 1,
the exposed flexural reinforcement is located within the constant moment region between
the applied loads and so has negligible effect. The girder behaves essentially as an intact
girder: there would be no “tension stiffening” between flexural cracks so it would be less
stiff and exhibit slightly larger deflections at serviceability-level loads. For Configuration
2, the exposed flexural reinforcement will impact the response because it extends beyond
the central constant moment region. For Configuration 3, the exposed flexural
reinforcement is located entirely in one of the constant shear regions. Tests using
Configuration 3 have also been conducted with the flexural reinforcement exposed in
reinforcement is exposed in only one half of the specimen in both the constant moment
and constant shear regions.
Table 2-1: Test Specimens and Loading Configurations Studied by Others.
No. Specimen Configuration Dominant
Failure Mode Authors
1 Flexure Cairns and Zhao (1993)
2 Flexure,
Flexure/Shear
Nokasteh et al. (1992), Cairns and Zhao (1993),
Bartlett (1998), Cairns (1995), Xiong et al. (2000),
Sharaf and Soudki (2002)
3 Shear Raoof and Lin (1993, 1995,
1997), Cairns (1995)
4 Flexure,
Flexure/Shear
Raoof and Lin (1993, 1995, 1997)
5 Flexure, Shear Minkarah and Ringo (1982)
6 Shear, Flexure Raoof and Lin (1993, 1995, 1997)
7 Shear/Flexure,
Flexure
Raoof and Lin (1993, 1995, 1997)
Configurations 5 - 7 involve specimens subjected to single-point loading. For
centreline of the specimen and the point load is located outside of the exposed length. For
Configuration 6, the exposed flexural reinforcement is located in the high shear region
near the left support with the load applied beyond the exposed length, near midspan.
Configuration 7 is similar, but with the point load applied within the exposed length. A
full description of all the previous investigations is presented in Appendix A.
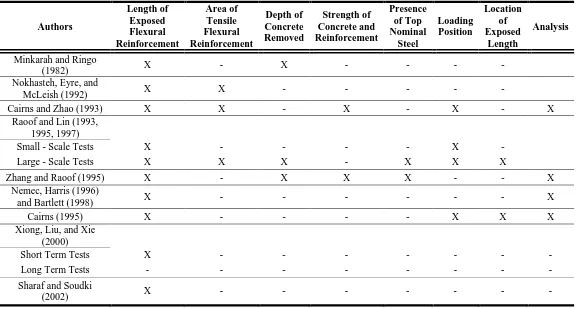
Table 2-2 outlines the important parameters, shown in Figure 2-1, identified by past
researchers as potentially influencing the behaviour of specimens with exposed flexural
reinforcement. It also indentifies the studies where the experimental findings were
supplemented by structural analysis. The following parameters are deemed to be
important:
1. Length of exposed flexural reinforcement, exp
2. Area of tensile flexural reinforcement, As
3. Depth of concrete removed, dc
4. Compressive strength of concrete, fc',
5. Yield strength of flexural reinforcement, fy
6. Presence of nominal top reinforcement, As'
7. Position of loading: location of load from left support, αL, for a single load or
spacing, S, for symmetric two-point loads
Figure 2-1: Elevation of Specimen with Exposed Flexural Reinforcement with Important Parameter Identified.
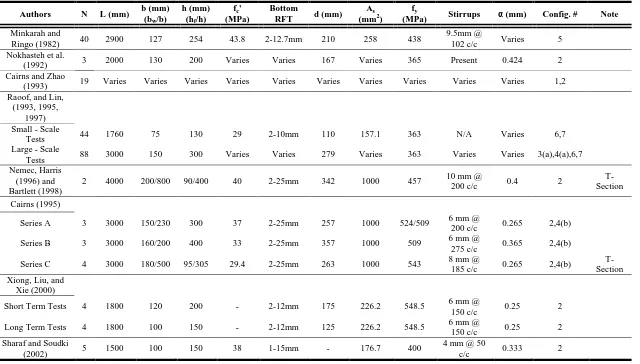
Table 2-3 summarizes the specimen dimensions, material properties, and loading
configurations investigated. In addition to the variables previously defined, it indicates:
the number of specimens tested, N; span length, L; overall height, h, and flange
thickness, hf; overall flange width, bf; web width, bw; effective depth of flexural
reinforcement, d; stirrup arrangement, size and centre-to-centre spacing; and, specimen
configuration.
These summaries indicate that most previous experimental investigations involved
rectangular reinforced concrete specimens and all used either single- or two-point
loading. Concrete bridge girders typically feature a substantial top slab and resist
substantial uniformly distributed dead loads, so the scope of these investigations are not
realistic. Therefore an experimental investigation of T-section specimens loaded with
some combination of a uniformly distributed dead load and a live load is necessary to
more accurately represent the type of girder and applied loading seen in the field.
αL S
exp
end
Table 2-2: Parameters Investigated in Current Literature. Authors Length of Exposed Flexural Reinforcement Area of Tensile Flexural Reinforcement Depth of Concrete Removed Strength of Concrete and Reinforcement Presence of Top Nominal Steel Loading Position Location of Exposed Length Analysis
Minkarah and Ringo
(1982) X - X - - - -
Nokhasteh, Eyre, and
McLeish (1992) X X - - - - -
Cairns and Zhao (1993) X X - X - X - X
Raoof and Lin (1993, 1995, 1997)
Small - Scale Tests X - - - - X -
Large - Scale Tests X X X - X X X
Zhang and Raoof (1995) X - X X X - - X
Nemec, Harris (1996)
and Bartlett (1998) X - - - X
Cairns (1995) X - - - - X X X
Xiong, Liu, and Xie (2000)
Short Term Tests X - - - -
Long Term Tests - - - -
Sharaf and Soudki
(2002) X - - - -
Table 2-3: Details of Specimens with Exposed Flexural Reinforcement.
Authors N L (mm) b (mm) (bw/b)
h (mm) (hf/h)
fc'
(MPa)
Bottom
RFT d (mm) As
(mm2) fy
(MPa) Stirrups α (mm) Config. # Note Minkarah and
Ringo (1982) 40 2900 127 254 43.8 2-12.7mm 210 258 438
9.5mm @
102 c/c Varies 5
Nokhasteh et al.
(1992) 3 2000 130 200 Varies Varies 167 Varies 365 Present 0.424 2
Cairns and Zhao
(1993) 19 Varies Varies Varies Varies Varies Varies Varies Varies Varies Varies 1,2
Raoof, and Lin, (1993, 1995,
1997) Small - Scale
Tests 44 1760 75 130 29 2-10mm 110 157.1 363 N/A Varies 6,7
Large - Scale
Tests 88 3000 150 300 Varies Varies 279 Varies 363 Varies Varies 3(a),4(a),6,7
Nemec, Harris (1996) and Bartlett (1998)
2 4000 200/800 90/400 40 2-25mm 342 1000 457 10 mm @
200 c/c 0.4 2
T-Section
Cairns (1995)
Series A 3 3000 150/230 300 37 2-25mm 257 1000 524/509 6 mm @
200 c/c 0.265 2,4(b)
Series B 3 3000 160/200 400 33 2-25mm 357 1000 509 6 mm @
275 c/c 0.365 2,4(b)
Series C 4 3000 180/500 95/305 29.4 2-25mm 263 1000 543 8 mm @
185 c/c 0.265 2,4(b)
T-Section Xiong, Liu, and
Xie (2000)
Short Term Tests 4 1800 120 200 - 2-12mm 175 226.2 548.5 6 mm @
150 c/c 0.25 2
Long Term Tests 4 1800 100 150 - 2-12mm 125 226.2 548.5 6 mm @
150 c/c 0.25 2
Sharaf and Soudki
(2002) 5 1500 100 150 38 1-15mm - 176.7 400
4 mm @ 50
c/c 0.333 2
2.3
Marked differences in failure mode, flexural capacity, and crack patterns were observed
between specimens with and without exposed flexural reinforcement that were otherwise
identical. This section will synthesize the behaviour of specimens with exposed flexural
reinforcement. Some previous researchers (e.g., Cairns and Zhao 1993, Harris 1996)
developed analytical models to predict these behavioural changes. The influence of the
important parameters previously identified is also summarized.
FINDINGS OF PREVIOUS EXPERIMENTAL INVESTIGATIONS
2.3.1 Observed Failure Modes
For the seven unique configurations shown in Table 2-1, the five failure modes shown in
Figure 2-2 were observed. Ranked by frequency of occurrence, they are as follows:
1. Yielding of the exposed flexural reinforcement followed by crushing of the
concrete on the compression face of the specimen
2. Crushing of the concrete on the compression face of the specimen before yielding
of the exposed flexural reinforcement
3. Compression failure in the concrete at the ends of the exposed flexural
reinforcement length
4. Anchorage failure at one end of the exposed flexural reinforcement
5. Shear failure
The first two modes are the most predominant for flexural failures, while the remaining
three are most predominant for shear-flexural failures.
Figure 2-2: Failure Modes Observed in the Previous Experimental Investigations.
The specimens with exposed flexural reinforcement that would exhibit a ductile flexural
failure if no reinforcement was exposed generally failed by one of failure modes 1 - 4
(e.g., Minkarah and Ringo 1982, Cairns and Zhao 1993). Failure modes 3 and 4 occurred
only when the end of the exposed length was close to the support. The specimens that
would have failed in shear, a brittle mode, if no reinforcement was exposed generally
failed by failure modes 1, 2, 4, or 5 (Cairns 1995).
2.3.2 Flexural Capacity
Cairns and Zhao (1993) studied the change in flexural capacity of specimens that would
exhibit a ductile failure if no reinforcement was exposed. Figure 2-3, redrawn from their
paper, shows measured midspan concrete strain distributions, with tensile strains positive,
at different depths from the extreme compression fibre for a specimen with a flexural
reinforcement ratio, ρ, of 1.64% and exp increasing from 0 to 63% of the 3000 mm span
length. Exposure of the flexural reinforcement from zero to 1900 mm increased the
extreme fibre compressive strain from -0.0008 to -0.0012, and reduced the neutral axis
depth, c, from 120 mm to 80 mm. The associated curvatures increased by a factor of 2.25.
They also tested 17 rectangular specimens with exp ranging from 60 to 95% of the span
length that exhibited a reduction in flexural capacity ranging from 1 to 48%.
4 2
5 3
Figure 2-3: Change in Longitudinal Strains in Concrete Section on Exposure of Flexural Reinforcement (Redrawn from Cairns and Zhao 1993).
Bartlett (1998), Harris (1996) and Nemec (1996) tested two 4000 mm long T-section
specimens, one a control and the second a test specimen with 2000 mm of flexural
reinforcement exposed symmetrically about the midspan. They observed that both the
control and test specimens behaved in a linear elastic manner until the flexural
reinforcement yielded, but the second specimen had only 81% of the stiffness of the
control specimen. After the flexural reinforcement yielded, the load resisted by the
control specimen continued to increase while that resisted by the other specimen
gradually reduced before failure.
The capacity of specimens with exposed flexural reinforcement that would have failed in
shear if no reinforcement was exposed differed markedly. Cairns and Zhao (1993)
observed that exposure of the flexural reinforcement does not always reduce the shear
capacity. Four specimens with exposed flexural reinforcement that would have failed in
0
50
100
150
200
250
300
-0.0015 -0.001 -0.0005 0 0.0005 0.001 0.0015
Bonded
lexp = 700/1000/1300/ 1600/1900 mm
Reduced N.A. Depth Increased
shear if the flexural reinforcement was fully bonded exhibited an increased shear capacity
and failed in flexure.
Cairns (1995) performed ten additional shear tests that confirmed that exposing the
flexural reinforcement increased the shear capacity of specimens, in some cases by a
substantial margin, for all but lightly-reinforced specimens. The failure loads of the test
specimens were higher, typically between the calculated shear and flexural failure loads
of the control specimens.
All remaining researchers (e.g., Minkarah and Ringo 1982, Nokasteh et al. 1992, Raoof
and Lin 1993, 1995, 1997, Xiong et al. 2000, and Sharaf and Soudki 2002) observed
similar findings concerning the reduction of the flexural capacity of specimens with
exposed flexural reinforcement.
2.3.3 Cracking Patterns
There is a wide consensus that exposing the flexural reinforcement substantially changes
the crack patterns (Nokhasteh et al. 1992, Cairns and Zhao 1993, Xiong et al. 2000,
Sharaf and Soudki 2002). As shown in Figure 2-4, the specimens with exposed flexural
reinforcement typically had:
1. Fewer, wider and larger spaced flexural cracks in the high moment region
2. Greater flexural crack heights
3. Bifurcation at the flexural crack tips
5. Flexural cracks near the ends of the exposed length at the top (i.e., ‘compression’)
face of the specimen.
6. Bond-splitting cracks at the ends of the exposed flexural reinforcement.
The cracks in specimens with exposed flexural reinforcement within the constant moment
region were abrupt, appeared at very low loads, and as shown in Figure 2-4(b), had
widths 25 times greater than those in control specimens. The large crack widths were
attributed to the lack of bonded flexural reinforcement across the crack and the increased
midspan curvature caused by exposing the flexural reinforcement (Cairns and Zhao
1993). These cracks, once initiated, propagated immediately to the neutral axis, where
they typically bifurcated, often propagating horizontally in opposite directions (Minkarah
and Ringo 1982, Cairns and Zhao 1993).
Figure 2-4: Contrast in Crack Patterns between: (a) Control Specimen and (b) Specimen with Exposed Flexural Reinforcement (Cairns and Zhao 1993).
Specimens loaded to service load levels before exposing the flexural reinforcement
displayed only minor changes of crack patterns. The cracks were not as wide at midspan
because numerous narrow flexural cracks already existed before the flexural (a)
(b) 4
3
1 2 5
reinforcement was exposed. The crack height at service load levels increased, due again
to the reduced neutral axis depth, c, caused by exposing the flexural reinforcement. Crack
widths in the shear span at service load levels reduced when the flexural reinforcement
was exposed. These crack patterns suggest that exposing the flexural reinforcement may
cause a strain reversal to occur towards the support, with compression on the bottom face
of the specimen.
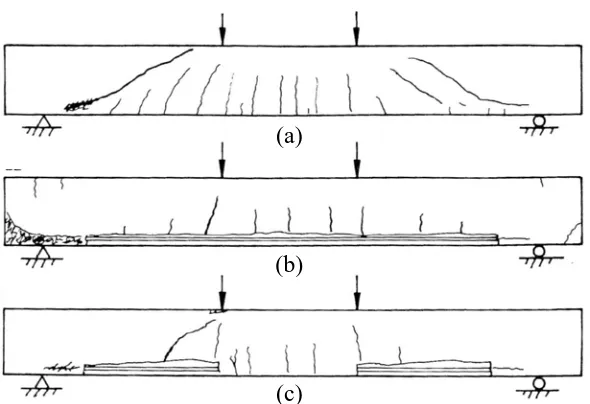
In Cairns’ (1995) ten additional shear tests, the crack patterns changed considerably if the
flexural reinforcement was exposed. Figure 2-5 shows the crack patterns for the control
specimen and the two specimens with exposed flexural reinforcement. The control
specimen exhibited typical shear cracks near the left support. The specimens with
exposed flexural reinforcement displayed critical diagonal cracks that were steeper and
located closer to the applied point loads. The specimen in Figure 2-5(b) experienced an
anchorage failure, while the specimen in Figure 2-5(c) experienced a shear failure at a
cross section closer to the applied load. These crack patterns suggest that exposing the
flexural reinforcement causes the number of diagonal cracks to reduce, and their location
Figure 2-5: Crack Patterns of Specimens Designed to Exhibit a Shear Failure: (a) Control, (b) and (c) Specimens with Exposed Flexural Reinforcement (Cairns 1995).
Raoof and Lin (1993, 1995, 1997) tested specimens with Configurations 3 and 4 and
typically observed crack patterns shown in Figure 2-6. For either configuration, the crack
patterns from midspan to the right support, where no flexural reinforcement was exposed,
were similar to those that would be observed if no reinforcement was exposed: vertical
flexural cracks at the midspan that gradually change to inclined shear cracks towards the
right support. There were two subtle differences between the crack patterns for the two
configurations. First, Configuration 4 (Figure 2-6(b)) exhibited more shear cracks near
the right support, likely due to the higher applied shear in this region. Second, the large
crack within the exposed length for Configuration 4 is located directly under the left
applied point load, while no crack occurs at the end of the exposed length. For
Configuration 3 (Figure 2-6(a)), where the left point load is located beyond the exposed
length, the large crack is located directly at the right end of the exposed length and no
cracks were observed within the exposed length. (a)
Figure 2-6: Loading and Cracking Patterns for (a) Specimen Configuration 3, and (b) Specimen Configuration 4 (Raoof and Lin 1997).
Minkarah and Ringo (1982) observed different crack patterns for specimens with only the
reinforcement cover removed and specimens with both the cover removed and the
flexural bond lost, as shown in Figure 2-7. Removal of only the cover caused behaviour
similar to that of the fully bonded control specimen, likely because bond is partially
maintained to help control cracking. If both the cover and the flexural bond were lost, the
height of the cracks under the point load increased, highlighting the local decrease in the
neutral axis depth. A flexural crack was observed at the end of the exposed length and no
flexural cracks were observed within the exposed length likely because the exposed
flexural reinforcement could not transfer any of the stress at this crack to the concrete in
the exposed length. Flexural cracks reappeared to the right of the exposed length likely
because the flexural bond was present again.
Figure 2-7: Crack Patterns Observed with: (a) Loss of Cover Only, and (b) Loss of Cover and Flexural Bond (Minkarah and Ringo 1982).
(a)
(a) (b)
2.3.4 Effective Depth of the Flexural Reinforcement
Previous researchers (e.g., Nemec 1996, Cairns and Zhao 1993) observed that as the
specimens deflected during testing, the gap between the bottom of the concrete web and
the exposed flexural reinforcement reduced until the two came into contact. This reduces
the effective depth of the flexural reinforcement, d, and so reduces the flexural capacity.
2.4
Reinforced concrete girders are normally designed to exhibit ductile flexural failures
initiated by yielding of the flexural reinforcement followed by crushing of the concrete
(e.g., MacGregor and Bartlett 2000). This “under-reinforced” condition is preferable to
ensure warning of the imminent failure. If the girder is “over-reinforced”, the concrete
crushes before the flexural reinforcement yields and the failure occurs suddenly, without
visible warning. When the flexural reinforcement yields and the concrete crushes
simultaneously, failure is referred to as “balanced”. The response of deteriorated
reinforced concrete girders during the repair process must be analyzed because, during
the interval when the flexural reinforcement is exposed, the flexural failure mode can
transition from under- to over-reinforced (Cairns and Zhao 1993).
ANALYTICAL MODEL FOR GIRDERS WITH EXPOSED FLEXURAL REINFORCEMENT
The loss of the steel-concrete bond over portions of a girder causes plane sections to still
remain plane in the concrete but invalidates the requirement of compatible strains in the
flexural reinforcement and the adjacent concrete (Bartlett 1998, Cairns and Zhao 1993,
Harris 1996, Zhang and Raoof 1995, Cairns 1995). The girder will act more like a tied
1998) resulting in a redistribution of stresses and strains that is unlikely to have been
considered in the original design.
Cairns and Zhao (1993) present a qualitative description of the structural behaviour of
girders that exhibit a ductile failure if no reinforcement is exposed when concrete is
removed. After flexural cracking, if the concrete compressive response is linear-elastic,
horizontal force equilibrium requires that:
[2.1] s s c
c A f + f b = 0
2
where fs is the tensile stress in flexural reinforcement (negative if tension), and fc is the
concrete compressive stress in extreme fibre.
Moment equilibrium requires that:
[2.2] M = A f jd s s
where M is the applied bending moment, and jd is the lever arm between the internal
tensile and compressive force resultants, equal to d – (c/3).
The new compatibility requirement is that the longitudinal deformations of concrete and
the flexural reinforcement must be compatible at the ends of the exposed flexural
reinforcement length, exp:
[2.3]
exp exp
s cs
ε d - ε d = 0
∫
∫
where εs is the tensile strain in exposed flexural reinforcement (negative if tension) and
εcs is the extrapolated strain in the concrete at the depth of the exposed flexural
reinforcement, computed assuming plane sections remain plane.
Before concrete is removed, the girder acts as a simple beam, as shown in Figure 2-8.
The neutral axis depth, c, and the lever arm, jd, between the tensile force in the flexural
reinforcement and the compressive force in the concrete are both approximately constant
over the length of the girder. The necessary assumption is that perfect bond exists
between the flexural reinforcement and the concrete so the strains in the flexural
reinforcement and in the concrete at the depth of the flexural reinforcement are equal,
Eqn. [2.3].
If exp extends beyond the constant moment region of a girder subjected to symmetric
four-point loading, Eqn. [2.3] is not automatically satisfied because the applied bending
moment reduces in the constant-shear region between each loading point and the adjacent
support, but εs must remain constant where the flexural reinforcement is exposed. The
compatibility requirement can be written as:
[2.4]
exp
s exp cs
ε -
∫
ε d = 0To satisfy Eqn. [2.2], the lever arm, jd, must reduce at cross sections close to the
supports, requiring an increase in the neutral axis depth, c, as shown in Figure 2-9, and so
reducing the concrete compressive strain at the extreme compression fibre, εc. In this
becomes fully stressed in compression. If exp is long, the neutral axis then reappears
above the cross section and moves downwards as the distance to the support reduces. The
stresses in the concrete in this region have the opposite sense of those at midspan, with
tension above the neutral axis and compression below it.
Figure 2-8: Location of the Neutral Axis Depth, c, for a Girder with no Flexural Reinforcement Exposed (Redrawn from Cairns and Zhao 1993).
Figure 2-9: Location of the Neutral Axis Depth, c, for a Girder with Exposed Flexural Reinforcement (Redrawn from Cairns and Zhao 1993).
To satisfy the compatibility condition, Eqn. [2.4], the neutral axis depth at midspan must
be reduced (Cairns 1995), as shown in Figure 2-10, to create large tensile strains in the
concrete at the depth of the exposed flexural reinforcement. The associated increased
curvature and extreme fibre concrete compressive strain can cause crushing of the
concrete before the exposed flexural reinforcement yields.
Asfs jd Neutral
Axis
c
fcb(c/2)
Asfs jd fc
C L sym
L sym C
Figure 2-10: Location of the Neutral Axis Depth, c, for a Girder with Exposed Flexural Reinforcement to Maintain Compatibility, Eqn. [2.4] (Redrawn from Cairns and Zhao
1993).
Tests of a reinforced concrete T-section specimen with exposed flexural reinforcement
(Bartlett 1998, Harris 1996) displayed a similar response to that described by Cairns and
Zhao (1993). The neutral axis location varied along the length of the specimen as shown
in Figure 2-11, resulting in high curvatures and large extreme fibre compressive strains in
the concrete at midspan. Failure was initiated by the tensile steel yielding, but the
ductility at failure was limited by a local crushing failure across the width of the
compression flange.
Figure 2-11: Neutral Axis Depth, c, Variation Along Length of Test Specimen with Exposed Flexural Reinforcement (Bartlett 1998).
Raoof and Lin (1993, 1995, 1997) tested specimens with Configurations 3 and 4. They
observed similar responses as reported by Cairns and Zhao (1993) and Bartlett (1998). Asfs
jd C sym L
Using the profiles of concrete strain distribution measured along the top and bottom
surfaces of the specimen for applied loads of 20, 40, and 60 kN (Raoof and Lin 1997), the
neutral axis depth, c, was determined. Figure 2-12 show the neutral axis location for
Configurations 3 and 4. Near the right support of the test specimens, where no
reinforcement was exposed, the neutral axis depth is fairly constant. Near the left support,
at the end of the exposed flexural reinforcement, the neutral axis depth, c, increases and
moves below the soffit of the test specimen. Within the exposed length, the neutral axis
reappears above the test specimen and increases with a strain reversal with tensile strain
(positive) at the top and compressive (negative) at the bottom.
Figure 2-12: Loading and Variation of the Neutral Axis Depth for Specimens: (a) Configuration 3 and, (a) Configuration 4 (Redrawn from Raoof and Lin 1997).
(a)
(b) 60 kN
20 kN 40 kN
60 kN 20 kN 40 kN
20 kN 60 kN
40 kN
60 kN
40 kN
This qualitative description can also be described as a transition of the behaviour from
beam action to arching action (e.g., MacGregor and Bartlett 2000). In a reinforced
concrete girder, shear can be carried by a combination of beam and arching action:
[2.5] V = dM = d(Tjd) = Td(jd) + jdd(jd)
dx dx dx dx
where V is the applied shear force, T is the tensile force in the flexural reinforcement, and
x is the distance along the longitudinal axis of the girder.
When the flexural reinforcement is fully bonded to the concrete, the applied shear is
resisted entirely by beam action. The resultant compressive, C, and tensile forces are
therefore separated by a constant lever arm, jd, and so reduce as the moment reduces, as
shown in Figure 2-13:
[2.6] d(jd) = 0 and V = d(T) jd
dx dx
Figure 2-13: Beam Action with Constant Lever Arm if Flexural Reinforcement is Fully Bonded.
C = Compressive Force
jd = Lever Arm (Constant)
If the flexural reinforcement is exposed, eliminating bond, the applied shear must be
resisted entirely by arching action where the tensile force is constant and the lever arm,
jd, must vary to satisfy the moment equilibrium over the exposed length, exp:
[2.7] d(T) = 0 and V = Td(jd)
dx dx
The lever arm, jd, reduces and an inclined concrete thrust line, or compressive strut,
forms between the support reaction and the load point, as shown in Figure 2-14. The
flexural stress reversal near the support, i.e., with the top fibre in tension, is consistent
with the formation of this strut. The ends of long exposed lengths can encroach on the
inclined compressive strut near the support, significantly limiting its area and so reducing
its capacity.
Figure 2-14: Arching Action with Varying Lever Arm if Flexural Reinforcement is Exposed.
For specimens that exhibit a shear failure if no reinforcement is exposed, the increased
shear capacity observed when the flexural reinforcement is exposed cannot be currently
explained. Girders are normally designed to ensure that the shear capacity is greater than
the flexural capacity so the girder will fail in a ductile flexural mode instead of a brittle
shear mode (MacGregor and Bartlett 2000). The shear capacity of girders with exposed C = Compressive Force
jd = Lever Arm (Varies)
T = Tensile Force (Constant) Inclined Compressive
Strut
flexural reinforcement is therefore also important. Conventionally (e.g., Cairns 1995), the
shear capacity is attributed to:
1. Concrete in the compression zone resisting shear
2. Aggregate interlock
3. Dowel action of flexural reinforcement
4. Transverse reinforcement, typically stirrups
If flexural reinforcement is exposed in a region subjected to shear, any dowel action is
lost and the contribution of the stirrups is reduced if their bottom corner anchorages are
exposed (Cairns 1995).
In light of the findings by Cairns (1995) and the consideration that bridge girders are
normally designed to fail in a ductile flexural mode, the shear capacity of specimens with
exposed flexural reinforcement will not be investigated in the current study.
In general, for a girder with given geometric and material properties, there exists a critical
length of exposed flexural reinforcement, c, where the failure transitions from ductile to
brittle. At this transition point, the flexural reinforcement will yield and the concrete will
simultaneously crush, with little reduction in flexural capacity attributable to exposing the
flexural reinforcement. As exp approaches c, the flexural reinforcement strain at failure
gradually reduces, but the girder will achieve its flexural yield capacity. Once exp
exceeds c, the flexural reinforcement will not yield, the girder will exhibit a brittle
Ringo 1982, Nokhasteh et al. 1992, Cairns and Zhao 1993, Raoof and Lin 1997, Xiong et
al. 2000, Sharaf and Soudki 2002).
Based on these considerations, there are currently three different analytical models for
predicting the flexural capacity of reinforced concrete specimens with exposed flexural
reinforcement, based on Eqns. [2.1] to [2.4]. Cairns and Zhao (1993) and Zhang and
Raoof (1995) independently developed two unique models for rectangular reinforced
concrete sections that accurately predicted the reduction in flexural capacity for the 17
specimens investigated by Cairns and Zhao (1993). Both models are only applicable to
rectangular sections, and Cairns and Zhao (1993) do not present their model in detail.
Harris (1996) developed an analysis for T-section beams with exposed flexural
reinforcement that displayed a similar response to that observed by Cairns and Zhao
(1993) and accurately predicted the flexural capacity of the one specimen investigated.
The limitation of this model is that a linear compressive stress-strain relationship for the
concrete is assumed, even in the high stress regions.
2.5
The influence of the various important parameters on the behaviour of specimens with
exposed flexural reinforcement has been extensively investigated in the previous studies.
This section summarizes the influence of the various parameters for each configuration
investigated. Three of the parameters have been deemed to be particularly important: the
length of exposed flexural reinforcement,
INFLUENCE OF THE IMPORTANT PARAMETERS
exp
, the position and type of loading, αL, and