DOI: 10.15680/IJIRSET.2014.0308067
Computational Fluid Dynamics and
Experimental Analysis for Optimum
Geometry of Vortex Tube
D.D. Pawar
1, B. Sridhar Babu
2P.G. Student, Department of Mechanical Engineering, CMR IT, Medchal Road, Hyderabad, Andhra Pradesh, India1
Head, Department of Mechanical Engineering, CMR IT, Medchal Road, Hyderabad, Andhra Pradesh, India2
ABSTRACT: A vortex tube is a simple energy separating device which splits a compressed air stream into a cold and
hot stream without any external energy supply or chemical reactions. This paper presents an overview of recent research on Ranque-Hilsch Vortex Tube (RHVT) with divergent tube and snail entry, increase in nozzle number and supply pressure leads to the rise of swirl / vortex intensity & thus maximum energy separation in the tube. The paper develops three dimensional flow domain using Computational Fluid Dynamics (CFD) and this CFD and experimental studies are conducted towards the optimization of RHVT. The optimum cold end diameter (dc), number of snail entry and optimum parameters for obtaining the maximum hot gas temperature and minimum cold gas temperature are obtained through CFD analysis and validated through experiments.
KEYWORDS:CFD analysis, Energy separation mechanism, Experimental validation, Ranque –Hilsch vortex tube.
I. INTRODUCTION
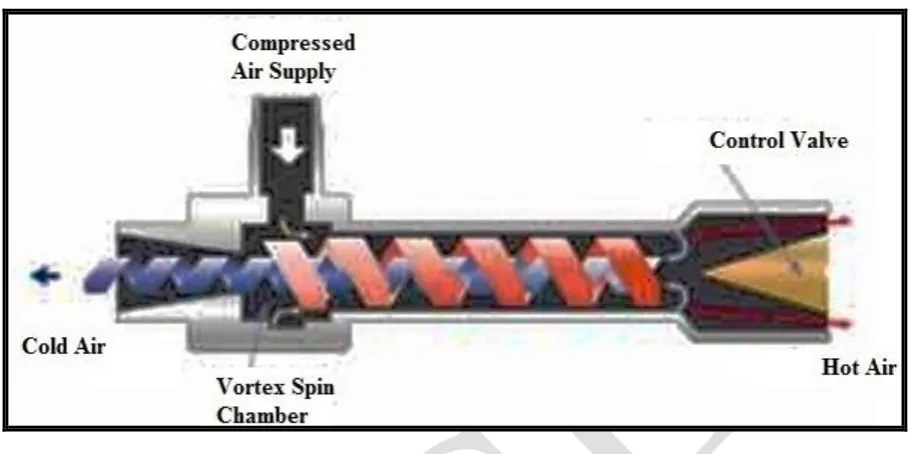
The vortex tube is a simple mechanical device which is also known as the Ranque–Hilsch vortex tube (RHVT), operating as a refrigerating machine without any moving part e.g. rotating shafts or piston cylinders. It consists of a principal tube, which a high-pressure gas stream enters tangentially, and splits in two low pressure hot and cold temperature streams. Cold gas stream leaves the tube through a central orifice near the entrance nozzle, while hot gas stream flows toward regulating valve and leaves the tube. Ranque-Hilsch vortex tube dates back to the 1930s where French physicist George Ranque invented an early prototype. Around 1945 when the German army occupied most of France, Rudolf Hilsch, a German physicist improved Ranque‟s design to create a better version of the tube. The tube was named after the inventors, but most often is attributed to Hilsch, who made the more notable version. Device itself is illustrated in Fig. 1. As you can see it is a fairly simple piece of equipment with only few parts.
Ranque–Hilsch vortex tube having, relatively simple geometry, no moving mechanical parts and no need for absolute sealing element, was invented by Ranque in 1933,demonstrating the effect of temperature separation of gases. Later, Hilsch described this effect in detail in 1947. Intensive experimental and analytical studies of Ranque–Hilsch effect began since then and continue even today.
The objective of the current research is to find out the optimum value of cold end temperature and mass of the cold air with enhancing the COP and cooling effect by designing the vortex tube with best possible design parameters with the help of CFD and experimental techniques. This work uses many previous experimental results to provide comparisons with theoretical approximations and thus validation of suggested method is described.
Figure 1. Sectional view of the air flow in a counter flow vortex tube
II. LITERATURESURVEY
Upendra Behera, P.J. Paul [1] presented the result of CFD and experimental analysis of vortex tube. The CFD and experimental studies have shown that for 12 mm diameter vortex tube, the cold end diameter of 7 mm is ideal for producing maximum hot gas temperature while cold end diameter of 6 mm is optimum for reaching the minimum cold gas temperature. An experimental investigation was made by Kirmaci Volkan [2] to determine the effects of the orifice nozzle number and the inlet pressure on the heating and cooling performance of the counter flow Ranque–Hilsch vortex tube when air and oxygen used as a fluid. Nimbalkar S., Muller M. R. [3] presented the results of a series of experiments focusing on various geometries of the „„cold end side” for different inlet pressures and cold fractions. The experimental results indicate that there is an optimum diameter of cold end orifice for achieving maximum energy separation. Bramo, A. R., Pourmahmoud N. [4] performed computational fluid dynamics analysis in an attempt to investigate the effect of length to diameter ratio on the fluid flow characteristics and energy separation phenomenon inside the Ranque-Hilsch vortex tube. In this numerical study, performance of Ranque-Hilsch vortex tubes (RHVT), with length to diameter ratios (L/D) of 8, 9.3, 10.5, 20.2, 30.7 and 35 with six straight nozzles was investigated. It was found that the best performance was obtained when the ratio of vortex tube length to the diameter was 9.3. Chang K., Li Qing, Zhou G., Li Qiang, [5] performed Experimentation with hot divergent tube and found that the Energy separation performance of vortex tube can be improved by using a divergent hot tube.
III. DESIGNOFVORTEXTUBE
A. Design constraints:
Geometrical parameters for the design of vortex tube plays very important role on the performance of the vortex tube. Thus many researchers have described the optimum value of the geometrical parameters for best possible performance of the vortex tube. Thus following restrictions are followed:
1) For obtaining the maximum temperature difference at cold end, the ratio L/D should be maintained in the range of 20 ≤ L/D ≤ 55.5.
DOI: 10.15680/IJIRSET.2014.0308067
flow rate to inlet air mass flow rate. This is given by, yc = mc /mi. it gives better result of temperature drop in the range of yc= 0.3 to 0.4.
4) Geometry of vortex tube for maximum temperature drop ,following relationship between tube cross section area, nozzle cross section area and cross section area of cold end orifice is given as, An/At = 0.084 to 0.11 and Ac/At = 0.08 to .145.
5) Decreasing conical vale angle have positive effect on performance of vortex tube but not so much difference is observed in the temperature reduction. Therefore it is better to use conical valve with smaller angle in order to improve the performance of vortex tube.
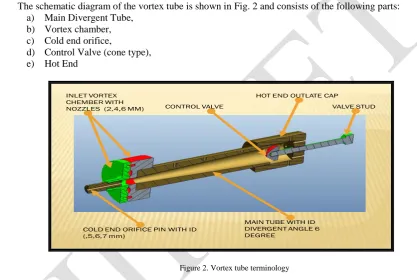
6) The schematic diagram of the vortex tube is shown in Fig. 2 and consists of the following parts
B. Vortex tube terminology:
The schematic diagram of the vortex tube is shown in Fig. 2 and consists of the following parts: a) Main Divergent Tube,
b) Vortex chamber, c) Cold end orifice,
d) Control Valve (cone type), e) Hot End
INLET VORTEX CHEMBER WITH NOZZLES (2,4,6 MM)
COLD END ORIFICE PIN WITH ID (,5,6,7 mm)
MAIN TUBE WITH ID DIVERGENT ANGLE 6 DEGREE
CONTROL VALVE
HOT END OUTLATE CAP
VALVE STUD
Figure 2. Vortex tube terminology
Chamber is a portion of nozzle in the same plane of nozzle and facilitates the tangential entry of high velocity air stream into hot side. Generally, the chambers are not of circular form, but they are gradually converted into spiral form. Hot side is cylindrical in cross section and is of different lengths, as per designs Prof. Parulekar has proposed 3D as the effective length of hot side for the efficient operation of the vortex tube. Control valve obstructs the flow of air through hot side and it also controls the quantity of hot air through vortex tube.
IV. COMPUTATIONALFLUIDDYNAMICSANALYSIS
A. Governing Equations in Computational Fluid Dynamics:
All of Computational Fluid Dynamics, in one form or other is based on fundamental governing equations of fluid dynamics,
Continuity Equation,
Momentum Equation
These equations speak physics of fluid flow. They are the mathematical statements of three fundamental physical principles upon which all fluid dynamics is based. Continuity Equation is based on the principle of conservation of mass.
Net mass flow out of control volume = Time rate of decrease of mass inside control Volume Mass Conservation Equation:
u
S
mt
(1)
Momentum Equation is based on the law of conservation of momentum, which states that the net force acting in a fluid mass is equal to change in momentum of flow per unit time in that direction. The force acting on a fluid element mass „m‟ given by Newton‟s second law of motion is:
F = m x a
Where „a‟ is the acceleration acting in the same direction as force F Momentum Equation:
momS
g
P
uu
t
u
(2)Energy Equation is based on the principle that total energy is conserved. Total energy entering control volume = Total Energy leaving Control volume Energy Equation:
eS
T
k
u
P
e
u
t
e
(3)
Where,
Partial derivative,
Mass density,
u
Velocity,S
Sourcet
Time, mom = Momentum,g
Gravitational acceleration,
Viscosity,e
Specific internal energy,k
Thermal conductivity
T
Temperature,
Viscous dissipationB. Boundary conditions:
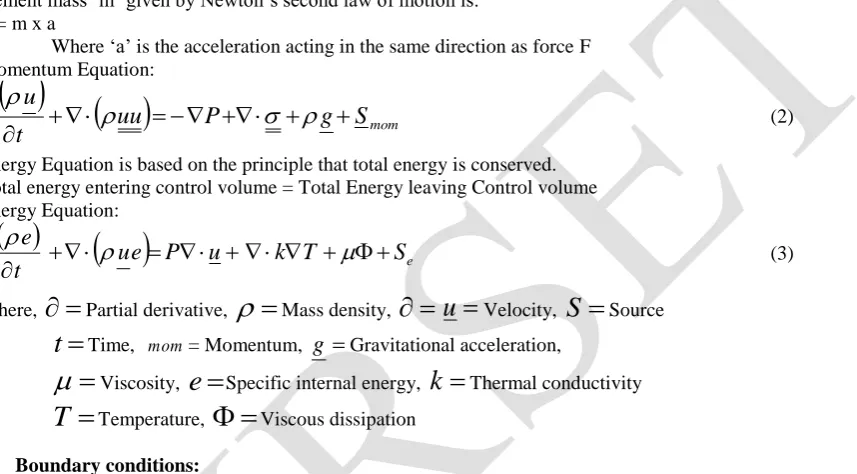
The boundary condition used in this work is Static pressure with temperature at inlet of vortex tube and static pressure at cold & hot end. The domain surface is used as wall with no-slip condition. All details are given in Table I.
C. Grid Generation:
The ANSYS ICEM is used for discrimination of domain. The mesh used for flow domain is hexahedral fine mesh for domain. A high quality hexahedral unstructured mesh is created as shown in Fig. 3.
D. Mesh parameter:
No. of Hexa Elements: 1200380, Minimum angle: 18°, Aspect ratio: 1.9, Quality: 0.17.
Table I. The boundary conditions for 7, 6, 5 mm diameter of orifice
Domain Motion Stationary
Buoyancy Model Non Buoyant
Heat Transfer Model Total Energy
DOI: 10.15680/IJIRSET.2014.0308067
Inlet Type-Inlet
Relative Pressure 3.0 /4.0 /5.0 [bar]
Total Temperature 28 [°C]
Mass And Momentum Static Pressure
Cold End Type-Pressure outlet
Relative Pressure 0.0 [bar]
Hot End Type- Pressure outlet
Mass And Momentum Average Static Pressure
Relative Pressure 2 / 1.6/ 1.2 [bar]
E. CFD results of 5, 6 and 7 mm orifice diameter with 5 bar inlet pressure:
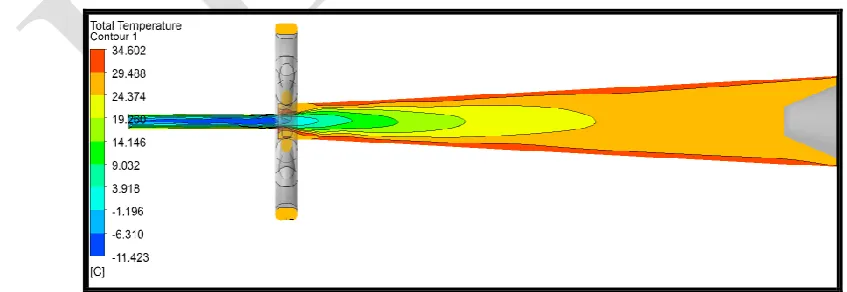
Fig. 4 shows the total temperature contour at centre plane of the vortex tube for 7 mm orifice.
Figure 4. Total temperature contours at the centre plane of vortex tube for 7 mm orifice
Fig. 5 shows the total temperature contour at centre plane of the vortex tube for 6 mm orifice.
Figure 5. Total temperature contours at the centre plane of vortex tube for 6 mm orifice
DOI: 10.15680/IJIRSET.2014.0308067
Total temperature contours plot shows total temperature in the vortex tube towards the hot & cold end. From Fig. 4, 5 and 6, it can be observed, due to high swirling flow the temperature get increased towards the outer side of the diameter means temperature is lower at the centre of the tube and get increased towards the outside of the tube. Also temperature towards cold end goes on decreasing & toward hot end gets increased.
V. TESTSETUP
The aim of this project is to obtain maximum temperature drop. So, there was need of suitable temperature sensing device with some means of measure and indicate that temperature. Here in our set up we have used three RTD sensors and a digital temperature indicator. Also we need to measure the flow of air through the system. That‟s why we have used Rotameter as flow measuring device. The FRL (Filter, Regulator and Lubricator) unit is also required as Filter ensures clean air free from dust, moisture and abrasive particles. Regulator is used to control the pressure also pressure indicator is provided to indicate the pressure. Lubricator is used to lubricate the air. The set up for experimentation is shown in Fig. 7.
The list of components used is as follows: 1. Air Compressor,
2. F.R.L. Unit, 3. Vortex Tube, 4. Rotameter,
5. Temperature Sensors and Indicator, 6. Pneumatic pipes with connectors,
Figure 7. Test rig circuit diagram
VI. ANALYSISRESULTSANDDISCUSSION
A. Introduction:
B. Results and Discussion:
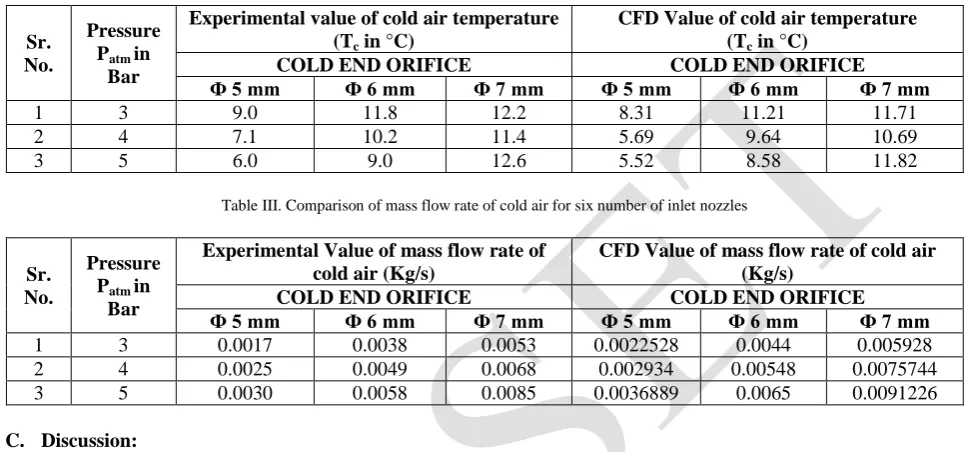
Comparison between the experimental results and CFD analysis results for the average cold air temperature and cold air mass flow rate is as shown in the Table II and III.
Table II. Comparison of cold air temperature for six number of inlet nozzles
Sr. No.
Pressure Patm in
Bar
Experimental value of cold air temperature (Tc in °C)
CFD Value of cold air temperature (Tc in °C)
COLD END ORIFICE COLD END ORIFICE
Ф 5 mm Ф 6 mm Ф 7 mm Ф 5 mm Ф 6 mm Ф 7 mm
1 3 9.0 11.8 12.2 8.31 11.21 11.71
2 4 7.1 10.2 11.4 5.69 9.64 10.69
3 5 6.0 9.0 12.6 5.52 8.58 11.82
Table III. Comparison of mass flow rate of cold air for six number of inlet nozzles
Sr. No.
Pressure Patm in
Bar
Experimental Value of mass flow rate of cold air (Kg/s)
CFD Value of mass flow rate of cold air (Kg/s)
COLD END ORIFICE COLD END ORIFICE
Ф 5 mm Ф 6 mm Ф 7 mm Ф 5 mm Ф 6 mm Ф 7 mm
1 3 0.0017 0.0038 0.0053 0.0022528 0.0044 0.005928
2 4 0.0025 0.0049 0.0068 0.002934 0.00548 0.0075744
3 5 0.0030 0.0058 0.0085 0.0036889 0.0065 0.0091226
C. Discussion:
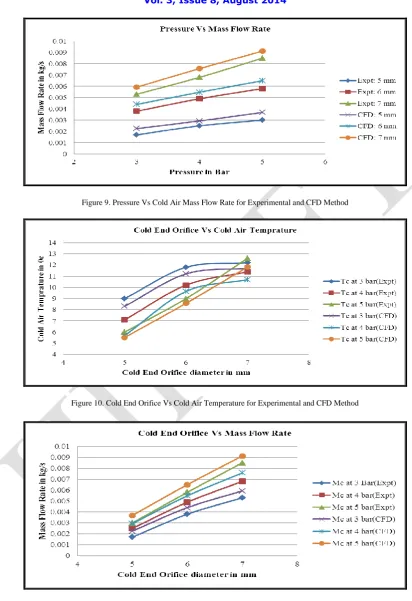
From above result it is found that there is very less difference in the values of cold air temperature and cold mass flow rate obtained from the experimental techniques and CFD analysis method. It is also shown graphically in Fig. 8, 9, 10 and 11 as follows:
DOI: 10.15680/IJIRSET.2014.0308067
Figure 9. Pressure Vs Cold Air Mass Flow Rate for Experimental and CFD Method
Figure 10. Cold End Orifice Vs Cold Air Temperature for Experimental and CFD Method
VII. CONCLUSION
The experimental and CFD work conducted shows the following results to determine the cold air temperature and the cold air mass flow rate of the vortex tube:
1. The CFD analysis is an extremely useful tool in the design and analysis of Vortex tube. 2. The CFD enables the complete view of the cold air temperature of the vortex tube.
3. The CFD analysis shows the temperature at the core region of the cold orifice as below 0° C with different combinations of inlet air pressure, inlet nozzles and cold end orifice.
4. It is found that, increasing inlet nozzle number, increasing inlet pressure and decreasing the cold air orifice diameter up to dc = 5 mm, decreases the cold air temperature at cold end of the vortex tube.
In case of cold mass flow rate, its value increases with increasing the internal diameter of cold end orifice, but have higher temperature of cold air than that of 5 mm cold end orifice.
REFERENCES
[1] Upendra Behera, P.J. Paul, S. Kasthurirengan, “CFD analysis and experimental investigations towards optimizing the parameters of Ranque– Hilsch vortex tube,” International Journal of Heat and Mass Transfer 01/2005; DOI: 10.1016/j.ijheatmasstransfer.2004.12.046.
[2] Kirmaci Volkan, “Exergy analysis and performance of a counter flow Ranque–Hilsch vortex tube having various nozzle numbers at different inlet pressures of oxygen and air,” International Journal of refrigeration, 32, 2009, pp.1626-1633.
[3] Nimbalkar S., Muller M. R., “An experimental investigation of the optimum geometry for the cold end orifice of a vortex tube,” Appl. Therm. Eng., 29, 2009, pp. 509–514.
[4] Bramo, A. R., Pourmahmoud N., “CFD simulation of length to diameter ratio effects on the energy separation in a vortex tube,” IJRRAS, 2011, pp.1-16.
[5] Chang K., Li Qing, Zhou G., Li Qiang, “Experimental Investigation of Vortex Tube Refrigerator with a Divergent Hot tube,” International Journal of Refrigeration, 34, 2011, pp.322-327.
[6] Eiamsa-ard, S., “Experimental investigation of energy separation in a counter-flow Ranque– Hilsch vortex tube with multiple inlet snail entries,” International Communications in Heat and Mass Transfer, 37, 2010, pp. 637–643.
[7] Maziar Arjomandi, Yunpeng Xue., “An investigation of the effect of the hot end plugs on the efficiency of the Ranque-Hilsch vortex tube,” Journal of Engineering Science and Technology.Vol.2, No.3, 2007, pp.211-217.
[8] Xue, Y., Arjomandi, M., “Visualization of the flow structure in a vortex tube,” Experimental Thermal and Fluid Science, 35, 2011, pp.1514-1521.
[9] Yunpeng Xue , Maziar Arjomandi., “The effect of vortex angle on the efficiency of the Ranque–Hilsch vortex tube,” Experimental Therm. Fluid Sci., 33, 2008, pp.54–57.
[10] Xue, Y., Arjomandi, M., R. Kelso, “A critical review of temperature separation in a vortex tube,” Experimental Thermal and Fluid Science, 34, 2010, pp. 1367–1374.
[11] Prabakaran, J., Vaidyanathan, S., “Effect of orifice and pressure of counter flow vortex tube,” Indian Journal of science and Technology, Vol.3 (4), 2010, pp.374-376.