Data Analysis on Social Network Media Data like
Twitter Using Sentiment Analysis
B.Jyothi D Sailaja M V Kishore
Asst.Professor Asst.Professor Asst.Professor
GITAM , Hyderabad ANITS Engineering college ANITSEngineering college
Visakhapatnam Visakhapatnam
Abstract: In the world present social networking sites are at the boom, so large amount of data is generated. Millions of people are sharing their views daily on micro blogging sites, since they contain short and simple expressions. We shall discuss about a paradigm to extract the sentiment from a famous micro blogging service, Twitter, where users tweet their opinions about different things.
In this paper, we will discuss the sentiment analysis of twitter dataset with data mining approach. An approach is introduced that automatically classifies the sentiments of Tweets taken from Twitter dataset by using different classifier algorithms. These tweets are classified as positive or negative along with the confidence. In this procedure of sentiment analysis, we will take the user input keyword and fetch the Live Twitter Data and classify them as positive and negative tweets and save them locally. The training and testing data consists of tweets which can be plain-text, acronyms and abbreviations.
INTRODUCTION: Sentiment Analysis
Sentiment Analysis is method of extracting and analyzing data of person feelings, reviews and thoughts. Sentimental analysis often called as opinion mining as it mines the important feature from people opinions. Sentimental Analysis is done by using various machine learning techniques, statistical models and Natural Language Processing (NLP) for the extraction of feature from a large data. Sentiment Analysis can be applied on phrase, sentence and document level. In phrase level, check the polarity of phrases in a sentence. In Sentence level, each sentence is classified as class to provide the sentiment. In document level, the entire document is taken and analyze whether the sentiment is positive, negative or neutral. Sentimental Analysis has different applications. It is used to produce opinions of social media users by analyzing their feelings or thoughts which they give in form of text. Sentiment Analysis is domain centred, the results of one domain cannot be applied to other domain. Sentimental Analysis is used in many real life scenarios, to get reviews about any product or movies, to get the financial report of any company, for predictions or marketing.
Twitter is a micro blogging stage where people can read or write short form of message which is called tweets. The amount of accumulated twitter data is very huge. This data is unstructured and written in natural language. Twitter Sentimental Analysis is the process of accessing tweets for a particular topic and predicts the sentiment of these tweets as positive or negative with the help of different machine learning algorithms.
1.
With the growth of web technology, there is a large volume of data present in the web, a lot of data is generated .2.
Internet has become a platform for online learning, interchange ideas and sharing opinions. Social networking sites like Twitter, Facebook, Google+ are rapidly gaining3.
popularity as they allow people to share and show their views about topics, have discussion with different communities, or post messages across the world.4.
In the field of sentiment analysis of twitter data there has been lot of work. This paper focuses mainly on sentiment analysis of twitter data which is helpful to analyse the tweets where views are highly heterogeneous, unstructured and are either positive or negative, or neutral.5.
Sentiment analysis can be described as a process that automates mining of opinions, emotions and attitudes from tweets, text, speech and database sources through Natural Language Processing .6.
Sentiment analysis involves classifying opinions in text into categories like "positive" or "negative" or "neutral". It is also referred as subjectivity analysis, opinion mining, and appraisal extraction.7.
The words opinion, sentiment, view and belief are used interchangeably but there are differences between themMETHODOLOGY:
The present proposed method targets day-to-day live streaming data so as to improve the accuracy of the sentiment about updated data. In our case, we targeted Twitter as our dataset. We take the live streaming tweets from twitter data and perform sentiment analysis.
This system takes the user input (a keyword) and fetch the live streaming twitter data. It performs the sentiment analysis on each and every tweet and generates sentiment value.
Machine learning is a technique whose task is to infer a function from labelled training samples. The training samples for supervised learning consist of large set of examples for a particular topic. In supervised learning, every example training data comes in a pair of input and output value. These algorithms analyze data and generate an output function, which is used to mapped new data sets to respective classes. Various machine learning classifiers which we are going to use to build our classifier are:
1.
Text Classification3.
MultinomialNaive-Bayes Classifier4.
BernoulliNaive-Bayes Classifier5.
Logistic Regression Classifier6.
SVC (Support Vector Classifier): LinearSVC and NuSVC7.
User Defined Classification Algorithm (Voted Classifier)TEXT CLASSIFICATION: The Bag of Words Model:
One of the salient sub-tasks in pattern classification is feature extraction and selection; the three main criteria of good features are listed below:
1. Salient. The features are important and meaningful with respect to the problem domain.
2. Invariant. Invariance is often described in context of image classification: The features are insusceptible to distortion, scaling, orientation, etc. A nice example is given by C. Yao and others in Rotation-Invariant Features for Multi-Oriented Text Detection in Natural Images.
3. Discriminatory. The selected features bear enough information to distinguish well between patterns when used to train the classifier.
Table 1: Machine Learning Algorithm
Prior to fitting the model and using machine learning algorithms for training, we need to think about how to best represent a text document as a feature vector. A commonly used model in Natural Language Processing is the so-called bag of words model. The idea behind this model really is as simple as it sounds. First comes the creation of the vocabulary — the collection of all different words that occur in the training set and each word is associated with a count of how it occurs. This vocabulary can be understood as a set of non-redundant items where the order doesn’t matter.
Tokenization
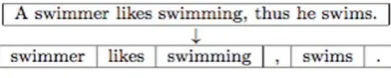
Tokenization is the process of breaking down a text corpus into individual tokens that serve as input for various natural language processing algorithms. Usually, tokenization take other optional processing steps, such as the punctuation characters, removal of stop words and lemmatizing or, stemming and the construction of n-grams. Below is an example of a simple tokenization that breaks a sentence into individual words, separates punctuation, and converts all letters to lowercase.
Table 2.Example of tokenization Stop Words
Stop words are common in a text corpus and thus considered as un-informative (e.g., words such as “the, and, so, or”). One of the stop word removal approach is to search against a language-specific stop word dictionary. An alternative approach is to prepare a list by sorting all words in the entire text corpus by frequency. The stop list after transformation into a set of non-redundant words is then used to remove all those words from the input documents that are ranked among the top n words in this stop list.
Table 3.Example of stop word removal
Naive-Bayes Classifier
It is a classification technique based on Bayes’ Theorem with an assumption of independence among predictors. In simple terms, a Naive Bayes classifier assumes that the presence of a particular feature in a class is unrelated to the presence of any other feature. For example, a fruit may be considered to be an apple if it is red, round, and about 3 inches in diameter.
Even if these features depend on each other or upon the existence of the other features, all of these properties independently contribute to the probability that this fruit is an apple and that is why it is known as ‘Naive’.
Naive Bayes model is easy to build and particularly useful for very large data sets. Along with simplicity, Naive Bayes is known to outperform even highly sophisticated classification methods.
Bayes theorem provides a way of calculating posterior probability P(c|x) from P(c), P(x) and P(x|c). Look at the equation below:
Multinomial Naive-Bayes Classifier
Naive Bayes algorithm generally used in machine learning module.It comes within Scikit_Learn module.
On testing it on a sample it gave 72% accuracy.
We introduce the multinomial naive Bayes classifier, so called because it is a Bayesian classifier that makes a simplifying (naive) assumption about how the features interact.
The intuition of the classifier is shown in Fig. We represent a text document as if it were a bag-of-words, that is, an unordered set of words with their position ignored, keeping only their frequency in the document.
In the example in the figure, instead of representing the word order in all the phrases like “I love this movie” and“I would recommend it”, we simply note that the word I occurred 5 times in theentire excerpt, the word it 6 times, the words love, recommend, and movie once, andso on.
MultinomialNB implements the naive Bayes algorithm for multinomially distributed data, and is one of the two classic naive Bayes variants used in text classification (where the data are typically represented as word vector counts, although tf-idf vectors are also known to work well in practice).
The distribution is parametrized by vectors for each class, where is the number of features (in text classification, the size of the vocabulary) and is the probability of feature appearing in a sample belonging to class.
The parameter is estimated by a smoothed version of maximum likelihood, i.e. relative frequency counting: It is simply an advanced version of Naïve-Bayes algorithm. It is based on the following formula.
where is the number of times feature appears in a sample of class’ y’ in the training set T , and
is the total count of all features for class ‘y’.
The smoothing priors accounts for features not present in the learning samples and prevents zero probabilities in further computations. Setting is called Laplace smoothing, while is called Lidstone smoothing.
Bernoulli Naive-Bayes Classifier
BernoulliNB implements the naive Bayes training and classification algorithms for data that is distributed according to multivariate Bernoulli distributions; i.e., there
may be multiple features but each one is assumed to be a binary-valued (Bernoulli, boolean) variable. Therefore, this class requires samples to be represented as binary-valued feature vectors; if handed any other kind of data, a BernoulliNB instance may binarize its input (depending on the binarize parameter).It comes with Scikit_Learn module.
On testing it on a sample it gave 70% accuracy
The decision rule for Bernoulli naive Bayes is based onwhich differs from multinomial NB’s rule in that it explicitly penalizes the non-occurrence of a feature that is an indicator for class , where the multinomial variant would simply ignore a non-occurring feature.
In the case of text classification, word occurrence vectors (rather than word count vectors) may be used to train and use this classifier. BernoulliNB might perform better on some datasets, especially those with shorter documents.
5Logistic Regression Classifier
In the multiclass case, the training algorithm uses the one-vs-rest (OvR) scheme if the ‘multi_class’ option is set to ‘ovr’, and uses the cross- entropy loss if the ‘multi_class’ option is set to ‘multinomial’. It can be given with many customizable parameters, but we are using default parameters in our case.
It comes within Scikit_Learn Linear-model module. On testing it on a sample it gave 71% accuracy. LinearSVC Classifier Algorithm
Linear Support Vector Classification.Similar to SVC with parameter kernel=’linear’, but implemented in terms of liblinear rather than libsvm, so it has more flexibility in the choice of penalties and loss functions and should scale better to large numbers of samples.This class supports both dense and sparse input and the multiclass support is handled according to a one-vs-the-rest scheme.
Default parameters are used.
It comes within Scikit_Learn SVM module. On testing it on a sample it gave 69% accuracy.
2NuSVC Classifier Algorithm
On testing it on a sample it gave 73% accuracy.
Advantages
1. It works really well with clear margin of separation 2. It is effective in high dimensional spaces.
3. It is effective in cases where number of dimensions is greater than the number of samples.
4. It uses a subset of training points in the decision function (called support vectors), so it is also memory efficient.
Disadvantages
1. It doesn’t perform well, when we have large data set because the required training time is higher.
2. It also doesn’t perform very well, when the data set has more noise i.e. target classes are overlapping
3. SVM doesn’t directly provide probability estimates, these are calculated using an expensive five-fold cross-validation. It is related SVC method of Python scikit-learn library.
7User Defined Classification Algorithm (Voted Classifier)
This classifier is used to improve the accuracy of the classifications. What it basically does is, it takes all the accuracies of the above mentioned 5 pre-defined classifiers as input and constructs a voting system . Basic on this voting system, it’s accuracy is calculated. So that we get accurate classifications.A voted_classifier class is defined to calculate the accuracy of this classifier.
This Class is Inherited from nltk.classify module.
Procedure of voting system:
1. Suppose take a word called “bad”. If all the 5 algorithms vote the word as negative word then the accuracy of the voted classifier will be 5/5 = 1 i.e. 100% accurate.
2. If we get a score of 3/5 the possibly its accuracy will be 60% accurate.
3. Similarly we get 20%, 40% and 80% accuracies. 4. However the words with accuracy below and equal to
80% are eliminated in the process.
5. This voted classifier is trained on 1900 random words and tested on 100 random words initially.
6. Size of the samples are varied every time we train the system.
7. More the system is trained the better is the accuracy. 8. Various training samples are changed during the
training process.
9. Initially the system is trained on movie reviews offline data set.
10. This data set contains 10000 positive and 10000 negative sentences.
11. This classifier is trained on this data set for better accuracy.
12. Then it is further trained on offline twitter tweets data set.
13. Once this is done, it is applied for the Analysis on of LIVE TWEETS on TWITTER .
DATA ANALYSIS:
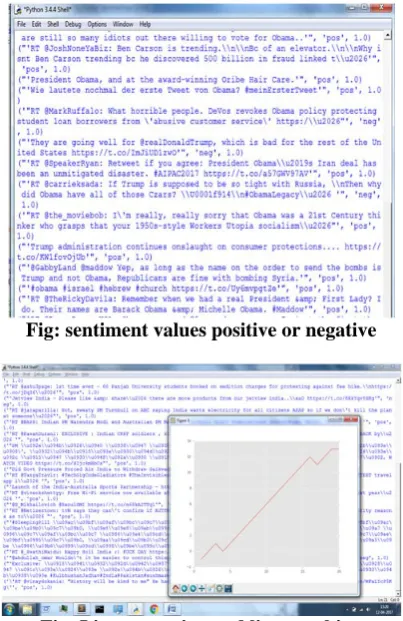
We are implemented our methodology in pHython language.the result analysis is place below.
Fig : live streaming of tweets and analyzing them
Fig: sentiment values positive or negative
CONCLUSION
We conclude by saying that, our work can be used by any company or industry to conduct a survey about their products so as to determine the statistics of their business. Customer analysis can be done to improvise their business.Can be applicable to movie Review-related websites such as movie reviews, product reviews etc.Individual user can also use it to know the sentiment about a particular product, topic or politics.The usage of latest and updated NLTK classifiers improve our accuracy and more over we improve the training set to get more accurate results.
FUTURE SCOPE
We look forward to use bigger dataset to improve the accuracy. Consider emoticons, expressions and internet slangs in our training data, classify tweets as neutral tweets along with positive and negative tweets.
REFERENCES:
IEEE reference paper “Sentiment analysis of Twitter - April 2016” by Vishal A. Kharde and S.S. Sonawane.