Conventional Optimization and Simulation
Methods for Optimal Location and Size of DG
in Distribution System: IEEE 6-Bus Network
Sampath Kumar Bodapatla1, Dr.H.P.Inamdar2
Asst. Professor, Dept. of Electrical Engineering, Fabtech College of Engineering & Researcch, Sangola (MH) India. 1
Professor and Ex-HOD, Dept. of Electrical Engineering, Walchand College of Engineering, Sangli (MH), India2
ABSTRACT: In developing countries such as India, transmission and distribution losses are the highest among the developing countries,.i.e 23% of the electricity generated. As per studies carried out by independent agencies including TERI, these losses have been estimated to be as high as 50% in some states like UP, Bihar and other states in India. Energy losses occur in the process of supplying electricity to consumers due to technical losses and commercial losses. It has been a growing interest in connecting generations directly to the distribution system, known as Distribution Generation (DG) or Distributed Energy Resources (DER).In most cases, distribution network operators have no control over DG location and size ,however interconnection of DG alters the distribution network operation, these factors drew the attention of distribution network operators for the decision making about the optimal /proper location and size of the DG. The main contribution of the paper is to find the optimal locations of DG units and sizes in distributed network by using conventional optimization and simulation methods.
KEYWORDS: Distributed Generation, Optimal location and size, Distribution network, Power loss.
I.INTRODUCTION
In developing countries such as India and some other countries, the pre-reform scenario is characterized by state owned power utilities with a vertically integrated and monopolised business comprising generation, transmission, distribution and consumer services. Such a monopoly has shown suffer severe technical and nontechnical losses. The technical losses are due to energy dissipated in the conductors and equipments used for distribution of power. These technical losses are inherent in a system and can be reduced to an optimum level. Although analysis of the existing arrangement of electrical power transmission, distribution and utilization reveals various factors, which are contributing for the system losses. The distribution system is an important part in an electrical network. The capital investment in the distribution system constitutes a significant portion of the total amount spent in the entire power system. Further, since the voltage levels, the losses are usually higher compared to those in other parts of the power system. Thus, the distribution system rates high in economic importance of late ,optimal distribution system planning has gained considerable importance, but in all these attempts, significant problem of optimal location and size of DG still needs to be studied and this will result in substantial reduction in power losses and considerable improvement in the voltage profile.
II. DISTRIBUTED GENERATION
of size, DG may range from few KWs to over 100 MWs.The general definition for distributed generation suggested by the authors ‘Thomas Ackermann, Goran Anderson and Lennart Soder’[1] as “Distributed generation is an electric power source connected directly to the distribution network or on the customer site of the meter”.
III. LITERATURE REVIEW
The Distributed Generation (DG) sources are normally placed close to consumption centers and are added mostly at the distribution level. They are relatively small in size (and modular in structure. Many approaches have been proposed to solve distributed generators placement in distribution systems. There are many methods of loss reduction techniques used like feeder reconfiguration, capacitor placement, high voltage distribution system, conductor grading, and DG unit placement. The analytical methods are presented to deduce a mathematical expression that can be used to determine the appropriate location and/or sizing of DG with a specific purpose. However, their results are only indicative, because obtaining analytical expressions requires the use of presumptions that fail to consider the network’s real complexity. The most common objectives in the location of DG is to reduce losses and improve the voltage profile. For this purpose, a voltage profile index relating voltage with and without DG is used [2,3] and analytical expressions that allow the determination of the limit of the power that can be injected into a node in the network without incurring in overpowering[ 4] and also analytical approach has been tested on IEEE 15 bus and 34 bus of radial distribution systems to identify the optimal placement and optimum sizing of distributed generation[ 5].
The various intelligent search based methods may include genetic algorithm, artificial bee colony algorithm, tabu search algorithm ,particle swarm optimization, Big Bang Big Crunch method and differential evaluation are proposed to the power system to solve optimization problem for optimal location and size of distributed generation in distribution systems for power loss reduction and voltage profile improvement and also adapted for static system planning of distribution system expansion considering possible reinforcement s or commissioning of new feeders and substations. A genetic algorithm[ 6] as a technique to solve an optimal DG placement problem that considers variable power concentrated load models, distributed loads and constant power concentrated loads and Artificial bee colony algorithm (ABC) is proposed to find the DG optimal size and location by using Loss Sensitivity Index (LSI) in order to minimize the total system real power loss.
Tabu Search (TS) method is used to solve the ODGP problem in the case of uniformly distributed loads [7] and simultaneously solves ODGP and optimal placement of reactive power sources. A model to determine the optimal location and size for dispersed generation using indexes in the objective function for Particle Swarm Optimization algorithm[ 8] and it is applied on the IEEE 33-bus and 69-bus system and Big Bang Big Crunch optimization algorithm [9] on balanced/unbalanced distribution networks for optimal placement and sizing of distributed generators. The algorithm deals with the optimization problems incorporating voltage controlled distributed generators for the sake of power loss minimization.
The main objectives of this paper that, to focus for the Optimal Placement of Distributed Generation (DG) source on a networked system by using conventional optimization methods with analytical method, power flow program method and simulation methods. The above methods are applied to obtain the power loss for a test system IEEE 6-bus network. The minimization of power loss reduction method is used to obtain optimal bus-location, optimal DG size and overall optimal bus location and optimal size.
IV.CONVENTIONAL OPTIMIZATION AND SIMULATION METHODS
A).Analytical methods:
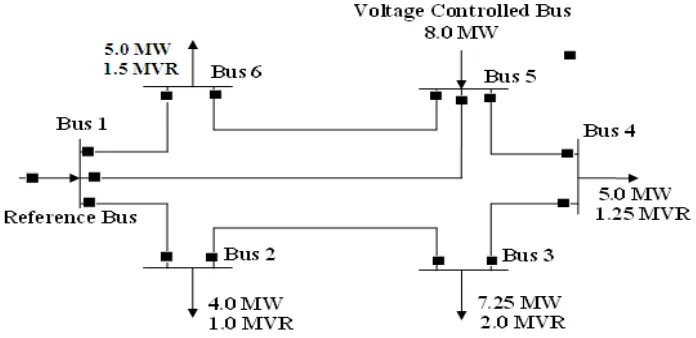
Fig.1. A networked power system
Consider the system shown in Fig.1, with DG added to the system to reinforce it. The system has ‘N’ buses and loads, and the DG is located at a bus, say bus .The main external power is injected into bus 1, which is taken as slack bus. The objective is to find the bus to install the DG so that the total system power loss is minimized and the voltage level at each bus is held in the acceptable range, 1± 0.05p.u
The goal is to find the optimal bus ‘ ’where power loss function reaches its minimum value.
= , = 1,2 … . .
Though the methodology here is under the assumption that only one DG source is added to the system, it can be easily extended to the systems with multiple DG sources. By connecting all the DG buses and slack bus together through imaginary lines, the new matrix and the corresponding power loss function can be established by the method presented above.
B). Power Flow Program method:
Several power program programs have been developed for the power flow solution of practical networked power systems.The method of solution consists of programs,lfybus, busout, and lineflow are designed to be used with two more power flow programs[11].
lfbus -This program requires the line and transformer parameters and transformer tap settings specified in the input file named linedata. It converts impedances to admittances and obtains the bus admittance matrix.This program obtains the power flow solution by the methods and requires the files named ‘busdata’ and ‘linedata’. It is designed for the direct use of load and generation in MW and Mvar, bus voltages in per unit, and angle in degrees.
busout -This program produces the bus output result in tabulated form, the bus output result includes the voltage magnitude and angle, real and reactive power of generators and loads, and the shunt capacitor /reactor Mvar.
lineflow- This program prepares the line output data. It is designed to display the active and reactive power flow entering the line terminal and line losses as well as the net power at each bus. Also included are the total real and reactive losses in the system.
busdata- The format for the bus entry is chosen to facilitate the required data for each bus in single row. The information required must be included in matrix called busdata. Column 1 is the bus number .Column 2 contains the bus code .Columns 3 and 4 are voltage magnitude in per unit and phase angle in degrees. Columns 5 and 6 are load MW and Mvar. Columns 7 through 10 are MW, Mvar, minimum Mvar and maximum Mvar of generation, in that order. The last column is the injected Mvar of shunt capacitors. The bus code entered in column 2 is used for identifying load; voltage controlled, and slack buses as out lined below:
1 -This code is used for the slack bus 0 - This code is used for the Load buses
2 - This code is used for the Voltage controlled buses
C). Simulation method:
The interconnected network with DG is constructed and simulated using MATLAB/SIMULINK. The various parameters, voltages, loads are set by connecting DG at each bus location and the power losses are obtained using the simulation approach. The simulated diagram of networked system consists of six buses and six DG sources corresponding buses respectively. In these, out of six buses one bus is slack bus, four load buses and one voltage controlled bus. Six DG sources are connected to system buses through circuit breakers. Here only one DG sources acting at a time and remaining are opened. These sizes of DG sources added individually into the network at bus locations through bus no.1 to bus no.6 and tabulated the total power losses on the system.
V.CASE STUDY -1: IEEE 6 –BUS NETWORKED POWER SYSTEM
The optimal location of a distributed generator (DG) will be determined for the test system in Fig. 1(IEEE 6-bus test system), based on the power losses. The distributed generator (DG) optimal location will determined considering the power losses at each load bus where the DG is connected. The power losses at each load bus will be determined by using the conventional optimization approaches like analytical approach, power flow program method, using the power flow program and simulation using MATLAB/SIMULINK.
Fig. 2.Six-bus networked power system
VI. RESULTS AND DISCUSSIONS
A) Analytical method: The values of the power loss function for the system are obtained by applying the analytical approach when the DG is placed at different buses. These values of power loss functions are presented and shown in the bar chart of Fig.3.
Fig.3.Objective functions of the six bus networked system at different bus locations
It is noted from this figure that the power loss function is at its minimum when the DG is placed at bus location no.3, as compared to the remaining power loss functions from bus no.2 to the bus no.6 on networked system. This minimum loss location is known as optimal location. The bus no.3 is the optimal location to place DG for loss maximum power loss reduction.
B) Power flow program method: The six- bus networked system parameters bus data and line data are given. By using power flow program analysis for power losses can be obtained on a six bus networked system having different sizes of Distributed Generation (DG) sources at different bus locations from bus no.1 through bus no.6. The results of power losses are shows that Power losses on the six- bus networked with different sizes of DG at different bus locations and Fig.6.6 shows the Power losses on the six- bus networked with size of DGs 5MW at different bus locations.
2 3 4 5 6
0 5 10 15 20 25 30 35 40
DG Location-Bus No.
V
a
lu
e
o
f
o
b
je
c
ti
v
e
f
u
n
c
ti
o
C) Simulation method: The simulation results of six buses networked at different DG sizes are considered 2.5 MW, 5 MW, 7.5 MW, 10 MW and 15MW.By using simulated network power losses can be obtained the system having different sizes of Distributed Generation (DG) sources at different bus locations from bus no.1 through bus no.6 and as shown in Fig.6. The power losses on the six- bus networked with size of DGs 5MW at different bus locations as shown in Fig.7.
From above all methods, it shows that the power losses are minimum at bus no.3 on six-bus network by placing different sizes of DG from bus no.1 bus no.6, here bus no.3 is the optimal location to place DG for loss maximum power loss reduction and also 5MW is the optimal DG size to minimize the maximum amount of power loss by placing at bus no.3.
VII.CONCLUSION
Optimal location and size of Distribution Generation (DG) at the existing distribution system network is crucial factors in the planning and operation of active distribution networks in order to minimize the power loss and to improve the voltage profile. Simulation methods is carried out to verify the results obtained conventional optimization methods with analytical method and power flow program method on a IEEE 6-bus distribution nerworked system. Also, results show that locations, sizes and power factor of distributed generators are crucial factors in reducing losses and enhancing system voltage. In practice, there are other constraints which may affect the DG placement. Nevertheless, methodologies presented in this paper can be effective, instructive, and helpful to system designers in selecting proper sites to place DGs.
REFERENCES
[ 1 ]. G. Pepermansa, J.Driesenb, D. Haeseldonckxc, R. Belmansc, W. D’haeseleerc “Distributed generation: definition, benefits and
issues”, Energy Policy 33 (2005) ,pp.787– 798.
[ 2 ]. Wang C. and Nehrir M. “Analytical approaches for optimal placement of distributed generation sources in power systems”, Power
Engineering Society General Meeting, IEEE, San Francisco, CAUSA,pp.1-6, July, 2005.
[ 3 ]. Khan H. y Choundhry M.A. “Implementation of Distributed Generation (IDG) algorithm for performance enhancement of distribution feeder
under extreme load growth”., International Journal of Electrical Power & Energy Systems., Vol.32, pp.985-997,2010.
[ 4 ]. Conti, S., Raiti, S. y Tina, G. “Small-scale embedded generation effect on voltage profile: an analytical method”, IET Generation, Transmission and Distribution, vol.150, pp.78-86, 2003.
[ 5 ]. M.Jegadeesan, V.Keerthana “Optimal Sizing and Placement of Distributed Generation in Radial Distribution Feeder Using Analytical
Approach”,International Conference on Innovations in Engineering and Technology (ICIET’14) Volume 3, Special Issue 3, March 2014.
[ 7 ]. K. Nara, Y. Hayashi, K. Ikeda, and T. Ashizawa,“Application of tabu search to optimal placement of distributed generators,” in Proc. IEEE Power Eng. Soc. Winter Meeting, Jan. 2001, pp. 918–923.
[ 8 ]. Kamran Yousefpour “Placement of Dispersed Generation with the Purpose of Losses Reduction and Voltage Profile Improvement in
Distribution Networks Using Particle Swarm Optimization Algorithm”, Journal of World’s Electrical Engineering and Technology J. World. Elect. Eng. Tech. 3(3), pp.118-122, 2014.
[ 9 ]. Y.G.Hegazy, M.M.Othman, Walid El-Khattam and A.Y.Abdelaziz “Optimal sizing and siting of distributed generators using Big Bang Big
Crunch method”, IEEE trans. 978-1-4799-6557-1/14, 2014.
[ 10 ]. S.F. Mekhamera, S. A. Solimanb, M. A. Mostafa and El-Hawary, “ Load Flow Solution of Radial Distribution Feeders: A New Approach”
Paper accepted for presentation at PPT 2000-2001 IEEE Porto Power Tech Conference10 -13th September, Porto, Portugal.,2001.
[ 11 ]. Hadi Saadat, a Text Book of “Power System Analysis”. Tata mc., Graw-Hill. 1999.
BIOGRAPHY
H. P. Inamdar, earned his B.Sc., from University of Pune, Pune, India. The author, obtained B.E. (Electrical Engineering) in 1964, B. E. (Mechanical Engineering) in 1965, and M.E. (Electrical Engineering) in 1975 from Shivaji University, Kolhapur, Maharashtra, India. The author received Ph. D. (High Voltage Engineering) in 1986 from Indian Institute of Science, Bangalore, India. His employment experience included as a retired Professor and ex-HOD of electrical engineering department at Walchand College of Engineering, Sangli, India. He has done extensive research in the various fields of electrical engineering such as high voltage engineering, power system engineering, and biomedical engineering etc., He has published and presented more than ‘100’ research papers in various national and international ‘journals and conferences.’ He also, authored number of text books in electrical engineering subjects such as electrical power system, fundamentals of electrical engineering etc. His previous and current field of interest included high voltage engineering and application of artificial intelligence (AI) based techniques in the domain of electrical and biomedical engineering. He has guided a number of students for ‘Ph. D.’ degree course and worked for various research review committees and national board of accreditation, academic review committees for Shivaji University, Kolhapur.
Sampath Kumar Bodapatla is received the B.Tech degree with the Electrical and Electronics Engineering from Vidya Bharathi Institute of Technology (JNTU Hyderabad),Warangal, Telangana in 2007 and M.Tech degree in Electrical-Power Systems from department of Electrical Engineering, Walchand College of Engineering(An Autonomous Institute),Sangli, Maharashtra, India in 2009.