Improved Clustering Approach for high Dimensional
Citrus Image data
Dr. M. Lavanya
Department of Master of Computer Applications, Sree Vidyanikethan Engineering College A.Rangampeta, Tirupati, INDIA
ABSTRACT- Citrus industry contributes a major part in nation’s growth, but there has been a decrease in production of good quality citrus fruits, due to improper cultivation, lack of maintenance, very high post harvest losses in handling and processing, manual inspection, lack of knowledge of preservation and quick quality evaluation techniques. Unrelated features, along with repetitive features, severely affect the accuracy of the learning machines. So, feature subset collection should be able to identify and remove as much of the irrelevant and redundant information as possible. A feature selection algorithm may be evaluated from both the efficiency and effectiveness. The efficiency relates to the time spend to find only relevant features from collection, the effectiveness concerns to the quality of the required features. Based on these conditions, an improved clustering-based feature selection algorithm is experimented. The improved/efficient clustering methods are implemented in two stages. In the first stage, features are divided into clusters by using graph-theoretic clustering algorithms. In the second stage, the important feature that is strongly related to target classes is selected from each cluster to form a subset of features. The efficiency of the effective clustering algorithm are evaluated through an empirical study. The specific objectives implemented to accomplish is: collect images from citrus leaves of three common citrus diseases, and normal leaves; determine color co-occurrence method texture features for each image in the dataset; Apply effective Clustering and Classification to retrieve feature data models. In this paper, determine the effective clustering/ classification accuracies using a performance measure for feature extraction in citrus fruits and leaves.
Keywords: Improved clustering approach; citrus data; feature extraction.
I. INTRODUCTION
This paper works on the application of the mutual information criterion to evaluate a set of candidate features and to select an informative subset to be used as input data for a neural network classifier. As most of the mutual information measures arbitrary dependencies between random variables, it is suitable for assessing the “information content” of features in complex classification tasks, for methods rely on correlation are prone to errors. The verity that the mutual information is independent of the coordinates chosen permits a accurate estimation. But, mutual information used for tasks characterized by high input dimensionality requires suitable approximations because of the prohibitive demands on calculation and randomly selecting samples. An algorithm is proposed that is based on a “greedy” selection of the features and that takes both the mutual information with respect to the output class and with respect to the already-selected features in to account. Finally the results of a series of experiments are
discussed. During the development of neural net classifiers the “preprocessing” stage, where an appropriate number of relevant features is extracted from the raw data, has a crucial impact both on the complexity of the learning phase and on the achievable generalization performance. While it is essential that the information contained in the input vector is sufficient to determine the output class, many input features are presented which is burden to the training process and can produce a neural network with more connection weights that those required by the problem. From an application-oriented point of view, an excessive input dimensionality implies lengthened preprocessing and recognition times, even if the learning and recognition performance is satisfactory.
The efficiency and effectiveness of the effective clustering algorithm are evaluated through feature subset selection methods they are:
A) Embedded Method: The embedded methods incorporate feature selection as a part of the training process and are usually specific to a given learning algorithm, and therefore may be more efficient than the other categories are Decision Trees or Artificial Neural Networks which are traditional machine learning algorithms of embedded approach.
B) Wrapper Method: The wrapper method uses the predictive accuracy of predetermined learning algorithm to determine the goodness of the selected subsets. The accuracy of the learning algorithm is generally more. But the selected features which is common is limited and the computational complexity is large.
C) Filter Method: The filter methods are independent of learning algorithm, with good generality. Their computational complexity is low, but the accuracy of learning algorithm is not guaranteed.
D) Hybrid Method: Combination of filter and wrapper methods are called as Hybrid methods. The search space can be deducted by filter method can be used in subsequent wrapper. The performance can be achieved by merging both filter and wrapper methods. Time complexity of the filter methods is similar to one of the traditional learning algorithm. Tend to over fit on small training sets as well computationally expensive in wrapper approach. Right choice is to implement filter methods when the number of features is more added to commonality. Based on the above all the methods to extract the features using Citrus leaf Image.
Researchers have adopted distributional clustering of words of text data to minimize the dimensionality. Many applications uses graph theoretic methods which have been well studied in analysis of clusters. The outcome of the cluster analysis is sometimes the best when compared to human performance. The graph theoretic clustering is simple to compute instances in a neighborhood graph and in that graph that is much longer/shorter than its neighbors the edge can be deleted. The result is a citrus features and each feature in the image of citrus leaf identifies as cluster. In our study to extract feature we adopt graph-theoretic methods. Especially, we make use of Minimum Spanning Tree (MST) based clustering algorithm because they do not assume the data points are grouped around centers or separated by a regular geometric curve and have been widely used practice.
II. RELATED WORK
In this paper we consider the use of the mutual information (MI for short) to evaluate the “information content” of each individual feature with regard to the output class. The approximated evaluation of the mutual information of each candidate feature is the starting component of a “pruning” algorithm that selects a subset of relevant features from an initial set of available features. In addition to their practical use for limiting the input dimensionality, the analysis based on the mutual information provides the developer with a useful diagnosis of the relevance of different features and of the mutual dependencies. Different feature selection methods have been analyzed in the past. For example, in the irrelevant features are eliminated as a consequence of a pruning of the weights that considers the sensitivity of the global error function E to the presence or absence of the different synapses. The sensitivity is estimated by integrating the partial derivatives dE/dw on the path in weight space traced during the learning process. Our method, while producing similar results in test cases which is used before learning starts and therefore it does not depend on the learning process. Other methodologies are based on linear transformations of the input vector. In the KL transformation is applied so that the transformed coordinates can be arranged in order of their “significance,” contemplate first the components corresponding to the major eigenvectors of the correlation matrix. In different feature evaluation methods are compared.
As a first step, in this paper, we present investigations in feature subset selection methods for reducing the relatively large input space produced by the moment methods. However, given the large number of features produced by image processing methods, it is important to reduce the feature subset size, without losing information, Classification of Citrus leaf images based on image features (or moments) is constrained by the relatively large input space where image features are retrieved by moment methods, thus prompting the need to applying feature selection methods to select a feature subset that offers optimal classification accuracy for classifying Citrus leaf images of normal and diseased leaves. As shown in the figure 1 representation of Generalization model for diseased citrus leaves classification.
FRUIT industry contributes a major role in development of nation as there is tremendous decrease in production of good quality fruits, due to improper cultivation, lack of maintenance, very high post harvest losses in handling and computing, manual examination, deficient in knowledge of preservation and quick quality evaluation approaches. As well as there is an increase in labour cost, lack of skilled workers, and the necessity to enhance production processes have all put pressure on producers and processors for the demand of a rapid, economic, consistent and non-destructive inspection method[1] [2]. Automation can reduce the costs by promoting production efficiency in such a scenario.
Fig.1. Generalization model for diseased citrus leaves classification
algorithms is used but unable to handle repeated features [4], [5], [6], [7], [8], [9], still some of approaches can remove the unwanted considering repeated features [10], [11], [12], [13]. Our proposed Improved Clustering algorithm falls into the second category.
To retriew features on spectral data, hierarchical clustering can be used. A hybrid filter/wrapper feature subset selection algorithm for regression is identified by Van Dijck and Van Hulle [15]. As well Krier et al. [14] proposed a methodology for combining hierarchical constrained clustering of spectral variables and selection of clusters by mutual information. Van Dijck and Van Hulle [15] methods are similar to feature clustering method the later forces every cluster to contain consecutive features only. Agglomerative hierarchical clustering can be used to remove redundant features for both methods adopted. We propose an Improved Clustering algorithm uses minimum spanning tree-based method to cluster features which is different from hierarchical clustering-based algorithms. By a regular geometric curve grouped around centers or separated from the datapoints which are not considered. In addition, our proposed Improved Clustering does not restrict to some specific types of data but for all types of data.
III. OBJECTIVE
The objective of this paper is to present a wrapper based approach for detecting citrus disease. This preliminary phase developed image feature extraction method for disease images acquired. Future research will seek to extend these techniques to the field. The specific objectives implemented to accomplish this were:
Collect images from citrus leaves of common citrus diseases, and normal leaves;
Determine color co-occurrence method texture features for each image in the dataset;
Create a set of reduced subset features by improved clustering approach.
IV. MATERIALS AND METHODS
A. Citrus Leaf Image Acquisition
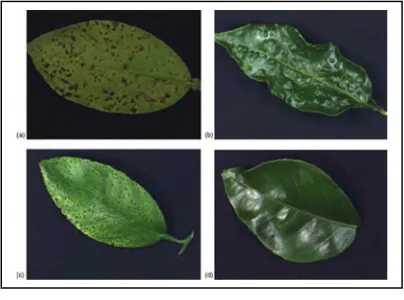
For developing a citrus fruit recognition algorithm, an analog camera is used (model: FCB-EX780S, Sony) with 640 x 480 pixels, images were captured in stationary mode. A total of 300 images were taken during the end of the citrus harvesting season over week days during the last fortnight of December, 2014 and the first fortnight of January, 2015. In natural outdoor lighting condition, capture images were considered. Before acquiring images, Brightness and shutter speed were adjusted for each plot. Shutter speed was varied in a range of 1/1000 to 1/17 sec while acquiring images [16]. During bright daylight condition, higher shutter speeds were required and at late afternoon we obtain good images which lower shutter speeds were important with approximately unvarying brightness. The leaf samples used in this paper were collected from two citrus groves near Sri Venkateswara University Citrus Research Institute located in Tirupati, during summer and fall of 2014. Leaves were designated for these studies are classified into four categories/classes. The
leaf sample conditions are normal, sebaceous characteristic, melanose and scab. Each of the cardinal classes were collected from Forty samples. Apiece aggregation were divided into two close sets from 40 images, 25 samples for upbringing and 15 samples for testing, Both the preparation and testing phases to secure that were representative of the accumulation of pathologic of the folio were captured using digital microscope system. Retrieved an uncompressed JPEG format from the digital colour images as shown in Figure 2.
Fig. 2. The different classes of leaf images are given.
The visual symptom observed varied between leaf samples. Leaf samples were from trees with petioles intact and then sealed in Ziploc® bags to maintain the moisture level of the leaves. Sixty samples of each of the eight classes of leaves were collected. The samples were brought to a laboratory. The leaf samples were then sealed in new bags with appropriate labels and put in environmental control chambers maintained at 4 ºC. After retaining for two hours in cold storage, these samples are taken out before imaging to allow them to reach room temperature. The leaf samples were then taken to an imaging station where images of the upper side of the leaf were acquired.
B. Color Image Acquisition
Fig.3. Digital microscope system for extracting diseased color images from citrus leaves taken as samples.
V. TEXTURE ANALYSIS
A. Color Co-occurrence Matrix Methodology
For the study, the image analysis technique was selected is CCM method. Over the traditional gray-scale representation, the visible light spectrum uses color image features provides additional image characteristic features The three primary mathematical processes of the CCM procedure are listed as follows.
The RGB images of leaves were converted to a hue, saturation and intensity (HSI) color space representation.
Intensity was calculated using the mean value of the three RGB values.
Using International Commission on Illumination’s (CIE) chromaticity diagram (Ohta, 1985) geometrical transformation is calculated for the values of hue and saturation.
The chromaticity diagram indicates a two-dimensional hue and saturation space. To determine the chromaticity coordinates on the hue and saturation space values of pixel RGB is used, which are then used calculate the value of hue and saturation geometrically. To generate a color co-occurrence matrix use pixel map after the HSI image was completed, resulting in three CCM matrices. Thus, CCM matrix maps for each of the HSI pixel. The use of spatial gray-level dependence matrices (SGDM’s), the color co-occurrence texture analysis method was functional. In a statistical way to describe shape by statistically sampling the way certain gray-levels occur in relation to other gray-level, gray level co-occurrence methodology is prescribed. Shear and Homes (1990) explained that these matrices measure the probability that a pixel at one particular gray level will occur at a distinct distance and orientation from any pixel given that pixel has a second particular gray level. A matrix P(i,j) counts the number of times a pixel with grey-level i occurs at position p from a pixel with grey level j for gray level. Normalization of the matrix P by the total number of pixels calculates values between 0 and 1, resulting in a gray-level co-occurrence matrix.
The SGDMs are represented by the P(i,j,d,θ) where i indicates the gray-level of location (x,y) in the image I(x,y), and j indicates the gray-level of the pixel at a distance d and an orientation angle of θ from location (x,y). The nearest
neighbor mask is shown in figure 4, where the reference pixel (x, y) is shown with ‘T’. All eight neighbors shown are one pixel
Fig.4. Computing spatial gray-level dependence matrices (SGDM’s) using nearest neighbor mask.
B. Image Analysis using HSI Color Model
The most important properties that humans use to discriminate between objects and to encode functionality is colour. Leaf is green, citrus fruit is orange, and milk is white are some examples. Through the interaction of light waves with electrons in the object matter outcome is its colour (Nassau, 1980). The color that has been recognized by human beings in case of an object is based on the nature of the light reflected from the object surface. Consider, a red apple reflects light from wavelengths centred around 700 nm ranges, while absorbing most of the energy at other wavelengths. An object that reflects light in the visible spectrum on whole has same color as white in color. The purpose of a color model is to define a standard specification for specifying color in some generally accepted way. For instance, the red, green, and blue (RGB) color model is used in hardware applications like PC monitors, cameras and scanners; the cyan, magenta and yellow (CMY) color model is used in color printers; and the luminance, in-phase and quadrature (YIQ) model is used in television broadcasts. The most commonly used color models for image processing are RGB and HSI models.
The image analysis technique used for this method was the color co-occurrence matrix (CCM) method. The method had the ability to discriminate between multiple canopy species and was insensitive to leaf scale and orientation. The purpose and usage of color features in the visible spectrum of light provides additional image characteristic features over traditional gray-scale representation. The CCM method involved three major mathematical processes:
a) Conversion of an RGB color symbolization of an image to an equivalent HSI color symbolization.
b) Creation of color co-occurrence matrices from the HSI pixels.
c) Creation of texture features from the CCM matrices.
identify combinations of CCM texture feature variables, which have the highest classification accuracy with the least number of texture variables (Burks et al., 2000). A Categorize classifier was trained to identify weeds using the models generated. The research perspectives are based on field based detection. Particularly objectives implemented to accomplish the required source to identify the diseased leaf were to: 1) make use of a digital color microscope system to collect RGB images from citrus leaves 2) Extract image texture features based on the color co-occurrence method (CCM). 3) Identify a set of reduced feature data models through improved Clustering approach and classify different citrus leaf conditions. 4) Compare the classification accuracies.
Intend of choosing a subset of good features with respect to the outcome concepts to be generated, feature subset selection is an effective way for reducing dimensionality, removing unwanted data, increasing learning correctness, and improving result comprehensibility [18], [19]. Many feature subset selection methods have been proposed and studied for machine learning methods. Four classification methods are as follows: the Embedded, Wrapper, Filter, and Hybrid methods. The filter feature selection method with respect to the application of cluster analysis has been implemented to be more effective than traditional feature selection algorithms. Some of the researchers adopted the distributional clustering of words to reduce the dimensionality of text data [20], [21],[22]. We propose a Improved Clustering for feature Selection algorithm. The Improved Clustering algorithm works in two phases. In the first Phase, features are divided into clusters by using graph-theoretic clustering methods. In the second phase, the most representative feature that is strongly related to target classes is selected from each cluster to form the final subset of features. From different clusters obtained the features are relatively independent; Improved Clustering has a high probability of producing a subset of important and independent features by this clustering based strategy. The proposed feature subset selection algorithm Improved Clustering was tested upon 20 diseased citrus image that are available.
VI. FEATURES EXTRACTION
Many images of citrus leaves are taken on the top surface for each leaf class and centred on the mid. Citrus digital images were stored in uncompressed JPEG format. The citrus diseased leaves from each class were divided into two datasets consisting of 40 samples for training and 40 samples for testing. Citrus diseased leaf images were first arranged in ascending order for the time the when images were taken. The proposed approach minimizes negative based on time factor variability, and deduce potential for data selection bias between the training and test datasets.
A. Feature Subset Selection Algorithm
Unwanted features, along with repeated features, affect the correctness of the learning machines [23], [24]. Thereby, feature subset selection should be able to identify and remove as much of the unwanted and repeated data. Almost,
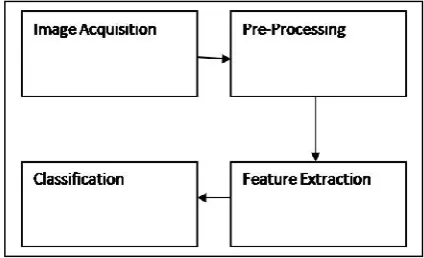
“good feature subsets contain features highly correlated with (predictive of) the class, yet uncorrelated with (not predictive of) each other.” [25] Conforming this, we propose an Improved Clustering algorithm which can efficiently and effectively deal with both unwanted and repeated data. The proposed improved clustering approach for new feature selection framework (shown in Fig. 5) that comprises of the connected components of unwanted feature removal and repeated feature elimination. In the framework firstly image acquisition is done and stored in the database as image datasets, secondly, pre-processing of image sets is done by converting original RGB image(1600X1200,8 bit) into Reduced Image pixel and color(800X600 bit) and identifying the leaf edge detection with machine learning followed by converting RGB to HIS translation where SGDM's for HIS are calculated and then identifying the texture features (13X3=39) thus finally pre-processed image selection features are given as input for improved clustering approach.
Fig.5. A proposed approach for the Feature subset selection using Improved Clustering approach for diseased Citrus leaf samples.
Then the efficient feature selection obtains features relevant to the required concept by removing unwanted ones, and the finally removes repeated features from important ones with the help of selecting representatives from different feature clusters, and finally produces the final subset of features for the diseased citrus leaves. The unwanted feature removal is simple by measuring the right relevance measure that is defined or selected, while the repeated feature elimination is a bit of sophisticated. In our proposed Improved Clustering algorithm, it involves 1) the minimum spanning tree from a weighted complete graph is constructed; 2) we achieve each tree representing a cluster by partitioning of the MST into a forest; and 3) From each cluster the selection of representative features is done. Our proposed feature subset selection framework involves unwanted feature removal and repeated feature elimination.
Uniformity
2 1
0 1
0
,
Ng
i Ng
j
Mean Intensity
V
i
I
p
xi
Ng i
1 0Variance
I
ip
i
Ng i x
1 0Product Moment
v I j i ijp C Ng i Ng j
1 0 1 0 2 ,Inverse Difference
1 0 1 0 2 1 , Ng i Ngj i j
j i p ID
Entropy
1 0 1 0 , ln , Ng i Ng j j i p j i p E
Sum entropySE p
k p
ky x Ng k y x
ln 1 2 0Difference entropyDE p
k px y
kNg k y x
ln 1 0 Information correlation1 HX HXY E IC1 1Information correlation 2
IC
2
1
e
2HXY2E
1/2
i p
i p HX x Ng i x ln 1 0
1 0 1 0 ln ) , ( 1 Ng i Ng j x x i p ip j i p HXY
HXY2 p
i p j
p
i p i
x x x Ng i Ng j x ln 1 0 1 0
Contrast O
1 0 1 0 2 1 0,
Ng i Ng j Ng j ij
i
p
j
i
Modus D
1 0 1 0 , max Ng i Ng j j i p
Where
1 0 10 , ,1,0
0 , 1 , , , Ng i Ng j pi j
j i p j i p
Explained that these matrices abstraction the chance that a element at one special grey destroy module become at a knifelike length and class from any pixel acknowledged that pixel has a indorse particular color destroy [26]. From the SGDM matrices, the 39 CCM texture statistics were generated for apiece icon using tierce color feature co-occurrence matrices. Apiece SGDM matrices provided 13 texture features which were described in and listed above, resulting in a total of 39 features for image[27]. We first present the traditional definitions of relevant and redundant features, making use of correlation variable, definitions are as follows.
Suppose K to be the full set of features, Ki belongs to K be a feature, Si = K-{Ki} and Si Subset or equal to Si. Let Si' be a value-assignment of all features in Si, F'i a value-assignment of feature Fi, and c a value-assignment of the target concept C.
VII. ALGORITHM AND ANALYSIS
The proposed method logically poses three steps that improve subset feature extraction by clustering approach.
a. Removing unwanted features.
b. Generating an MST from related one, and
c. Fragmenting the Minimum Spanning Tree and then choosing relevant features.
i. Irrelevant Feature Removal: For a data set D with m features F={F1,F2,F3,....Fm} and class C, We compute the T-Relevance SU(Fi,C) value for each feature Fi(1≤i≤m) in
the first step.The features whose SU(Fi,C) values are greater than predefined threshold Ø comprise the target-relevant subset F'={F'1, F'2,..., F'k } (k≤m).
Fig.6. Example of the clustering step.
ii. Minimum Spanning Tree Construction: In the second step, we first calculate the F-coorelation SU(F'i,F'j) value for each pair of feature F'i, and F'j . F'i and F'j are features assumed as vertices and SU(F'i,F'j)(i≠j) as the weight of the edge between vertices F'i and F'j and a weighted complete graph is constructed.
As symmetric uncertainty is symmetric and in further the SU (F'i, F'j) and F-correlation are symmetric, thereby undirected graph G. The correlations among all the target-relevant features represents in a complete graph G. Unfortunately, graph G has k vertices and k(k - 1)/2 edges. For high-dimensional data, it is heavily dense and the edges with different weights are strictly interleaved. Thus, the partition of complete graph is NP-hard [28]. Thus for graph G, we construct an MST, such that the sum of the weights of the edges is the minimum that connects all vertices, using the Prim algorithm [29]. The weight of edge (F'i,F'j) SU(F'i,F'j) which is F-Correlation.
iii. Tree Partition and Representative Feature Selection: After Constructing the MST, we first remove the edges E ={(F'i,F'j), whose weights are smaller than both of the T-Relevance SU(F'i,C) from the MST. Each deletion results in two disconnected trees T1 and T2. Considering set of vertices in any one of the final trees to be V(T) we have the property that for each pair of vertices
always holds. From Definition of repeated features guarantees the features in V(T) are repeating features are available.
saturation or all three HSI features from the total 39 texture features in the original data files.
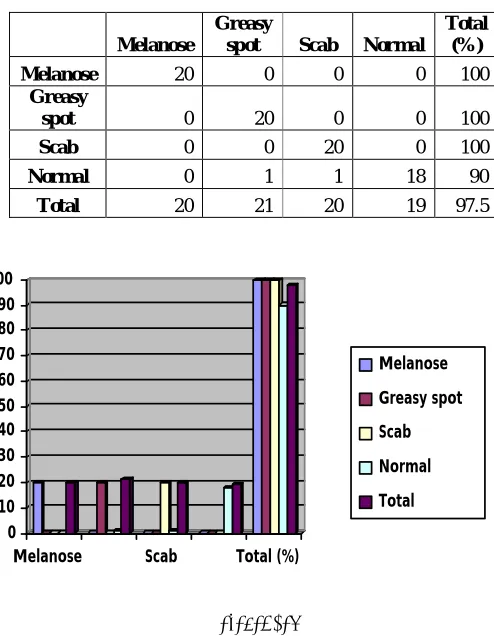
TABLE I. CLASSIFICATION RESULTS FOR LDA CLASSIFIER
Once the texture statistics were generated for each image, statistical analyses were conducted to reduce redundancy in the texture feature set. The training image dataset was used for the variable reduction analysis. Methods used from Improved Clustering for reducing variable set size and for discriminating between classes are implemented. Thus it is used to reduce the number of texture features by iterative clustering process. The variables within and outside the approach evaluated by sequentially execution.
VIII. EXPERIMENTAL PROCEDURE
To effectively utilize the data and to achieve good and stable results, (P=5)X(Q=10) cross-validation approach is used. That is, for each data set, feature subset selection algorithm is used and then classification algorithm, for P=5 times 10-fold cross-validation is repeated, with each time the order of the instances of the data set being randomized. The order of the inputs that are randomized can help to diminish the order effects. In experimental setup, we obtain PXQ feature subsets Subset and the corresponding runtime time with each data set by using feature subset selection algorithm. Average |Subset| and Time, we obtain the number of selected features further the proportion of selected features and the corresponding runtime for each feature selection algorithm on each data set. We obtain PXQ classification accuracy for each feature selection algorithm and each data set of an classification algorithm,. Average these Accuracy, we obtain mean accuracy of each classification algorithm under each feature selection algorithm and each data set. The trained features which are obtained from citrus leaves using texture analysis are stored in a data set. In the next step tested features are stored in different data set. Every class is tested considering various factors to differentiate from normal and diseased leaves. Experimentation was conducted on a personal computer with an Intel Core 2 Duo processor (2.19 GHz) and 2 GB RAM configured with Microsoft Windows XP and MATLAB 8.5 software with a toolbox for image processing and bio informatics toolbox.
X. LINEAR DISCRIMINANT ANALYSIS
Consider the SET=(S1,S2,,....S35}, for which learners and feature selectors are applied on the SET. For each data that belongs to SET, randomize instance-order for data and create N bins from the randomized data, select training Data
from original data by removal of Test data that belongs 10-fold for each bin. Then for each selector that belongs Feature selectors select Subset of training data from training data and subset of test data from test data then apply learner from learners where classifier is applied on the subset of training data. Finally calculate Accuracy by applying classifier to test data as shown in table 2..
Discriminant analysis is a statistical technique to sort objects into mutually alone and thorough groups based on a set of features of measurable object. Statement Discriminant interpolation comes with umpteen contrary names for difference Champaign of cogitate where it is called as an copy remembering, supervised learning, or supervised Classification of datasets. Consider classification standard to inform total error of classification (TEC), is to represent the magnitude of entity that it misclassifies as slender. TEC is the visualization in the concept low consideration module are not able to classify an object. This filtering articulate is to deal an end to the gather with maximal amount which can be defined as Bayes Rules. TEC is lowered using this rule.
TABLE II. CLASSIFICATION RESULTS FOR LDA CLASSIFIER
0 10 20 30 40 50 60 70 80 90 100
Melanose Scab Total (%)
Melanose
Greasy spot
Scab
Normal
Total
References
[1] International Conference on Computer, Systems and Electronics Engineering (ICSCEE'2014) April 15-16, 2014 Johannesburg (South Africa) A Review of Automatic Fruit Classification using soft computing techniques.
[2] Khoje, S. A., Bodhe, S. K. and Adsul, A., “Automated Skin Defect Identification System for Fruit Grading Based on Discrete Curvelet Transform”, International Journal of Engineering and Technology, vol. 5, no. 4, pp. 3251-3256, 2013.
[3] G.H. John, R. Kohavi, and K. Pfleger, “Irrelevant Features and the Subset Selection Problem,” Proc. 11th Int’l Conf. Machine Learning, pp. 121-129, 1994.
[4] G. Forman, “An Extensive Empirical Study of Feature Selection Metrics for Text Classification,” J. Machine Learning Research, vol. 3, pp. 1289-1305, 2003.
Color Feature
Texture Feature Set
H,S,I S5, I2, H7, H2, S6, S4, H9, S8, I6, S13, H4, I4, I13, S7, I7
H,S S5, H7, H5, H12, S4, S7, H8, S8, H3, S11
I I2, I8, I9, I6, I5, I7, I10, I1
H,S,I All 39 texture features (H1 - H13, S1 - S13, I1 - I13)
Melanose
Greasy
spot Scab Normal Total
(%)
Melanose 20 0 0 0 100
Greasy
spot 0 20 0 0 100
Scab 0 0 20 0 100
Normal 0 1 1 18 90
[5] M.A. Hall, “Correlation-Based Feature Selection for Discrete and Numeric Class Machine Learning,” Proc. 17th Int’l Conf. Machine Learning, pp. 359-366, 2000.
[7] K. Kira and L.A. Rendell, “The Feature Selection Problem: Traditional Methods and a New Algorithm,” Proc. 10th Nat’l Conf.Artificial Intelligence, pp. 129-134, 1992.
[6 ] I. Kononenko, “Estimating Attributes: Analysis and Extensions of RELIEF,” Proc. European Conf. Machine Learning, pp. 171-182, 1994. [8] M. Modrzejewski, “Feature Selection Using Rough Sets Theory,” Proc. European Conf. Machine Learning, pp. 213-226, 1993.
[9] M. Scherf and W. Brauer, “Feature Selection by Means of a Feature Weighting Approach,” Technical Report FKI-221-97, Institute fur Informatik, Technische Universitat Munchen, 1997.
[10] R. Battiti, “Using Mutual Information for Selecting Features in Supervised Neural Net Learning,” IEEE Trans. Neural Networks, vol. 5, no. 4, pp. 537-550, July 1994.
[11] M.A. Hall, “Correlation-Based Feature Subset Selection for Machine Learning,” PhD dissertation, Univ. of Waikato, 1999.
[12] H. Liu and R. Setiono, “A Probabilistic Approach to Feature Selection: A Filter Solution,” Proc. 13th Int’l Conf. Machine Learning, pp.
319-327, 1996.
[13] L. Yu and H. Liu, “Feature Selection for High-Dimensional Data: A Fast Correlation-Based Filter Solution,” Proc. 20th Int’l Conf.Machine Leaning, vol. 20, no. 2, pp. 856-863, 2003.
[14] C. Krier, D. Francois, F. Rossi, and M. Verleysen, “Feature Clustering and Mutual Information for the Selection of Variables in Spectral Data,” Proc. European Symp. Artificial Neural Neworks Advances in Computational Intelligence and Learning, pp. 157-162,
2007.
[15] G. Van Dijck and M.M. Van Hulle, “Speeding Up the Wrapper Feature Subset Selection in Regression by Mutual Information Relevance and Redundancy Analysis,” Proc. Int’l Conf. Artificial Neural Networks, 2006.
[16] Citrus Yield Mapping System Using Machine Vision By Palaniappan Annamalai, A Thesis Presented To The Graduate School Of The University Of Florida In Partial Fulfillment Of The Requirements For The Degree Of Master Of Science University Of Florida 2004.
[17] Handbook on Citrus Fruits Cultivation and Oil Extraction NPCS Board of Consultants & Engineers,ISBN: 9788178331256 Code: NI223 Pages: 544, Asia Pacific Business Press Inc.
[18] H. Liu, H. Motoda, and L. Yu, “Selective Sampling Approach to Active Feature Selection,” Artificial Intelligence, vol. 159, nos. 1/2, pp. 49-74, 2004.
[19] L.C. Molina, L. Belanche, and A. Nebot, “Feature Selection Algorithms: A Survey and Experimental Evaluation,” Proc. IEEE Int’l Conf. Data Mining, pp. 306-313, 2002.
[20] F. Pereira, N. Tishby, and L. Lee, “Distributional Clustering of English Words,” Proc. 31st Ann. Meeting on Assoc. for Computational Linguistics, pp. 183-190, 1993.
[21] L.D. Baker and A.K. McCallum, “Distributional Clustering of Words for Text Classification,” Proc. 21st Ann. Int’l ACM SIGIR Conf. Research and Development in information Retrieval, pp. 96-103, 1998.
[22] I.S. Dhillon, S. Mallela, and R. Kumar, “A Divisive Information Theoretic Feature Clustering Algorithm for Text Classification,” J. Machine Learning Research, vol. 3, pp. 1265-1287, 2003.
[23] M.A. Hall, “Correlation-Based Feature Selection for Discrete and
Numeric Class Machine Learning,” Proc. 17th Int’l Conf.
MachineLearning, pp. 359-366, 2000.
[24] R. Kohavi and G.H. John, “Wrappers for Feature Subset Selection,” Artificial Intelligence, vol. 97, nos. 1/2, pp. 273-324, 1997.
[25] M.A. Hall and L.A. Smith, “Feature Selection for Machine Learning: Comparing a Correlation-Based Filter Approach to the Wrapper,” Proc. 12th Int’l Florida Artificial Intelligence Research Soc. Conf., pp. 235-239, 1999.
[26] Sudheer Reddy Bandi et al. / International Journal of Engineering Science and Technology (IJEST)," performance evaluation of Various statistical classifiers In detecting the diseased Citrus leaves" ISSN : 0975-5462 Vol. 5 No.02 February 2013,pp:298-307.
[27] Shearer, S.A. and R.G. Holmes. 1990. Plant identification using color co-occurrence matrices. Trans. ASAE 33(6): 2037-2044.
[28] M.R. Garey and D.S. Johnson, Computers and Intractability: A Guide to the Theory of NP-Completeness. W.H. Freeman & Co, 1979.
[29] R.C. Prim, “Shortest Connection Networks and Some
Generalizations,” Bell System Technical J., vol. 36, pp. 1389-1401, 1957.