BUT
Corresponding Author: Charles Kihampa, School of Environmental Science and Technology, Ardhi University, P.O. Box 35176, Dar es Salaam, Tanzania. Tel: +255 713 269069, Fax: +255 22 2775391, E-mail: kihampa@yahoo.com.
Degradation of Water Resources by
Agricultural Pesticides and Nutrients, Weruweru, Tanzania
Jokha Mohamed, Shadrack Murimi and Charles Kihampa
1 1 2
Department of Geography, Kenyatta University, P.O. Box 43844-00100, Nairobi, Kenya 1
School of Environmental Science and Technology, 2
Ardhi University, P.O. Box 35176, Dar es Salaam, Tanzania
Received: May 8, 2014; Accepted in Revised Form: June 6, 2014
Abstract: Agrochemicals nutrients and residues of pesticides in surface water and sediments samples of Weruweru sub-catchment were investigated to determine their concentrations and quality of water for human consumption. Plant nutrients NO , NO , NH and PO concentrations ranging from 0.005 to 0.96 mg/L were3- 2- 3 4-3 detected in surface water samples. Pesticides residues cyanazine, -chlordane, endosulfan sulphate, p,p’-DDT,
p,p’-DDD,p,p’-DDE, lindane and cypermethrin concentrations ranging from below detection limit to 45.7 µg/l and below detection limit to 157 µg/kg dw were detected in surface water samples and sediments samples, respectively. In most sites, nutrients and pesticides residues concentrations were below the maximum limits as per WHO and national limits for drinking water. The agrochemical contaminants were considered to originate from agricultural runoff and weathered agricultural soils. All parameters were measured by standard methods.
Key words: Agrochemicals Nutrients Pesticides Surface water Sediments
INTRODUCTION include use of repackaged products, lack of safety
Agrochemical is a common term encompassing labeled in unfamiliar languages and complex instructions
various chemical products that are used in agricultural that are difficult to apply [4]. Pesticides and nutrients from activities. It refers to the wide range of pesticides, areas under agriculture activities can therefore reach synthetic fertilizers, hormones and other chemical growth the aquatic environment through direct runoff, leaching,
agents as well as concentrated stores of raw animal careless disposal of empty containers and equipment
manure. The majority of agrochemicals are pesticides and washings.
plant nutrients, which are used to control pests’ invasion, In addition to reducing the ecological status of river
control of vectors of human and animal diseases and systems, pesticides and nutrients can have significant
improve soil fertility [1]. The widespread use of these social and economic costs through polluting drinking and
chemicals over the past half-century has led to their bathing waters, degrading fisheries and potentially
detection in many hydrological systems of many increasing food risks [5]. Excess nitrogen and phosphates
countries [2]. Despite the fact that pesticides and in rivers, lakes, reservoirs and ponds can lead to massive
nutrients pollution in aquatic environment can also overgrowth of algae and deplete the oxygen levels that
originate from other sectors, agriculture is undoubtedly fish, shellfish and other aquatic organisms need to
seen as the most important source of this contamination survive. High level of nitrogen in drinking water can pose [3]. The major concerns are the ways in which they are particular risk to infants and children. For example, the applied and handled that pose threat of diffuse water blue baby syndrome is a common health effect in children
pollution. Farmers have inadequate knowledge in arising from high levels of nitrogen in drinking water.
pesticides and nutrients use and they rely on the Galloway and Cowling [6] reported that chemicals used to
directives given by pesticides dealers. Other problems disinfect drinking water such as chlorine can react with equipments, unsafe storage facilities, unlabelled, or ISSN 2079-2115
algae in water to form disinfection byproducts that have Findings of this study can be used as baseline been associated with reproductive and developmental information towards management of water quality in the
health problems. Pesticides are poisonous by nature and study area and may be replicated other watersheds with
are intended to kill, destroy or control animals and plant similar agricultural activities and population scenarios. species which interfere with agricultural processes or are
vectors of human diseases. Environmental contamination MATERIALS AND METHODS
of natural waters by pesticide residues is of great
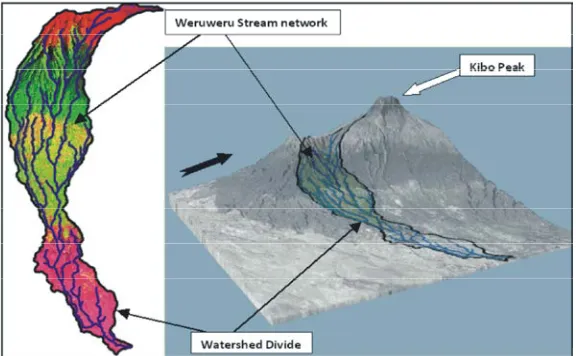
concern. Water pollution by pesticides can affect many Study Area: MapWindow GIS version 4.3, software
non-targeted biological systems, such as fish, birds, delineated the watershed and drainage network of
beneficial insects and plants. They may take very long Weruweru sub-catchment from Enhanced Thematic
time to clear and can pose danger of bioaccumulation [7]. Mapper (+ETM, 2006) Landsat imagery. The computed
Some pesticides are endocrine disruptors that mimic or watershed was then draped over Shuttle Radar
antagonise natural hormones in the body. Such pesticides Topographic Mission (srtm, 30 x 30m ) satellite 3DEM
are linked to human health effects such as immune through 3DEM software (Figure 1). Figure 2 depicts the
suppression, hormone disruption, diminished intelligence, 3D perspective view of 432 FCC of Weruweru River
reproductive abnormalities and cancer [8]. Assessment of watersheds showing the 3 zones. The computed
organochlorine pesticides in water and sediments of watershed covers an area of 250.646 km , located at the rivers from agricultural areas of most countries shows southern base of Mount Kilimanjaro in the north-western that pesticides and other toxic agriculture chemicals are part of Pangani River Basin (PRB), Kilimanjaro region, increasingly polluting the aquatic environments [9-11]. Tanzania (Figure 3). It is situated at latitudes 3°00’ to Thus, with continuously high influx of agriculture 3°30’S and longitudes 36° 30’ to 37°15’E. The altitude
products from increased population in Weruweru above sea-level ranges between approximately 700 m at
sub-catchments the magnitude of the problem cannot be the confluence with Kikafu River to over 4,360 m at the
underestimated. Unfortunately, there is lack of information snowline of Mount Kilimanjaro. The sub-catchment is related to pesticide and nutrients contamination levels in characterized by steep slope valleys to gentle slopes,
the sub-catchment of Pangani river basin, in Tanzania. lowlands and in a few areas valley side slopes
The study was therefore undertaken in order to ascertain (Figures 1 and 2). Weruweru sub-catchment is estimated the levels of plants nutrients and pesticides residues to have a total population of 196,800 people, distributed
in selected surface water and sediments of Weruweru in upper, middle and lower zones. The upper zone
sub-catchment. An understanding of the effects of supports production of coffee; middle zone supports
pesticides and nutrients contaminations is a positive maize and vegetables, while the lower zone supports
step towards addressing the imminent problems posed production of vegetables and tropical fruits. The three to biological organisms and proposes some remedial zones also support livestock rearing that includes
approaches in Weruweru sub-catchment area. dairy and beef cattle, sheep, poultry, goats and pigs.
2
2
Fig 1: Delineated watershed and stream network of Weruweru River
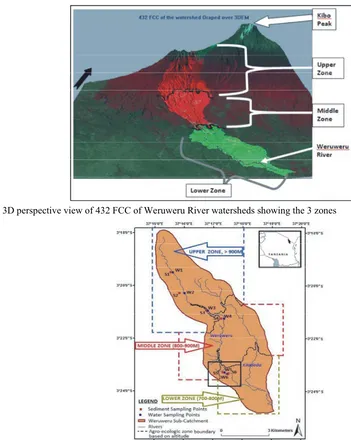
Fig 2: 3D perspective view of 432 FCC of Weruweru River watersheds showing the 3 zones
Fig 3: Map of Weruweru sub-catchment showing sampling points in the three zones
The length of Weruweru River starting from the key stakeholders and 3DEM software algorithms. upper zone to the confluence of Kiladeda is about The locations were divided into three zones based on 17.9 km and about 19.0 km to the sub-catchment. their respective heights above sea-levels (a.s.l.). The river is a tributary of the large PRB and it The zones lower zone (below 800 m), middle zone joins the Pangani River through Kiladeda River (between 800 – 1200 m) and upper zone (above 1200 m)
[12]. were assumed to approximate agro-ecological units in the
Sample Collection:Water and sediments samples were described in Table 1 and indicated in the sub-catchment concurrently collected from 6 selected sampling sites map in Figure 3. The indication of sampling sites in the
(two from each zone) during the dry (February 2013) and sub-catchment map was enabled by Global Position
rainy (April 2013) seasons. The sites were selected System (GPS) points that were measured during sampling
based on the qualitative information obtained from campaigns.
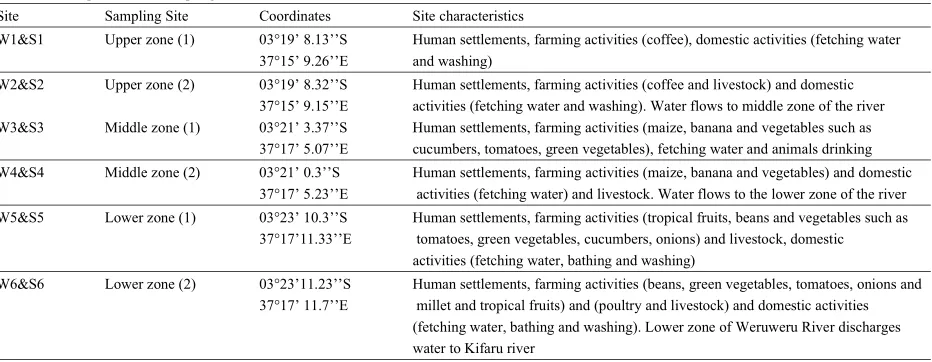
Table 1: Description of the Sampling Sites in Weruweru Sub-catchment
Site Sampling Site Coordinates Site characteristics
W1&S1 Upper zone (1) 03°19’ 8.13’’S Human settlements, farming activities (coffee), domestic activities (fetching water 37°15’ 9.26’’E and washing)
W2&S2 Upper zone (2) 03°19’ 8.32’’S Human settlements, farming activities (coffee and livestock) and domestic 37°15’ 9.15’’E activities (fetching water and washing). Water flows to middle zone of the river W3&S3 Middle zone (1) 03°21’ 3.37’’S Human settlements, farming activities (maize, banana and vegetables such as
37°17’ 5.07’’E cucumbers, tomatoes, green vegetables), fetching water and animals drinking W4&S4 Middle zone (2) 03°21’ 0.3’’S Human settlements, farming activities (maize, banana and vegetables) and domestic
37°17’ 5.23’’E activities (fetching water) and livestock. Water flows to the lower zone of the river W5&S5 Lower zone (1) 03°23’ 10.3’’S Human settlements, farming activities (tropical fruits, beans and vegetables such as
37°17’11.33’’E tomatoes, green vegetables, cucumbers, onions) and livestock, domestic activities (fetching water, bathing and washing)
W6&S6 Lower zone (2) 03°23’11.23’’S Human settlements, farming activities (beans, green vegetables, tomatoes, onions and 37°17’ 11.7’’E millet and tropical fruits) and (poultry and livestock) and domestic activities
(fetching water, bathing and washing). Lower zone of Weruweru River discharges water to Kifaru river
W1-W2 = water sampling sites, S1-S2 = sediment sampling sites
Water samples were collected by grabbing technique, was mixed with 5 mL of deionised water (pH 7.0) in a small preserved, kept in cool boxes and later transported to the clean container and gently stirred by a scoop into slurry. laboratory for analysis. In the laboratory, water samples The mixture was then left to settle for approximately for pesticide analysis were stored in temperatures 15 min before recording the pH value using a calibrated between 0-4°C prior to extraction and analysis, while pH meter. Another sub-sample of 10 g was taken in a samples for nutrients were analyzed immediately upon pre-weighed petri dish for dry weight and organic matter arrival. Water samples for pesticides analysis were determinations. It was later dried in an oven at 105°C for
collected in one liter sampling bottles with Teflon stop 12 hours and 400°C for 3 hours for determination of
cork. After sampling, samples were measured for moisture and organic contents, respectively.
physico-chemical parameters temperature, pH, DO, TDS The third sub-sample (20 g) was grinded with 30 g
and EC using hand-held potable water quality monitor anhydrous sodium sulphate in the mortar and more
and later preserved by 10% of 1000 g of NaCl salt as sodium sulphate were added to make the sample free
described by Akerblom [13]. Water samples for floating powder to bind the water. The mixture was poured nutrients analysis were collected in 500 mL plastic bottles. into a column and eluted with 120 mL dichloromethane The samples were filtered and preserved with concentrate in a beaker while shaking the beaker and left to settle for
H SO . The physico-chemical parameters already2 4 15 min. The contents were then decanted through a plug
measured in water samples for pesticide analysis were of glasswool into an evaporation flask. The remaining
deemed to be adequate for the nutrient samples. sodium sulphate was rinsed with 20-30 mL
Bed sediment samples were taken by using a dichloromethane mixture and decanted through the same
stainless spoon, wrapped in aluminium foil, labeled, glasswool. The resulting extract was concentrated in a
placed in air-tight bags, kept in ice-coolers and rotary evaporator and the solvent was changed to
transported to the laboratory where they were kept at cyclohexane and concentrated to 2 mL ready for
20°C before extraction and analysis. Two field points clean up.
were selected randomly at 0–20 cm depths per sampling Clean up of sediment samples were done by column
site in each zone because sediments at this depth level chromatography using florisil (magnesium silicate). are expected to be the most contaminated and have the A glass column of 5 g (60 cm x 22 mm) packed with florisil, greatest potential for exchange with the water column [14]. glasswool and anhydrous sodium sulphate was used. 50 mL of cyclohexane was added into the glass column and Pesticides Analysis allowed to pass through drop by drop until very little was Sediment Samples Extraction and Clean up: left on the upper part of the column. The sample
Three sub-samples (20, 10 and 5 g) were measured in concentrate was poured into the column and drained to
analytical balance. The first sub-sample of 5 g was used make 2 mL of the sample, then transferred into Teflon for measuring sediment pH values. The sediment sample cork vial and stored at 4°C until analysis was done.
Water Samples Extraction and Clean up: Unfiltered water -chlordane 87±0.3%, p,p’-DDE 98±0.2%, p,p’-DDD
samples, previously preserved with 10% sodium chloride, 99±0.7%, p,p’-DDT 99±1.2% and endosulfan sulphate
were extracted by Liquid-Liquid Extraction (LLE) method. 97±0.9%. The results were not corrected for recoveries Each water sample 1000 mL was quantitatively transferred since all were with the normal acceptable range of to a 1 liter separating funnel and the sampling bottle was 70-120% [15]. ill, 2000).
rinsed with 30 mL dichloromethane, which was then
transferred to the separating funnel containing the water Gas Chromatography Analysis: Pesticide residue
sample. The combined contents were then successively analyses were determined as described by Akerblom [13].
extracted with dichloromethane (3 x 50 mL). The organic GC-Varian CP-3800 gas chromatography equipped with
layer was filtered through plugwool containing anhydrous Ni Electron Capture (EC) detector was used for analysis.
sodium sulphate (30 g) for drying. Sodium sulphate was The GC capillary column WCOT FUSED SILICA 30 mm x
later rinsed with dichloromethane (2 x 3 mL) and the 0.32 mm, coated with CP-SIL 8CB DF 0.2 ìg/mL was used.
combined extract concentrated invacuo at 30°C and the Nitrogen was used as both a carrier and make up gas in
solvent changed to cyclohexane. The volume was the Electron Capture Detector (ECD) at a flow rate of
adjusted in a stream of air to 2 mL in 9:1 30 ± 1 mL/min. The temperature programme was held at
cyclohexane:acetone (v/v) in vials ready for analysis. 70°C for 1min, 15°C/min to 180°C, 4°C/min to 230°C for 15 The water extract appeared clean and were not subjected min. The injection and detector temperatures were 240
to further clean up [13]. and 250°C, respectively. Identification of residues was
Analytical Quality Assurance standards in GC and then comparing the chromatograms Analytical Quality Assurance for Sediment Samples: [16].
A 100 mL aliquot of each n-hexane, dichloromethane,
cyclohexane, ethyl acetate and acetone was concentrated Nutrients Analysis: Nutrients in water samples were
to 2 mL and used to check contamination from the analysed following the methods outlined by
solvents used. Two matrices blank from bed sediments APHA/AWWA/WEF [17]. For ammonia-nitrogen
were obtained from a virgin land where the water passes determination, colorimetric method using Nessler’s
and the same procedure of extraction and analysis as that reagent was used. The detection limit for this method
of sediment samples was performed. The result showed was 0.02 mg/L. Nitrate-nitrogen and phosphoros were
that no significant peaks appeared in the chromatograms determined by the cadmium reduction method and
of the blanks. Recoveries were estimated by spiking the ascorbic acid method, respectively. Methods detection matrix blank with four OCls pesticides standard at limit for both methods were 0.01 mg/L. The quality of the concentrations ranging from 0.01-1.1 ìg/mL of each data was assured by the analysis of blank and duplicate analyte. The average of percentage recoveries ± SD (n=4) samples according to the standard operating procedures
were -chlordane 81.7±3.6%, p,p’-DDE 89±1.5%, of the analytical laboratory at the Department of
p,p’-DDD 80±1.7%,p,p’-DDT 95±2.7% and endosulfan Chemistry, University of Dar es Salaam.
sulphate 87±0.4%. The results were not corrected for
recoveries since all were with the normal acceptable Data Analysis: The analyses of data were performed
range of 70-120% [15]. using descriptive statistics including frequencies,
Analytical Quality Assurance for Water Samples: through the use of Microsoft excel computer software. A 100 mL aliquot of each n-hexane, dichloromethane,
cyclohexane, ethyl acetate and acetone was concentrated RESULTS AND DISCUSSION
to 2mL and used to check contamination from the
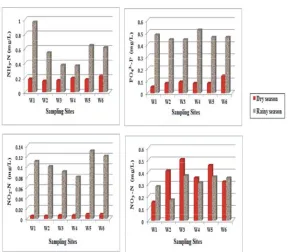
solvents used. 1 L of distilled water was extracted the Nutrient Concentrations in Weruweru River:Nitrate
same way as water sample. The results showed no (NO ), nitrite (NO ), ammonia (NH ) and orthophosphate
significant peaks appeared in the chromatograms of the (PO ) compounds were analyzed in water samples and
blanks. Recoveries were estimated by spiking the matrix results tabulated as shown in Figure 4. These compounds
blank with four OCls pesticides standards at are the most significant inorganic forms of two elements;
concentration ranging from 0.01-1.1ìg/mL of each analyte. nitrogen and phosphorus that commonly limit the
The average of percentage recoveries ± SD (n= 4) were productivity of plants. The concentration of NH -N was 63
effected by running samples and external reference
percentages, mean and histograms. These were computed
3- 2- 3
4-3
Fig 4: Concentration of the Nutrients in Weruweru water samples measured at six sampling sites
low during the dry season (0.15–0.22 mg/L, range) than tissues, resulting in the blue colour of the skin “blue baby
during the rainy season (0.37–0.96 mg/L, range). NH -N is3 syndrome”. The normal background range of nitrate
pH and temperature dependent, such that at high pH concentration in natural waters is normally below 5 mg/L, and temperatures high values of NH -N are expected.3 any value above this level is an indication of manmade
Results from the study indicate that the pH and nitrate pollution [19]. The World Health Organization has
temperature were high during the dry season than set limits of 50 mg/L for NO -N concentration in potable
rainy season. This means that pH and temperature water [20]. In this study concentrations of NO -N in all
cannot be the cause of high NH -N during the rainy3 sampling stations and in both seasons were within the
season. A possible source of high NH -N contamination3 allowable limits for WHO potable water quality and
during rainy season is expected to be runoffs containing normal range of natural water.
fertilizers from upstream. This was attributed to the fact Concentration of PO -P during the dry season range
that both sampling stations are located close to farm lands from 0.05 to 0.14 mg/L, while during the rainy season it
where extensive agriculture is conducted. ranges from 0.44 to 0.52 mg/L. These concentrations were
The concentrations of NO -N during the dry and2- higher than the natural background levels of PO -P in
rainy seasons range from 0.005 to 0.008 mg/L and from river waters which usually range from 0.005 to 0.02 mg/L
0.08 to 0.13 mg/L, respectively. Both concentrations were [21]. High values of phosphorous in rivers can speed
below the maximum limits in drinking water quality of 1 up eutrophication and reduction of dissolved oxygen of
mg/L as per Tanzania standards [18]. The concentration the river water due to increased minerals and organic
for NO -N during the dry season ranged from 0.15 to3- nutrients [22]. Therefore, low level of DO observed during 0.454 mg/L and rainy season range from 0.17 to 0.37 mg/L. the rainy season could partly be associated with high
The high range of NO -N than NO -N is normally3- -2 level of phosphorous.
expected because nitrite is the unstable form of nitrogen
and is easily oxidized into nitrate [6]. Exposure to higher Pesticide Residue in Water and Sediment Samples:
levels of nitrites or nitrates has been associated with Concentration of eight different types of organochlorine cancer, brain tumors, leukemia and asopharyngeal. pesticides residues cyanazine, -chlordane, endosulfan
In infants and children, nitrate and nitrite bind to sulphate, p,p’-DDT, p,p’-DDD, p,p’-DDE, lindane and
hemoglobin and cause chemically altered hemoglobin cypermethrin were measured in water and sediment
(methemoglobinemia) that impairs oxygen delivery to samples collected from six different sites in Weruweru 3
-3
-4
3-4
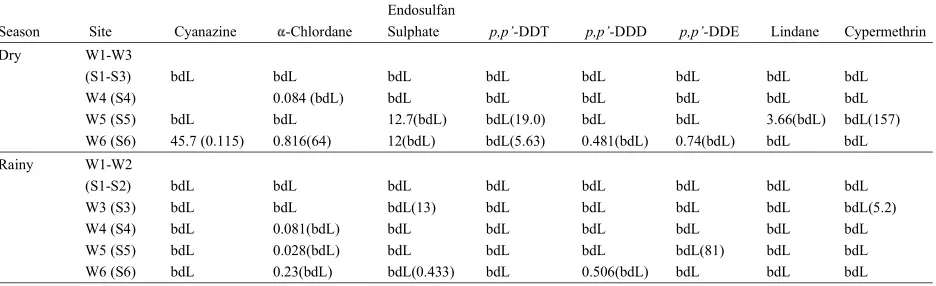
Table 2: Types and Concentrations of Pesticides Residues Detected in Water (µg/L) and Sediment (µg/kg dw) Samples in Dry and Rainy Seasons Endosulfan
Season Site Cyanazine -Chlordane Sulphate p,p’-DDT p,p’-DDD p,p’-DDE Lindane Cypermethrin Dry W1-W3
(S1-S3) bdL bdL bdL bdL bdL bdL bdL bdL
W4 (S4) 0.084 (bdL) bdL bdL bdL bdL bdL bdL
W5 (S5) bdL bdL 12.7(bdL) bdL(19.0) bdL bdL 3.66(bdL) bdL(157) W6 (S6) 45.7 (0.115) 0.816(64) 12(bdL) bdL(5.63) 0.481(bdL) 0.74(bdL) bdL bdL Rainy W1-W2
(S1-S2) bdL bdL bdL bdL bdL bdL bdL bdL
W3 (S3) bdL bdL bdL(13) bdL bdL bdL bdL bdL(5.2)
W4 (S4) bdL 0.081(bdL) bdL bdL bdL bdL bdL bdL
W5 (S5) bdL 0.028(bdL) bdL bdL bdL bdL(81) bdL bdL
W6 (S6) bdL 0.23(bdL) bdL(0.433) bdL 0.506(bdL) bdL bdL bdL bdL = below detection limit, w1-w6 = water samples, s1-s6 = sediment samples, values in brackets represent sediment concentrations where there is no brackets all water and sediment concentrations were bdL
sub-catchment. Results of the various concentrations are concentrations ranging from bdL to 19.0 µg/kg dw. DDT
indicated in Table 2. The computation reveals that most can be degraded into DDD under anaerobic conditions
pesticide residues in water and sediment samples were and into DDE in aerobic environments. Normally, ratios
below detection limits. Concentration range for both dry of (p,p’-DDT)/(DDT metabolite) greater than 0.5 indicate and rainy seasons in water samples was bdL to 4.7 µg/L recent DDT usage [27]. In the current research study,
and in sediment samples ranges from bdL to 157 µg/kg ratios of p,p’-DDT to p,p’-DDE was 0.23, suggesting
dw. previous inputs of DDT into Weruweru river sediments.
Endosulfan sulphate, a major degradation of The ratio also agrees with the results from farmer’s survey endosulfan was the most detected pesticide residues. It that indicated use of DDT up to the late 1990s. DDE may was detected in about 33% of the samples analysed last in the sediment for a very long time, potentially for
during the dry and rainy season. Its concentration in hundreds of years sticking strongly to sediments and
water and sediment samples ranged from bdL to 12.7 µg/L thus may remain in the sediment surfaces for a long span
and bdL to 13 µg/kg dw, respectively during the dry of time. The persistence in the environment of this
season and rainy season. Although endosulfan sulphate organochlorine has also been reported in others parts of
is susceptible to photolysis in the environment, it is the world. For instance DDE have been reported to be expected to have a high occurrence in cultivated areas widely distributed in soils in China despite the fact that its
[23]. Dem and coworkers [24] also reported high use has been discontinued since 1983 [28].
occurrences of endosulfan sulphate in soil samples, Lindane was only detected in water samples from one
which were 74% of the sample analysed. Endosulphate is site (W5) during the dry season with concentration of 3.66 known to be toxic as parent compound endosulfan [25]. µg/L. This concentration is above the acceptable limits Because of their high toxicity, technical endosulfan was for drinking water 2 µg/L as per WHO guidelines [26]. restricted in many countries including Tanzania. In the The small percentage of detection indicates the possibility study area however, it was found to be in use under trade of past usage. Use of lindane was restricted by the United
name thionex/thiodan. State Environmental Protection Agency (U.S EPA) due to
Percentage detection of DDT metabolites in water concerns raised over its potential to causing cancer and
samples were 33.4% during the dry season and 16.7% birth defects in animals [29]. It is highly persistent in soils during rainy season. In the lower zone of Weruweru river, and sediments, with a half life of approximately 15 months.
p.p’-DDD was detected for both seasons and the Cyanazine was detected in the lower zone of the river
concentrations ranged bdL-0.506 µg/L. Then,p,p’-DDE during the dry season with concentrations ranging from
was only detected in the lower zone of the river during bdL to 45.7 µg/L. This is higher than acceptable limit in
the dry season with concentrations ranging from bdL to drinking water of 10 µg/L as per WHO guidelines [26].
0.81 µg/L. The concentrations of the DDT metabolites Concentrations of cyanazine during the rainy season were
were within the acceptable limits in water 2 µg/L as per below detection limits. This could be due to the fact that
WHO guidelines [26]. p,p’-DDT was detected during the cyanazine takes 2 to 14 weeks to disappear completely,
from one point to another. High concentrations of sample extractions and analyses of pesticides and
cyanazine during the dry season in the study area nutrients at the Department of Chemistry, University of
correlate with a similar study in USA where cyanazine was Dar es Salaam. detected in surface water and groundwater at maximum
concentrations of 1300 and 3500 µg/L, respectively. REFERENCES
Cyanazine is restricted by U.S EPA because of its
persistence and teratogenicity effects [30]. 1. Ecobichon, D.J., 2001. Pesticide use in developing
Alfa-chlordane was detected in 33% of water samples countries. Toxicology, 160(1): 27-33.
analysed during the dry season and 50% of samples for 2. Kolpin, D., 2000. Importance of the Mississippi
the rainy season. The concentrations ranged from bdL River Basin for investigating agricultural–chemical
to 0.82 µg/L. -chlordane does not biodegrade and is contamination of the hydrologic cycle. Science of the
highly persistent in soils with a half-life of about 4 years. Total Environment, 248(2): 71-72.
Chlordane has been detected in surface water, 3. Sattler, C., H. Kächele and G. Verch, 2007.
groundwater and sediments. Concentrations detected in Assessing the intensity of pesticide use in
surface water have been very low, while those found in agriculture. Agriculture, ecosystems & environment,
suspended solids and sediments are always higher [30]. 119(3): 299-304.
In this study, -chlordane was detected only during the 4. Ngowi, A., 2003. A study of farmers' knowledge,
dry season in lower zones of the River, with attitude and experience in the use of pesticides in
concentrations ranging from bdL to 64 µg/kg dw. Such coffee farming. African Newsletter on Occupational
values are above the fresh water sediment quality Health and Safety, 13(3): 62-64.
assessment guidelines for alfa-chlordane 4.5 µg/kg dw 5. Bhanti, M. and A. Taneja, 2007. Contamination of
[31]. vegetables of different seasons with
CONCLUSION risk assessment in northern India. Chemosphere,
Results emanating from the current research study 6. Galloway, J.N. and E.B. Cowling, 2002. Reactive
reveal that surface water and sediments in Weruweru nitrogen and the world: 200 years of change.
sub-catchment are contaminated with pesticides and AMBIO: A Journal of the Human Environment, 31(2):
nutrients. The concentrations of contaminants in most of 64-71.
the sites were within the recommended international and 7. Dalvie, A.M., E. Cairncross, A. Solomon and
national limits for drinking waters. However if such L. London, 2003. Contamination of rural surface
contaminations are not controlled can lead to heavy and ground water by endosulfan in farming areas of
contamination of the sediments. Sediments normally act the Western Cape, South Africa. Environment
as a sink of pollutants that eventually releases into water Health: A Global Access Science Source, 2: 1-15. reserves. It can hence be concluded that, if taken up 8. Brouwer, A., M.P. Longnecker, L.S. Birnbaum,
through plant roots and bioaccumulate in the food chain J. Cogliano, P. Kostyniak, J. Moore, S. Schantz and
beyond acceptable limits may cause chronic adverse G. Winneke, 1999. Characterization of potential
health effects to consumers. endocrine-related health effects at low-dose levels
ACKNOWLEDGEMENTS Perspectives, 107(Suppl 4): 639.
We gratefully acknowledge the support by the Alkarkhi and A. Ganjian Khenary, 2010.
German Academic Exchange Service (DAAD) for a study The Determination of Organochlorine Pesticides
grant extended to Jokha Mohamed. We thank Mr Charles Residues in Chalus River Water by Multivariate
Riwa and Engineer Arafa Magidi from Pangani River Basin Analysis. Iranica Journal of Energy & Environment,
Water Office (PBWO) and Mr. Godwin Masumbuko of 1(3): 222-227.
Ngurudoto Defluoridation Research Station, Arusha 10. Bouraie, M.M.E. and A.A. El Barbary, 2011.
for location of the sampling sites and their Assessment of Organochlorine Pesticide in Water
constructive ideas that were useful in analysing the and Sediment Samples Collected from El-Rahawy
data. The authors are also grateful to Mr. Lutufyo Drain, Egypt. Iranica Journal of Energy &
Mwamtobe for his excellent technical assistance during Environment, 2(3): 191-200.
organophosphorous pesticides and related health
69(1): 63-68.
of exposure to PCBs. Environmental Health
9. Najafpour, S., S.M.V. Farabi, Y.M., F.M. Abbas
11. El Bouraie, M.M., A. Ahmed and M.M. Yehia, 2011. 22. Perlman, H., 2013. The effects of urbanization on
Examining the Concentration of Organonitrogen water quality: Phosphorus http://ga.water.usgs.gov/
Pesticides in Water at Nile Delta, Egypt. Iranica edu/phosphorus.html, Accessed 06th June, 2013.
Journal of Energy & Environment, 2(4): 331-338. 23. Manikariza, P., O. Akinbamijo, A. Covaci, R. Pitonzo
12. Pangani Basin Water Office (PBWO), 2010. Report. and P. Schepens, 2003. Assessment of
Tanzania. organochlorine pesticides residues in West Africa
13. Akerblom, M., 1995. Guideline for environmental farms: Banjul and Dakar case study. Archives of
monitoring of pesticide residues for the SADC Environmental Contamination and Toxicology,
Region. SADC/ELMS, Monitoring Techniques 44: 171-179.
Series. 24. Dem, S., J. Cobb and D. Mullins, 2007. Pesticide
14. Nowell, L.H., P.D. Capel and P.D. Dileanis, 1999. residues in soil and water from four cotton growing
Pesticides in stream sediment and aquatic biota: areas of Mali, West Africa. Journal of Agricultural,
distribution, trends and governing factors, 4: CRC Food and Environmental Sciences, 1(1): 16.
Press. 25. Jiang, Y.F., X.T. Wang, Y. Jia, F. Wang, M.H. Wu,
15. Hill, A., 2000. Quality Control Procedures for G.Y. Sheng and J.M. Fu, 2009. Occurrence,
Pesticide Residues Guidelines for Residues distribution and possible sources of organochlorine
Monitoring in the European Union. Document No. pesticides in agricultural soil of Shanghai, China.
SANCO/3103/2000, European Commission. Journal of Hazardous Materials, 170(2): 989-997.
16. Martens, D., K. Schramm and A. Kettrup, 1999. 26. World Health Organization (WHO), 1993.
Standard operation procedures for the determination Drinking water standards. WHO's Guidelines for
of chlorinated hydrocarbons in sediments, Drinking-water Quality, set up in Geneva.
suspended solids and surface waters. On the 27. Montgomery, J.H., 2000. Groundwater Chemicals
Presence of Polychlorinated Organic Compounds Desk Reference, third ed. Lewi Publishers and CRC
in the Liao River and the Yangtse River in Eastern Press, Boca Raton.
China, European Commission EUR-Report, 28. Wu, N., S. Zhang, H. Huang, X. Shan, P. Christie and
18702: 21-28. Y. Wang, 2008. DDT uptake by arbuscular
17. APHA/AWWA/WPCF, 2005. Standard Methods for mycorrhizal alfalfa and depletion in soil as influenced
the Examination of Waters and Wastewaters, 21st ed. by soil application of a non-ionic surfactant.
Washington, DC, USA. Environmental pollution, 151(3): 569-575.
18. Tanzania Bureau of Standards (TBS), 2003. Drinking 29. Gandhi, R. and S. Snedeker, 2010. Pesticides and
(potable) water: Specification (TZS 789:2003), Breast Cancer Risk: Lindane http://envirocancer.
National Environmental Standards Compendium, cornell.edu/FactSheet/Pesticide/fs15.lindane.cfm,
Tanzania Bureau of Standards. Accessed on 20th June, 2013.
19. Bruning-Fann, C.S. and J. Kaneene, 1993. The effects 30. Extoxnet, 1996. Pesticide Information profiles,
of nitrate, nitrite and N-nitroso compounds on human http://extoxnet.orst.edu/pips/cyanazin.htm, Accessed
health: a review. Veterinary and human toxicology, on 5th October, 2012.
35(6): 521-538. 31. MacDonald, D.D., C.G. Ingersoll and T. Berger, 2000.
20. World Health Organization (WHO), 2004. Guideline Development and evaluation of consensus-based
for drinking water quality: recommendations, 3rd Ed, sediment quality guidelines for freshwater
Vol.1, Geneva. ecosystems. Archives of Environmental
21. Chapman, D., 1992. Water quality assessment. A Contamination and Toxicology, 39(1): 20-31.
Persian Abstract
DOI: 10.5829/idosi.ijee.2014.05.02.11
هﺪﻴﻜﭼ
وﺖﻈﻠﻏﻦﻴﻴﻌﺗرﻮﻈﻨﻣﻪﺑورو_وروﻲﻋﺮﻓﺰﻳﺮﺑآهزﻮﺣتﺎﺑﻮﺳريﺎﻫﻪﻧﻮﻤﻧوﻲﺤﻄﺳيﺎﻫبآردﺎﻫﺶﻛﺖﻓآيﺎﻫهﺪﻧﺎﻣﻲﻗﺎﺑويزروﺎﺸﻛﻲﻳﺎﻴﻤﻴﺷيﺬﻐﻣداﻮﻣ
-ﻲﻫﺎﻴﮔيﺬﻐﻣداﻮﻣيﺎﻫﺖﻈﻠﻏ .ﺖﻓﺮﮔراﺮﻗﻲﺳرﺮﺑدرﻮﻣﻲﻧﺎﺴﻧافرﺎﺼﻣياﺮﺑبآﺖﻴﻔﻴﻛ -, NH
3،NO3 -3, NO
2
PO4
رد0/96 mg/lﺎﺗ 0/005 هدوﺪﺤﻣرد
وناﺪﻨﻴﻟ،يدد،ددد،تدد،نﺎﻔﻟﻮﺳوﺪﻧاتﺎﻔﻟﻮﺳ،نادﺮﻠﻛﺎﻔﻟآ ،ﻦﻳزﺎﻧﺎﻴﺳيﺎﻫﺶﻛﺖﻓآ هﺪﻧﺎﻣﻲﻗﺎﺑيﺎﻫﺖﻈﻠﻏ .ﺪﻳدﺮﮔﺺﺨﺸﻣﻲﺤﻄﺳبآ يﺎﻫﻪﻧﻮﻤﻧ ﻦﻴﻴﻌﺗ 157 µg/lﺎﺗﺺﻴﺨﺸﺗﺪﺣﺮﻳزو 45/7g/lﺎﺗﺺﻴﺨﺸﺗﺪﺣﺮﻳزهدوﺪﺤﻣرد،تﺎﺑﻮﺳريﺎﻫﻪﻧﻮﻤﻧوﻲﺤﻄﺳبآيﺎﻫﻪﻧﻮﻤﻧردﺐﻴﺗﺮﺗﻪﺑﻦﻳﺮﺘﻣﺮﭙﻳﺎﺳ
.ﺖﺳاهدﻮﺑﻲﻧﺪﻴﻣﺎﺷآبآياﺮﺑﻲﻠﻣﺪﺣوWHOيﺮﺜﻛاﺪﺣناﺰﻴﻣزاﺮﺘﻤﻛﺎﻫﺶﻛﺖﻓآيﺎﻫهﺪﻧﺎﻣﻲﻗﺎﺑ ويﺬﻐﻣداﻮﻣﺖﻈﻠﻏ،ﺎﻫنﺎﻜﻣﺐﻠﻏا رد.ﺪﻳدﺮﮔ هزاﺪﻧادراﺪﻧﺎﺘﺳايﺎﻫشورﺎﺑﺎﻫﺮﺘﻣارﺎﭘﻪﻴﻠﻛ .ﺪﻧاﻪﺘﻓﺮﮔتﺄﺸﻧ،يزروﺎﺸﻛيﺎﻫكﺎﺧﺶﻳﺎﺳﺮﻓويزروﺎﺸﻛيﺎﻫبآﺖﺸﻧزايزروﺎﺸﻛﻲﻳﺎﻴﻤﻴﺷيﺎﻫهﺪﻨﻳﻻآ
.ﺪﻳدﺮﮔيﺮﻴﮔ