Abstract. Experimental analysis of fracture mechanisms is a key point to understand and further reproduce physical phenomena involved in structural material failure. Actually, crack propagation under high loading rate is a strongly coupled thermo-mechanical problem involving large deformation, high strain rate and (quasi) adiabatic conditions. The work presented herein aims at analyzing the successive steps of the dynamic deterioration of a high strength structural material, namely the ARMOX500T armor steel, leading to the ultimate fracture. The Kalthoff and Winkler impact test, consisting in impacting the edge of a double notched plate, was retained for that purpose. Images are captured at high frame rate (1M frame/s) during the impact loading then analyzed according to a line tracking method. Three stages are accordingly observed: first the progressive development of a weak localization of the deformation within a wide zone behind the notch tips, second the propagation of a narrow band of strong localization, and finally the propagation of a crack. The propagation of the white band is associated to the development of an adiabatic shear band (ASB), as a precursor of the crack. Corresponding displacement fields are identified thanks to the adopted line tracking method, allowing for determining the evolution of mechanical quantities, including notably notch tip shear displacement and velocity, ASB-related white band velocity, global and local shear strain and shear strain rate magnitudes, in view of being implemented into numerical models.
1. Introduction
Analysis of crack propagation in high strength steel under impact loading is the purpose of the present work. With this aim in view, Kalthoff & Winkler [1] impact tests were carried out at various impact velocities. Depending notably on the impact velocity, material grade and temperature, different phenomena can be observed: failure under crack propagation (Mode I and/or II) and/or adiabatic shear banding (ASB). The knowledge of the fracture mechanisms involved in structures during impact loading and of their chronology is a key point to understand and further prevent failure process.
Kalthoff & Winkler impact test consist in impacting the edge of a double notched plate with a cylindrical projectile (see Fig.1). In the present work, a series of images was captured at very high frame rate (1 Mfps) and high spatial resolution (312×260 pixel2) during the impact loading.
A numerical method of image analysis is presented. This method aims at tracking lines that have been beforehand engraved on the sample. The goal is on one hand to identify the succession of kinematic displacement fields that leads to the ultimate dynamic failure of the structure, and on the other hand to quantify the velocity of the physical phenomena involved in the dynamic failure at stake (adiabatic shear band tip velocity, crack tip velocity). Under the condition of the reported test (impact at 156 m/s, room temperature) an ASB-assisted failure is observed in plates consisted of the high strength aCorresponding author:[email protected]
ARMOX500T steel as a candidate for armor application. Tow phenomena are clearly observed, first the ASB development and then the crack propagation in the wake of the ASB. This two mechanisms leading ultimately to the failure of the structure are analyzed thanks to the image analysis outlined in the present paper. The final aim of this digital image analysis is to give qualitative and quantitative information for further model development and enhancement [3,4].
2. Experimental procedure
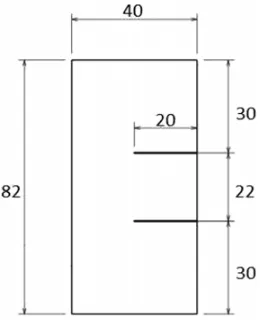
Impact tests were carried out using a 3 m length- and 25 mm inner diameter-gas launcher. The projectile is a 25 mm length- and 20 mm diameter-steel cylinder settled in a 25 mm outer diameter foam cylinder. Double notched plate dimensions are given in Fig.2. The 20 mm length-and 300µm height-notches were machined by electrical discharge machining (EDM) and 2 mm spaced out-vertical straight lines were engraved on the plate, see Fig. 3. Optical sensors allow for measuring the projectile velocity just before the impact. A Shimadzu HPV-1 ultra-high speed camera was used to observe the projectile/plate interaction at 1 Mfps with a 312×260 pixel2 spatial resolution.
3. Digital image analysis
Figure 1. Schematic view of the Kalthoff and Winkler like test
with the zone of interest for ultra-high speed frame rate recording.
Figure 2. Dimensions of the 6mm-thick double notched Kalthoff
and Winkler type plate used in the present work.
Neglecting the vertical y-displacement, the curvature of the lines can be directly linked to shear strain. The goal is therefore to describe the evolution of the engraved lines with analytical functions. These functions are then used to quantify the displacement and strain fields along the lines. An incremental approach (image by image) is developed within Matlab, the key steps of the algorithm are:
• Isolation of each line within a sub-image (Fig.4a). • Detection of the contour of the line using a Sobel
filtering method (Fig. 4b). At this stage the line is described by a cloud of points.
• Identification of the parameters of the analytical function by linear regression based on the cloud of points.
The displacement of each point of the line is described by the following expression:
Ux(y,t )=UxM M(t)+U
W H S x (y,t )
+H (γc1) UxAS B(y,t )+H (γc2) U cr ack x (y,t ).
(1) Each components of the function in Eq. (1) is linked to a specific area or stage of the deformation process
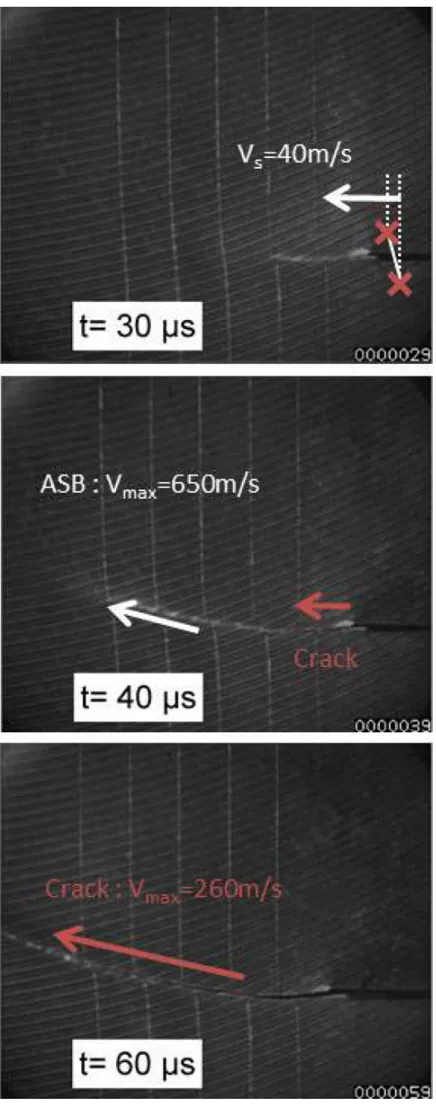
Figure 3. Series of images recorded at 1 Mfps. Vertical straight
lines were beforehand engraved on the plate for line tracking. Impact at 156 m/s on ARMOX500T plate.
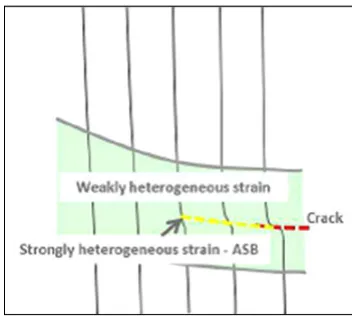
(see Fig. 5), and each of them involved specific parameters:
• The mater motion : UM M x (t)
• The displacement field within the weakly heteroge-neous strain area assumed in the form:
UxW H S(y,t )=U¯ W H S x (t).
2
i=1
tanhdi(t).
y−yo f f set
Figure 4. Principle of line digitalization method. a) Sub-image
containing one line, b) results of the Sobel filtering method for edge detection.
• The displacement field within the ASB-related strongly heterogeneous strain area assumed in the form:
UxAS B(y,t )=
¯
γAS B(t).w
π sin
πy−yo f f set
w
i f y−yo f f set∈
−w
2,w2
+γ¯AS B(t).w
π i f y−yo f f set >w2
−γ¯AS B(t).w
π i f y−yo f f set <−w2·
This component of the function is activated as soon as the critical shear strainγc1is reached (by the mean of the Heaviside functionH (γc1)).
• The discontinuous displacement field induced by the crack and assumed in the form:
Uxcr ack(y,t )=U¯ cr ack x (t) x
−1/2 i f y−yo f f set>0
+1/2 i f y−yo f f set<0.
This component of the function is activated as soon as the critical shear strainγc2is reached.
Nine coefficients are needed to described the displace-ment field (equation 1): ¯UW H S
x (t), d1(t), d2(t),yo f f set,γc1,
¯
γAS B(t),w,γc2, ¯Ucr ack x (t).
The values of these coefficients are identified using a weighted linear regression method. The main advantage of this weighted method is to overcome the non-regular sampling issues coming from the edge detection method. Moreover a constraint is added on the parameters U¯W H S
x (t), d1(t), d2(t), γ¯AS B(t) et
¯
Uxcr ack(t): these parameters must increase with time. These
extra constraints disable the capacity of the relaxation phenomena detection but increase the stability of the method.
involved in the ASB-assisted failure for displacement field identification.
Figure 6. Time history of the shear strain along the median line.
Once the displacement field is known, the function (Eq. (1)) can be differentiated with respect to y to compute the shear strain field along the line:
γx y(y,t )=∂Ux(y,t )
∂y · (2)
4. Results
4.1. Displacement and shear strain-shear strain rate fields
Examples of shear strain fields (Eq. (2)) resulting from the digital image analysis are presented in Figs. 6–8 for the median line (line 3). Shear strain fields are then derived with respect to time to evaluate the shear strain rate fields during ASB development. According to Fig.9, the shear strain rate may reach values greater than 105s−1within the ASB. Those values must be considered as lower bounds for the true shear strain rate, and may locally be higher.
4.2. Velocity measurements
Figure 7. Decomposition of the shear strain into a contribution
due to the weak localization (WHS) and a contribution due to strong localization (ASB).
Figure 8. Shear strain field representation as determined from the
line tracking method.
Figure 9. Time history of the shear strain rate in the ASB middle
of each line.
presented in the present paper the key values summarized in Fig. 10 are:
• projectile velocity: 156 m/s.
• pre-notch shear velocity (Vs): 40 m/s.
• ASB tip maximal velocity: 650 m/s (lower bound). • crack tip velocity in the wake of the ASB: 260 m/s
(lower bound).
Figure 10. Shear velocity at the notch tip, ASB velocity and crack
tip velocity.
5. Conclusions
The authors would like to thank DGA/MRIS (French Ministry of Defence) for its financial support.