Review - Perspectives
Quantitative Network Organization of Interactions
Emerging from the Evolution of Sequence and
Structure Space of Antibodies: the RADARS Model
József Prechl 1,*
1 Diagnosticum zrt; [email protected]
* Correspondence: [email protected]; Tel.: +36-1-881-0161
Abstract: Based on the key molecule of humoral adaptive immunity, the antibody, evolution of the system comprises molecular genetic, cell biologic and immunologic mechanisms, and as a network the system is likely governed and can be characterized by physical rules as well. While deep sequencing can provide vast amounts of data related primarily to clonal relationships, functional interpretation of such data is hampered by the inherent limitations of converting sequence to structure to function. In this paper a novel model of structural interaction space, termed radial adjustment of system resolution, or RADARS, is proposed. The model is based on the radial growth of resolution of structural recognition, corresponding to increasing affinity of immune reactivity, and the virtual infinity of directions of growth, corresponding to the ability to respond to almost any molecular structure. Levels of interaction strength appear as shells of the sphere representing the system. B-cell development and immune responses can be readily interpreted in the model and quantitative properties of the antibody network can be inferred from the physical properties of a quasi-spherical system growing multi-radially. The system is described by double-Pareto distribution, sampling the lognormally distributed equilibrium constants at a rate of phi square. Finally, general strategies for merging antibody sequence space into structural space are outlined.
Keywords: antibody; network; sequence; structure; clonality; B cell; systems biology; quantitative biology
1. Introduction
Appearance of complex multicellular life was accompanied by the evolution of a system that maintains cellular and molecular integrity in the host organism [1]. The adaptive immune system is a complex system in the physical sense, being composed of a vast number of cells that engage in interactions, self-organize and - most impressively - adapt to the molecular and cellular environment. Technological advances now allow us to measure and characterize this complexity in ever growing details, at the gene, transcript, protein and cellular levels, driving the field of systems immunology [2].
The vast amount of data generated requires not only data storage and analysis capacity, but also theoretical frameworks, models that simplify data organization and systems level interpretation.
Humoral adaptive immunity comprises the cells and mechanisms that lead to the production of antibodies. In human adults B-cells develop in the bone marrow throughout life and build up a system of effector and memory cells, which accumulate as a lifetime of immunological experiences. Continuously emerging naive B cells only differentiate further if selected for immunological actions based on their B-cell antigen receptor (BCR) specificity. Because this specificity is genetically coded in the individually rearranged immunoglobulin heavy and light chain sequences, it is possible to capture the antibody repertoire in a given sample of B cells. Deep sequencing or next generation sequencing is capable of generating sequence data of antibody repertoires with varying resolution and length [3–6].
It is also possible to profile the antibody repertoire functionally, based on the identification of antibodies binding to huge sets of potential targets [7]. This approach is biased by the fact that a priori knowledge of targets is not always possible and only those antibodies that bind to the tested antigens are identified. Antigen microarray assays are useful for the focused analysis of antibodies related to allergy, autoimmunity, infection or cancer. Such functional analyses provide a more meaningful profile in the immunological sense and if carried out from blood it is less prone to sampling error than cell-based sequencing approaches.
In this paper, following a brief introduction to the sequence space of antibodies, a model for the molecular organization of antibody structure space or interaction space is proposed. The model builds on the generalized quantitative model of antibody homeostasis [8–10] and provides a quantitative network description of the humoral immune system.
2. Antibody clonal network representation in sequence space
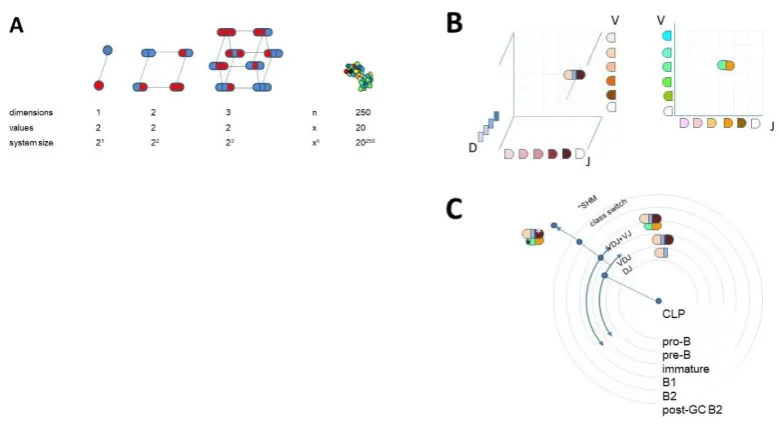
Sequence space in the biological sense is a theoretical space comprising collections of nucleic acid or protein sequences of interest. We usually talk about protein sequence space and define what protein sets are involved (proteome of a given species, cells, etc.) and whether any restrictions hold (fully random, functional, identified, etc.). An amino acid sequence with a given length ‘d’ and full randomization with 20 amino acids occupies a sequence space 20^d (Fig 1A). An exact sequence with no ambiguity defines an exact position in sequence space; moves in this space are discrete steps along a given dimension. As the figure suggests, it is impossible to visualize high-dimensional protein space in 2D. Exponential growth is incredibly fast, leading to the generation of vast amounts of space in high dimensions.
It is accepted that only a fraction of all theoretically possible sequences are thermodynamically stable and protein evolution can be interpreted as a search for acceptable and functional structures in sequence and structure space [11]. Thinking along these lines, the evolution of antibody binding surface, the paratope, is a search for the thermodynamically stable sequences and the selection from among these the ones meeting immunological criteria for B-cell survival. The set of viable antibody sequences, functional antibody sequence space, lies much below the theoretically possible and close to the already observed and annotated antibody sequence space [12].
Collections of antibody protein sequences obtained by translating DNA or RNA of deep sequencing data ideally span the whole variable domain of heavy (VH) and light chains (VL) and can also pair these two. In such a case the gene segments contributing to the rearrangement of VH and VL can be predicted and visualized in 3D and 2D respectively, as shown (Figure 1B). A repertoire can be represented by identifying coordinates of rearrangements identified, and symbol size or color can represent segment frequencies [13]. While the use of gene segments for classification allows tremendous reduction in dimensionality, it is not best suited for functional network analysis, where the use of complete rearranged and mutated sequences is preferable [14].
In a much simpler approach, heavy chain CDR3 regions only are used as an estimate of diversity. Though this region is often regarded as being most important for determining specificity, it has been found to be present in functionally unrelated cells and therefore seems insufficient for functional classification [15]. Selection of the pre-BCR bearing cells depends on signals that may be triggered by ubiquitous ligands present in the bone marrow microenvironment. The presence of uniform reactivity against such common public self-antigens may lead to the positive selection of CDR3 with similar binding properties, and thereby similar sequences.
Whatever the depth and methodology, the clonal relationships of sequences can be used for the construction of family trees, often displayed in circular forms. Assuming that heavy chain V segment-derived protein regions (H-CDR1, H-CDR2) have a dominant role in target recognition, these trees usually start classification with V, clustering clones with common V use [16]. This practice again may be misleading in a functional analysis, since the noted assumption may not necessarily hold. The use of the complete VDJ-H sequence as a first stage classifier, followed by VJ-L use could better reflect the natural development scheme of B cells (Fig 1C).
Figure 1. Sequence space and visualization of antibody clonal relationships
A) Theoretical diversity of a sequence is determined by its length and the number of values a particular position in the sequence can take. More than 3 dimensions are difficult to visualize in 2D. An antibody Fv region of 250 amino acids has an astronomical sequence diversity if full randomization is allowed. If the sequences are exact the positions in sequence space are discrete, but there are no structurally meaningful directions or distances in the multidimensional space. B) Antibody sequences are frequently interpreted as recombined germline sequences. This approach allows the simplified display of repertoires obtained by NGS, preferably with paired heavy and light chain VD identification. Such a display of combinatorial diversity may allow the tracking of specific clonal expansions and further diversification by SHM but reveals little about the overall functional network of interactions. C) Conventionally dimensions grow outwards in dendrograms of clones. Here the potential development scheme of a given antibody clone is shown along with B-cell differentiation steps.
3. Antibody interaction network representation in structural space
In contrast to this graded qualitative scheme, which may well serve the purpose of tracking peripheral clonal expansions accompanied by affinity maturation, a quantitative scheme should place genetic changes into structural rather than sequence space.
While sequence can be defined with various levels of certainty of an amino acid occupying a given position in the sequence, molecular structure can be defined at various levels of resolution. As we are talking about antibody molecules structural resolution is on the atomic scale, crystal structures define atomic coordinates on the Angstrom scale. The binding site of an antibody can also be characterized by the surface area that comes into close contact with the antigen [23,24]. Water molecules are displaced from this area as a function of the goodness of fit. The so-called buried surface area (BSA) is therefore a good predictor of binding energy of protein interactions [25]. Another measure of goodness of fit is the decrease of free energy of the antibody molecule upon
binding. All these approaches are correlated: higher resolution “description” of a structure by the
antibody corresponds to greater BSA and to a higher binding energy. The advantage of using thermodynamic description for the characterization of structural resolution is that it conveys the sense of function: higher binding energy means higher affinity of antibody to target. Besides
defining resolution, which is a general descriptor, the identification of a given structure requires the description of shape. The higher the resolution the more information is required for defining shape.
possible resolution. At this minimal resolution binding to any target is possible and can be interpreted as minimal random contact upon collision of molecules. By starting to increase resolution we shall be able to distinguish between different shapes, the higher the resolution the more shapes becoming distinct. Because of the immense complexity of a binding area the
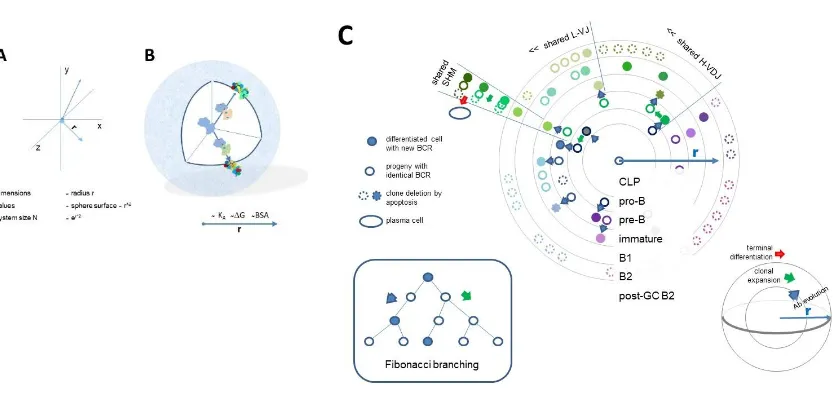
distinction between all possible shapes at high resolution would require a multidimensional space. Let us gradually generate a multidimensional space by considering a point of origin from which a particular direction represents a particular shape. In this representation the extent by which we leave the point of origin corresponds to the extent of precision by which we can define the direction. Thus, going away from the minimal resolution of 1 we can define shape at gradually higher resolutions. (Fig. 2A,B). Different levels of resolution, that is different levels of binding energies appear in our scheme as shells of a sphere. Theoretically the number of directions originating from a single point is infinite, so the shapes available in this representation are also infinite if we go far enough. Practically, considering a reversible interaction, the resolution is limited by the binding energy of reversible interactions. Beyond this limit structure of the binding partners becomes fixed, rigid, corresponding to covalent binding.
This model of the evolution of interactions of a system we shall call ‘RAdial ADjustment of System
Resolution’ or RADARS in short. The abbreviation intentionally reminds of radiolocation, where
emitted electromagnetic waves interact with objects in their way and are reflected to provide a virtual image of the surrounding. The RADARS model implies that elements of the growing system interact with the surroundings, gaining information and adjusting system growth accordingly.
Immunological interpretation of the model requires us to fit B-cell development and antibody evolution into this interaction space. We shall assume that a common lymphoid progenitor has the potential to generate any and all functional VDJ-VJ sequences and therefore to produce via
sequential differentiation and maturations steps antibody against any and all targets. By functional VDJ-VJ sequences we mean all sequences that are physically and biologically viable. This means thermodynamic stability (able to fold into a structure compatible with the Ig domain), ability to pair, forming a VH-VL functional binding unit, and ability to sustain a B-cell via delivering survival, differentiation and proliferation signals.
A differentiation step that reduces this total potential introduces restrictions in structural space. This will appear as an expansion along a radius that point towards the cognate target. Expression of the surrogate light chain (SLC) marks the first step towards BCR formation. These pro-B cells represent the founders of all B cells (Fig. 2C). While signaling via the SLC may be required, it is uncertain whether binding of SLC is required for further differentiation, therefore we assume that these cells seed the complete antibody interaction space. Rearrangement of the heavy chain introduces a structural restriction: a particular functional heavy chain variable domain (VH) sequence has a limited range of targets. Pre-B cells displaying the pre-BCR composed of VH-SLC pairs will divide until and as long as ligands (antigens) are available. Cells with different VH sequences will populate the structural space and share this space according to the availability of target. Cells with more abundant targets expand more, cells with less frequent targets remain in lower numbers, until optimal BCR engagement is achieved [8]. As a result, structural space as represented by this resolution will be filled with different pre-B cell clones according to the availability of the common self-antigens.
The next level of structural resolution, as well as the next level of restriction of binding space, comes with the rearrangement of the light chain. Individual pre-B cells rearrange their light chains
Figure 2. Quantitative interaction space and visualization of antibody network relationships
A) The system of interactions has a center as a reference point. Structural diversity appears as directions from this center towards the target. Distinct directions can be defined with a precision dependent on the distance from the center, equivalent to the radius of the sphere representing the system. The longer the radius of a vector defining a direction, the higher the resolution of the system in that direction. Multidimensionality is theoretically infinite in this representation, practical limits being introduced by resolution. B) Structural diversity appears as we leave the center, spherical representing various levels of structural resolution. Structural resolution corresponds to goodness of fit or binding affinity. Thus, the further we go outwards the more detailed structural recognition becomes. The model allows the theoretical quantitative
organization of antibody evolution or molecular evolution in general. C) Systemic organization of antibody evolution. The evolution of the system of antibodies can be interpreted as clones filling the interaction space at various levels of resolution. Along this pathway cells continually increase their specificity and affinity towards their target direction. A common lymphoid progenitor has the potential to develop antibody against any target, equivalent to a radius of 1. Differentiation proceeds outwards from this point of origin, the center of the network. At every level of differentiation asymmetric divisions fill the level with a clone, expansion being dictated by antigen driven selection of clones with ideal receptor engagement. Accordingly, pre-B cells expand based on the ability of rearranged HVD to pair with SLC and signal for clonal expansion. The generated cells rearrange their LVD and exit bone marrow. Primary TD responses and TI responses expand B2 or B1 cells without further evolution of antibody binding. TD responses allow further directed differentiation in germinal centers. B2 cells are continuously generated and only survive if recruited for specific immune responses. B1 cells, on the contrary, survive in an activated state producing antibodies and dividing rapidly upon activation. Effector cells from clonal expansions can establish long lived plasma cells if they arrive in the required niche.
Different colors stand for structural differences and relationships.
maturation. Meanwhile B2 cells are continuously generated but die in a few days unless recruited as effector cells for further differentiation (Fig. 2C).
To allow for an even balance between differentiation and divisions we can employ a Fibonacci branching scheme in our model: every division yields a cell that can divide further and another one that differentiates (Fig. 2C). Assuming equal time and energy investments for division and
differentiation this scheme results in a Fibonacci series number of cells after every time unit. In our model dividing cells remain on the same level of resolution, differentiating cells move outwards if interaction affinity grows. The scheme is modified by the selection steps though, dictated by the continuous selection of BCR reactivity against target. As a result, the distribution of cells in interaction space will be determined by the rate of division and differentiation along with random sequence generation pruned by interaction-based selection events.
As implied above, selection in the bone marrow is a passive process: randomly generated sequences find their positions in the structural space, expanding according to the availability of fitting target structures. As a result, the emerging population of immature B cells will bear the antigenic signature of the bone marrow environment. This can be interpreted both as deletion of highly self-reactive clones to prevent autoimmunity [27], and as selection for mildly autoself-reactive clones to help homeostatic antibody functions and setting a reference for recognition of non-self [28].
The development of cells reacting with antigens that are only temporarily present in the host presents the risk of investing energy into clones that will become useless once that antigen
disappears. Therefore, such clonal expansions beyond the border of self only takes place when 2nd signals inform the host of danger. This is the development of an immune response, aided by various molecular and cellular help signals. Thymus independent and primary thymus dependent responses expand populations of B cells without improving their affinity, thus keeping them on the same level in the interaction space. Thymus dependent responses aided by helper T cells lead to the formation of germinal centers where affinity maturation takes place. This adjustment of affinity focuses interactions into a particular direction, shape in our model, leading to increased resolution of interaction space only in that direction. In this region of interaction space, affinity and
corresponding resolution of target is high, but once target is cleared cells go into dormancy. These are the memory cells that conserve the genetic information acquired during affinity maturation but minimize their activity: no divisions, no antibody secretion; remaining guards against future encounter with the same or similar target (Fig. 2C). Another set of cells that remains after target has been cleared are plasma cells, which presumably arise from effector cells finding appropriate niche for survival.
4. Characterization of the antibody interaction network
What is the use of devising a theoretical space for the description of antibody evolution in the host? Functional antibody sequence space might be small enough to be handled by today’s databases and
tools. With the growth of interaction databases and structural biological data we might simply merge these sets of data and be able to predict binding specificity and affinity from sequence, so why introduce another model?
The main reason could be the rational organization of all those data. By following the natural flow of events of antibody evolution, by understanding the natural organization of sequences we should be able to simplify and rationalize our databases and tools. The model presented here can be developed into a quantitative network and mathematical tools applied for the analysis of the system.
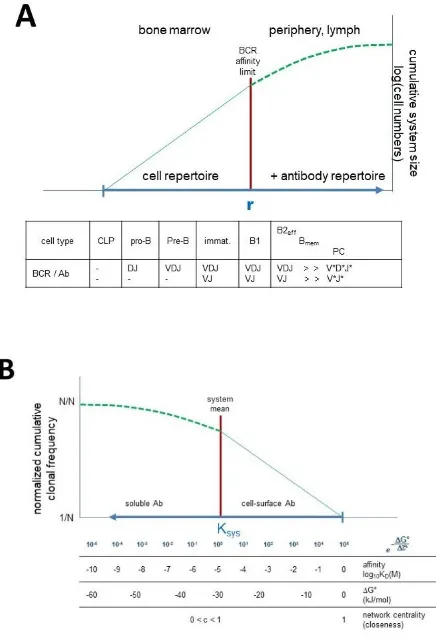
further expansions and differentiation steps increase this repertoire and supplement it with antibody secretion. Events in the bone marrow represent self-organization because of control mechanisms involved, events in the periphery are more stochastic because interactions with the outside molecular world takes control. To describe the network of antibody interactions we follow convention and generate a diagram with the most central node to the rightmost position on an axis representing connectivity of nodes (Fig. 3B). Thus, CLPs, cells with the potential to generate all further B-cell developmental forms are regarded as the central node of the system. The radius of the network grows leftwards in this representation, corresponding to decreasing KD and free energy changes, that is increasing affinity and interaction strength.
Figure 3. Predicted network properties of the humoral immune system.
A) Biological network structure of the humoral immune system, shown as a cumulative distribution function of evolving antibody clones. Self-organizing system in the bone marrow meets environment in the periphery to maintain immunological self and generate immunological
antibody profile. ‚r’ represents the radius of the system. B) Complementary cumulative
distribution of antibody clones as a function of equilibrium distribution, affinity, free energy of binding and network centrality. Based on the radial growth interaction network model the network structure of the humoral immune system can be inferred. Network nodes are
functionally identical B cells, identically extending into the direction of cognate target structure but may comprise distinct sequences, as long as binding is identical.
Deduction of network properties requires the knowledge of distributions of nodes and their connectivity. We shall make two assumptions here regarding these parameters.
Universal laws governing the distribution of binding energies for biomolecular recognition have been uncovered by Zheng and Wang [29]. Based on energy landscape theory they suggest that binding free energy follows a Gaussian distribution, while the equilibrium constant KA follows a log-normal distribution, accordingly. In our model directions correspond to theoretical targets: molecular shapes. If all these targets have binding energy distributions as predicted by the universal distribution model, then our interaction space will represent a collection of these
statistical distributions. Mean binding energy, the energy gap between native configuration and the average unbinding states, corresponds to the average binding energy of antibodies. This value is around -30kJ/mol and is generally regarded as the lower limit of BCR sensitivity.
The RADARS model suggests that the greater the resolution of structural recognition the more restricted the number of shapes recognized. The further the system grows in a given direction the more focused is the recognition. We proposed above that a balanced growth of the system is only possible if cellular division and differentiation are in perfect harmony. Here it is further proposed that the generation of a network with such radially adjusted resolution is possible if rate of node generation is defined by the golden ratio, phi. By increasing radius length with phi, the surface area of the sphere increases proportionally to phi square. Since phi square is equal to phi plus one (one of the special properties of phi), it is possible to promote cells from the previous interaction level (r x 1) and add new cells in proportion to the rate of increase (r x phi). A perfect balance between exponential growth of cells (nodes) and of radius is established, at the same time the number of links (clonal relationships) is determined.
The combination of a lognormal process and sampling at an exponential rate is defined by the double-Pareto distribution, as suggested by Reed [30] and further developed by Mitzenmacher [31]. Based on these mathematical approaches, probability distribution function of the antibody
interaction network according to the RADARS model is given by:
F(r)=
𝑝ℎ𝑖22phi
r
phi-1
, for 0 < r
≤ 1
F(r)=
𝑝ℎ𝑖22phi
r
-phi-1
, for r >
1
where r is the radius of the system, the equilibrium dissociation constant normalized to system size and binding energy distribution. Here we shall call this the system equilibrium distribution
constant
K
sys=
𝒆
− DG° D𝑮°Ksys describes the molecular behavior of a component of the system based on the relative affinity of
The immunological implication of the RADARS model is that the naive repertoire generates a low affinity image of the human antigenome available in the bone marrow environment. Such an image has been called the immunological humunculus, as an analogy to the representation of human body in the brain cortex [32]. While this property of the repertoire often leads investigators to conclude that autoreactive antibodies are enriched in the naive and B1 repertoire, the practical use is quite obvious, as has been suggested by Irun Cohen [28]. Telling the difference between molecular structural self and non-self can be quite easy is the difference is striking. For identifying small differences, it is useful to have a starting repertoire that represents self and then increase resolution only in regions where encountered dangerous structures show up in structural space. The
importance of self-recognition has also been recognized in antibody-mediated physiological functions [10,33].
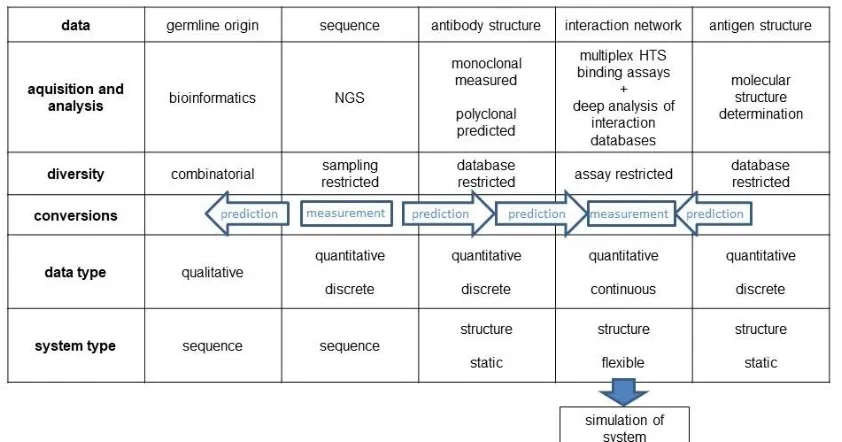
Table 1.
5. Merging sequence space to interaction space
Considering that our technological capacity is ripe for the high-resolution determination and comprehensive analysis of antibody sequence space, the question is how we could convert a dataset in sequence space into a dataset in structural, functional interaction space.
The model presented here suggests that the following key points are important steps towards fully functional models of the adaptive immune system:
- sequence-based clonal structure of B-cell developmental stages need to be determined - comprehensive analysis of the naive repertoire and the B1 repertoire is to be determined - immune-response analysis data are to be interconnected
- sequence-to-structure algorithms be improved and applied to comprehensive datasets [34,35] - predicted structural repertoire data should be combined with HTS interaction assay and epitope database data
Author Contributions: conceptualization, writing; visualization, J.P.
Funding: The author is partly supported by a VEKOP 2.1.1 grant to Diagnosticum.
Acknowledgments: The paper is dedicated to my first mentor in molecular biology and antibody cloning, István Kurucz.
Conflicts of Interest: The authors declare no conflict of interest. The funders had no role in the design of the study; in the collection, analyses, or interpretation of data; in the writing of the manuscript, or in the decision to publish the results.
References
1. Müller V, de Boer RJ, Bonhoeffer S, Szathmáry E. An evolutionary perspective on the systems of adaptive immunity. Biol Rev Camb Philos Soc. 2017;93: 505–528. doi:10.1111/brv.12355
2. Davis MM, Tato CM, Furman D. Systems immunology: just getting started. Nat Immunol. 2017;18: 725–732. doi:10.1038/ni.3768
3. Boyd SD, Joshi SA. High-Throughput DNA Sequencing Analysis of Antibody Repertoires. Microbiol Spectr. 2014;2. doi:10.1128/microbiolspec.AID-0017-2014
4. Vergani S, Korsunsky I, Mazzarello AN, Ferrer G, Chiorazzi N, Bagnara D. Novel Method for High-Throughput Full-Length IGHV-D-J Sequencing of the Immune Repertoire from Bulk B-Cells with Single-Cell Resolution. Front Immunol. 2017;8: 1157. doi:10.3389/fimmu.2017.01157
5. Friedensohn S, Lindner JM, Cornacchione V, Iazeolla M, Miho E, Zingg A, et al. Synthetic standards combined with error and bias correction improve the accuracy and quantitative
resolution of antibody repertoire sequencing in human naïve and memory B cells. Front Immunol. 2018;9: 1401. doi:10.3389/fimmu.2018.01401
6. Miho E, Yermanos A, Weber CR, Berger CT, Reddy ST, Greiff V. Computational Strategies for Dissecting the High-Dimensional Complexity of Adaptive Immune Repertoires. Front Immunol. 2018;9: 224. doi:10.3389/fimmu.2018.00224
7. Prechl J, Papp K, Erdei A. Antigen microarrays: descriptive chemistry or functional immunomics? Trends Immunol. 2010;31: 133–137. doi:10.1016/j.it.2010.01.004
8. Prechl J. A generalized quantitative antibody homeostasis model: regulation of B-cell development by BCR saturation and novel insights into bone marrow function. Clin Transl Immunology. 2017;6: e130. doi:10.1038/cti.2016.89
9. Prechl J. A generalized quantitative antibody homeostasis model: antigen saturation, natural antibodies and a quantitative antibody network. Clin Transl Immunology. 2017;6: e131.
doi:10.1038/cti.2016.90
10. Prechl J. A generalized quantitative antibody homeostasis model: maintenance of global antibody equilibrium by effector functions. Clin Transl Immunology. 2017;6: e161.
doi:10.1038/cti.2017.50
12. Kovaltsuk A, Leem J, Kelm S, Snowden J, Deane CM, Krawczyk K. Observed Antibody Space: A Resource for Data Mining Next-Generation Sequencing of Antibody Repertoires. J Immunol. 2018; doi:10.4049/jimmunol.1800708
13. Rettig TA, Ward C, Bye BA, Pecaut MJ, Chapes SK. Characterization of the naive murine antibody repertoire using unamplified high-throughput sequencing. PLoS ONE. 2018;13: e0190982. doi:10.1371/journal.pone.0190982
14. Bashford-Rogers RJM, Palser AL, Huntly BJ, Rance R, Vassiliou GS, Follows GA, et al.
Network properties derived from deep sequencing of human cell receptor repertoires delineate B-cell populations. Genome Res. 2013;23: 1874–1884. doi:10.1101/gr.154815.113
15. D’Angelo S, Ferrara F, Naranjo L, Erasmus MF, Hraber P, Bradbury ARM. Many Routes to an
Antibody Heavy-Chain CDR3: Necessary, Yet Insufficient, for Specific Binding. Front Immunol. 2018;9: 395. doi:10.3389/fimmu.2018.00395
16. DeFalco J, Harbell M, Manning-Bog A, Baia G, Scholz A, Millare B, et al. Non-progressing cancer patients have persistent B cell responses expressing shared antibody paratopes that target public tumor antigens. Clin Immunol. 2018;187: 37–45. doi:10.1016/j.clim.2017.10.002
17. Bukhari SAC, O’Connor MJ, Martínez-Romero M, Egyedi AL, Willrett D, Graybeal J, et al. The CAIRR Pipeline for Submitting Standards-Compliant B and T Cell Receptor Repertoire Sequencing Studies to the National Center for Biotechnology Information Repositories. Front Immunol. 2018;9: 1877. doi:10.3389/fimmu.2018.01877
18. Breden F, Luning Prak ET, Peters B, Rubelt F, Schramm CA, Busse CE, et al. Reproducibility and reuse of adaptive immune receptor repertoire data. Front Immunol. 2017;8: 1418.
doi:10.3389/fimmu.2017.01418
19. Rubelt F, Busse CE, Bukhari SAC, Bürckert J-P, Mariotti-Ferrandiz E, Cowell LG, et al. Adaptive Immune Receptor Repertoire Community recommendations for sharing immune-repertoire sequencing data. Nat Immunol. 2017;18: 1274–1278. doi:10.1038/ni.3873
20. Rosenfeld AM, Meng W, Luning Prak ET, Hershberg U. Immunedb, a novel tool for the analysis, storage, and dissemination of immune repertoire sequencing data. Front Immunol. 2018;9. doi:10.3389/fimmu.2018.02107
21. Corrie BD, Marthandan N, Zimonja B, Jaglale J, Zhou Y, Barr E, et al. iReceptor: A platform for querying and analyzing antibody/B-cell and T-cell receptor repertoire data across federated
repositories. Immunol Rev. 2018;284: 24–41. doi:10.1111/imr.12666
22. Avram O, Vaisman-Mentesh A, Yehezkel D, Ashkenazy H, Pupko T, Wine Y. ASAP - A Webserver for Immunoglobulin-Sequencing Analysis Pipeline. Front Immunol. 2018;9: 1686. doi:10.3389/fimmu.2018.01686
23. Kringelum JV, Nielsen M, Padkjær SB, Lund O. Structural analysis of B-cell epitopes in antibody:protein complexes. Mol Immunol. 2013;53: 24–34. doi:10.1016/j.molimm.2012.06.001 24. Wedemayer GJ, Patten PA, Wang LH, Schultz PG, Stevens RC. Structural insights into the evolution of an antibody combining site. Science. 1997;276: 1665–1669.
26. Prechl J. Thermodynamic projection of the antibody interaction network: the fountain energy landscape of binding. BioRxiv. 2017; doi:10.1101/124503
27. Melchers F. Checkpoints that control B cell development. J Clin Invest. 2015;125: 2203–2210. doi:10.1172/JCI78083
28. Cohen IR. Biomarkers, self-antigens and the immunological homunculus. J Autoimmun. 2007;29: 246–249. doi:10.1016/j.jaut.2007.07.016
29. Zheng X, Wang J. The universal statistical distributions of the affinity, equilibrium constants, kinetics and specificity in biomolecular recognition. PLoS Comput Biol. 2015;11: e1004212. doi:10.1371/journal.pcbi.1004212
30. Reed WJ, Jorgensen M. The Double Pareto-Lognormal Distribution—A New Parametric Model for Size Distributions. Communications in Statistics - Theory and Methods. 2004;33: 1733–1753. doi:10.1081/STA-120037438
31. Mitzenmacher M. Dynamic models for file sizes and double pareto distributions. Internet Math. 2004;1: 305–333. doi:10.1080/15427951.2004.10129092
32. Cohen IR, Young DB. Autoimmunity, microbial immunity and the immunological homunculus. Immunol Today. 1991;12: 105–110. doi:10.1016/0167-5699(91)90093-9
33. Lobo PI. Role of Natural Autoantibodies and Natural IgM Anti-Leucocyte Autoantibodies in Health and Disease. Front Immunol. 2016;7: 198. doi:10.3389/fimmu.2016.00198
34. Kovaltsuk A, Krawczyk K, Galson JD, Kelly DF, Deane CM, Trück J. How B-Cell Receptor Repertoire Sequencing Can Be Enriched with Structural Antibody Data. Front Immunol. 2017;8: 1753. doi:10.3389/fimmu.2017.01753