THE ORAL HEALTH AND ORAL MICROFLORA OF
CHILDREN WITH CHRONIC RENAL FAILURE AND
CHILDREN UNDERGOING RENAL
TRANSPLANTATION
A thesis submitted to the University o f London
For the degree o f Doctor o f Philosophy
In the Faculty o f Medicine
2001
Abeer Al-Nowaiser BDS
(King Abdullaziz University, Saudi Arabia)
The Institute of Child Health
The Great Ormond Street Hospital For Children
Department of Paediatric Dentistry
The Eastman Dental Institute
UCL
ProQuest Number: U643569
All rights reserved
INFORMATION TO ALL USERS
The quality of this reproduction is dependent upon the quality of the copy submitted.
In the unlikely event that the author did not send a complete manuscript and there are missing pages, these will be noted. Also, if material had to be removed,
a note will indicate the deletion.
uest.
ProQuest U643569
Published by ProQuest LLC(2016). Copyright of the Dissertation is held by the Author.
All rights reserved.
This work is protected against unauthorized copying under Title 17, United States Code. Microform Edition © ProQuest LLC.
ProQuest LLC
789 East Eisenhower Parkway P.O. Box 1346
ABSTRACT Objectives:
To investigate the oral health and oral microflora of children with chronic renal failure (CRF) and children undergoing renal transplantation (RT).
Patients and Method:
Seventy children with CRF (study 1), 25 with CRF (study 2), and 24 children undergoing renal transplantation (study 3), were recruited from The Great Ormond Street Hospital For Children. They were matched for age, gender, ethnicity and socio-economic class with healthy children recruited from the Paediatric Dental Trauma Clinic at The Eastman Dental Hospital and from Camden and Islington Community Health Services NHS Trust.
Indices were recorded for dental caries, dental plaque, gingival inflammation, gingival
enlargement and developmental enamel defects from all subjects and controls at the beginning of the study (baseline). These were repeated for the RT children 2 days and 90 days post
transplantation. Whole stimulated saliva was collected from the 25 children with CRF for estimation of calcium and urea levels and buffering capacity. The oral flora was sampled for streptococci, enterococci. Enterobacteriaceae, Lactobacilli and Candida species using alginate swabs from the 25 children with CRF and the 24 RT children at baseline. This was repeated for children with RT 2 days and 90 days post - transplantation.
Main Results:
A significantly greater proportion of the children with CRF were caries-free (Chi-square 18.8, df l,/7 = 0.0001). In the CRF group there was a significantly lower dmfs {p = 0.0001) and DMFS
ip = 0.004) and a significantly greater plaque score for both the primary teeth ip = 0.04) and permanent teeth ip = 0.05). There were a significantly greater number of children with CRF who had gingival enlargement ip = 0.02) associated with the permanent teeth. There was a
significantly greater enamel defect score in the permanent teeth of the CRF group compared to the controls ip = 0.002). There was a significantly greater proportion of S. parasanguis as a
percentage of both the total anaerobic count ip = 0.04) and the total streptococcal count (p = 0.02) in the children with CRF. There was a significantly greater total streptococcal count as a
percentage of the total anaerobic count in the CRF group ip = 0.05). The S. mitis and
S. parasanguis counts were significantly greater in the C ^ group ip = 0.02 and p = 0.02, respectively). There were a significantly lower Candida species and S. mutans counts in the children with CRF ip = 0.0001 andp = 0.03, respectively). The children with CRF had significantly greater buffering capacity ip = 0.001) and salivary urea levels ip = 0.0001). In the RT group the proportion of S. salivarius as a percentage of the total streptococcal count increased significantly 90 days post transplantation when compared with baseline
ip = 0.005). The number of S. mutans was significantly lower in the RT group compared with the controls at baseline and 90 days later ip = 0.0001 and p = 0.02, respectively). The number of lactobacilli was significantly lower in the RT group compared with the controls at baseline and 90 days later ip = 0.004 and^ = 0.05, respectively). The number of Candida species was
significantly less in the RT children compared with the controls at baseline ip - 0.004). At the final visit, the RT children had a significantly lower proportion of S. parasanguis as a percentage of both the total streptococcal count and the total anaerobic count ip = 0.02 and p = 0.05,
respectively) compared with the controls.
Conclusion: The children with CRF and RT children had relatively stable oral health and significantly less caries experience and S. mutans counts than the matched controls. The oral streptococcal flora of the RT children was relatively stable over the transplant period except for
ACKNOWLEDGEMENTS
I wish to express my deepest gratitude to my supervisors Professor Graham Roberts, The Institute o f Child Health and The Eastman Dental Institute, for his support, encouragement and generous advice; Dr Victoria Lucas, Department o f Oral Medicine, The Eastman Dental Institute, for her invaluable guidance, help and advice; Professor Michael Wilson, Department o f Microbiology, The Eastman Dental Institute, for his kind support and guidance.
I would like to thank my mother and father for their prayers and m y dear husband Yousef, for being patient and supportive. My special thanks also to my dearest children, Dema and Mohammed, who gave me the incentive to continue and my brother Fahad for being sincere and compassionate,
I would also like to thank my friends and colleagues who were always there for me. I will never forget them.
I remain indebted to Dr David Moles for his expert statistical knowledge from which I benefited greatly and to Dr Ron Wilson for his generous help in planning the saliva study.
My special thanks to the staff doctors and nurses in the Renal Unit at the Great Ormond Street Hospital for Children, especially Dr Richard Trompeter, all o f whom made me feel welcome from the first day o f this study.
This study would not have been possible without the cooperation o f the Islington & Camden Health Service.
This was the journey o f m y life.
TABLE OF CONTENTS page
ABSTRACT 2
ACKNOWLEDGEMENTS 3
DEDICATION 4
CONTENTS 5
LIST OF TABLES 14
LIST OF FIGURES 21
ABBREVIATIONS 22
CHAPTER 1
1. INTRODUCTION 24
1.1 Chronic Renal Failure 24
1.1.1 Medical Management o f Patients with CRF 25
1.1.1.1 Growth 25
1.1.1.2 Nutrition 26
1.1.1.3 Fluid and Electrolytes 26
1.1.1.4 Metabolic Acidosis 26
1.1.1.5 Renal Osteodystrophy 26
1.1.1.6 Hypertension 26
1.1.1.7 Anaemia 27
1.1.1.8 Infection 27
1.1.1.9 Dialysis 27
1.1.1.9.1 Peritoneal Dialysis 28
1.1.1.9.2 Haemodialysis 28
1.2 Renal transplantation 28
1.2.1 The Transplant 29
1.2.2 Factors Related to the Recipient 29
1.2.2.1 Age 29
1.2.2.2 Underlying Disease 29
1.2.2.3 Immune Responsiveness 29
1.2.3 Donor Consideration 30
1.2.3.1 Donor Age 30
1.2.4 Drugs Used in Renal Transplantation 30
1.2.4.1 Corticosteroids 30
1.2.4.2 Azathioprine 30
1.2.4.3 Cyclosporin A 31
1.2.4.5 Antilymphocyte Antibodies 31
1.2.5 Post - transplant Medical Complications 32
1.2.5.1 Hypertension 32
1.2.5.2 Infections 32
1.2.5.3 Aseptic Bone Necrosis 33
1.2.5.4 Malignancies 33
1.3 Oral Manifestations 33
1.3.1 Saliva in Children with CRF 33
1.3.2 Oral Manifestations in Patients with CRF 34 1.3.3 Oral Manifestations in Renal Transplant Patients 36
1.4 Oral Microflora 39
1.4.1 Fungal Species 39
1.4.2 Lactobacilli 40
1.4.3 Enterobacteriaceae 41
1.4.4 Enterococci 42
1.4.5 Oral Streptococci 43
1.4.5.1 Classification and Identification o f Oral Streptococci 44 1.5 In Vitro Antibiotic Sensitivity Testing o f Oral Streptococci 52
1.6 Oral Focal Infection 54
1.7 Summary 55
1.8 Null Hypotheses 56
1.9 Aims and Objectives o f the Project 56
1.10 Studies Conducted 5 7
CHAPTER 2
2. PATIENTS AND METHODS 59
2.1 Ethical Approval 59
2.1.1 Consent 59
2.2 Patient Recruitment 59
2.2.1 Sample Size 59
2.3 Children with Chronic Renal Failure (Studies 1 and 2) 59
2.3.2 Controls 60
2.4 Medical Management o f Patients with CRF 60
2.5 Renal Transplant Children (Study 3) 62
2.5.1 Subjects 62
2.5.2 Controls 62
2.6 Medical Management o f RT Patients 62
2.6.1 Medication 62
2.6.2 Medication Taken 90 Days Post - transplantation 63
2.7 Dental Examination 63
2.7.1 Dental Caries 63
2.7.2 Dental Plaque 63
2.7.3 Gingivitis 64
2.7.4 Gingival Enlargement 64
2.7.5 Developmental Enamel Defects 64
2.8 Microbiological Procedures 65
2.8.1 Oral Flora Sampling Technique 65
2.8.2 Salivary Flow Rate and Buffering Capacity 65
2.8.3 Transport o f the Oral Flora Samples 65
2.8.4 Processing o f Samples 67
2.8.5 Non - Selective M edia 67
2.8.6 Selective Media 67
2.9 Identification and Enumeration o f Oral Streptococci 68
2.9.1 Carbohydrate Fermentation Tests 68
2.9.2 Hydrolysis o f Aesculin and Arginine 70
2.9.3 Pre - formed Glycosidic Enzyme Tests 70
2.10 Isolation and Identification o f Y easts 75
2.11 Isolation and Identification o f Enterococci and Enterobacteriaceae 75
2.11.1 Enterococci 75
2.11.2 Enterobacteriaceae 75
2.12 Data Analyses 77
2.12.1 Analysis o f the Dental Findings 77
2.12.2 Analysis o f the Microbiological Findings 77
2.13 Antibiotic Susceptibility Testing o f Oral Streptococci 79
2.13.1 Inoculum Preparation 79
2.13.2 Application o f E - test Strips 79
2.13.3 Reading the MIC 80
2.13.4 Interpretation o f the Susceptibility Categories 80
2.13.5 Statistical Analyses 82
CH APTERS
3. RESULTS 84
3.1 Reproducibility o f the Dental Indices 84
3.1.1 Dental Caries 84
3.1.2 Dental Plaque and Gingivitis 84
3.1.3 Gingival Enlargement 85
3.1.4 Reproducibility o f the Sampling Procedure and Colony
Counting 85
3.1.4.1 Reproducibility o f the Sampling Procedure 85 3.1.4.2 Reproducibility o f Colony Counting 86
RESULTS OF STUDY 1
3.2 Dental Health in the Children with Chronic Renal Failure 87
3.2.1 Age, Gender and Ethnicity 87
3.2.1.1 Subjects 87
3.2.1.2 Controls 87
3.2.2 Medical Details 87
3.2.2.1 Primary Diagnosis o f the Patients with CRF 87
3.2.2.2 Types o f Dialysis 88
3.2.2.3 Number o f Previous Transplants 88
3.2.2.4 Number o f Children Fed via Gastrostomies 88 3.2.2.5 Blood Biochemistry Results at the Examination Date 88
3.3 Dental Indices 89
3.3.1 Dental Caries 89
3.3.2 Dental Plaque 89
3.3.3 Gingivitis 89
3.3.4 Gingival Enlargement 90
3.3.5 Developmental Dental Defects 93
RESULTS OF STUDY 2
3.4 Dental Health, Oral Microflora and Salivary changes in Children
with CRF 96
3.4.1 Age, Gender and Ethnicity 96
3.4.1.1 Subjects 96
3.4.1.2 Controls 96
3.4.2 Medical Details 96
3.4.2.1 Primary Diagnosis o f the Patients with CRF 96
3.4.2.2 Types o f Dialysis 97
3.4.2.3 Number o f Previous Transplants 97
3.4.2.4 Number o f Children Fed via Gastrostomies 97 3.4.2.5 Blood Biochemistry Results at the Examination Date 97
3.4.3 Dental Indices 98
3.4.3.1 Dental Caries 98
3.4.3.2 Dental Plaque 98
3.4.3.3 Gingivitis 98
3.4.3.4 Gingival Enlargement 101
3.4.3.5 Developmental Enamel Defects 101
3.4.4 Microbiological Data 103
3.4.4.1 Total Viable Counts 103
3.4.4.2 Oral Streptococci 103
3.4.4.2.1 Isolation Frequency 103
3.4.4.2.2 Total Streptococcal Count as a
Percentage o f the Total Anaerobic Count 104 3.4.4.2.3 Each Streptococcal Species as a Percentage
o f the Total Streptococcal Count 104 3.4.4.2.4 Each Streptococcal Species as a Percentage
o f the Total Anaerobic Count 104
3.4.4.3 Candida Species 104
3.4.4.4 Lactobacilli 104
3.4.4.5 Enterobacteriaceae and Enterococci 109
3.4.5 Salivary Data 109
3.4.6 Summary o f Results (Study 2) 109
3.4.7 Comparison o f the Dental Indices, Microbiological Data and the Salivary Investigation Data between the CRF Children
with and without Gastrostomies 112
3.4.7.1 Dental Indices 112
3.4.7.1.1 Dental Caries 112
3.4.7.1.2 Dental Plaque 112
3.4.7.1.3 Gingivitis 112
3.4.7.2 Microbiological Data 113
3.4.7.2.1 Total Viable Counts 113
3.4.7.2.2 Mean Number o f Streptococcal Species 113 3.4.7.2.3 Total Streptococcal Count as a Percentage
o f the Total Anaerobic Count 113 3.4.7.2.4 Each Streptococcal Species as a Percentage
3.4.7.2.5 Each Streptococcal Species as a Percentage
o f the Total Anaerobic Count 113
3.4.T.2.6 Candida 119
2> A .I .2.1 Enterobacteriaceae and EntQiococci 119
3.4.7.2.5 Lactobacilli 119
3.4.7.3 Salivary Data 119
3.4.7.4 Summary 119
RESULTS OF STUDY 3
3.5 Dental Health and Oral Microflora o f Children Undergoing Renal
Transplantation 122
3.5.1 Age, Gender and Ethnicity 122
3.5.1.1 Subjects 122
3.5.1.2 Controls 122
3.5.2 Medical Details 122
3.5.2.1 Primary Diagnosis o f the CRF Children
Undergoing Renal Transplant 122
3.5.2.2 Number o f Previous Transplants 122
3.5.2.3 Types o f Kidney Transplants 123
3.5.2.4 Blood Biochemistry Results at the Examination
Date 123
3.5.2.5 Times o f Oral Examination and Microbiological
Sampling 123
3.5.3 Dental Indices in the Control Group 124
3.5.3.1 Dental Caries 124
3.5.3.2 Dental Plaque 124
3.5.3.3 Gingivitis 124
3.5.3.4 Gingival Enlargement 124
3.5.3.5 Summary o f the Dental Findings o f the Control
Group between the Two Visits 124
3.5.4 Dental Indices in the Renal Transplant Group 128
3.5.4.1 Dental Caries 128
3.5.4.2 Dental Plaque 128
3.5.4.3 Gingivitis 128
3.5.4.4 Gingival Enlargement 128
3.5.4.5 Summary o f the Dental Findings o f the RT Group
between the Three Visits 132
3.5.5 Comparison o f the Dental Findings in the RT and
Control Groups 132
3.5.5.1 Dental Caries 132
3.5.5.2 Dental Plaque 133
3.5.5.3 Gingivitis 133
3.5.5.4 Gingival Enlargement 133
3.5.5.5 Summary o f the Comparison o f the Dental Findings between the RT and Control Children 133 3.5.6 Microbiological Findings in the Control Group 134
3.5.6.1 Total Viable Counts 134
3.5.6.2.1 Isolation Frequency 134 3.5.6.2.2 Total Streptococcal Count as a
Percentage o f the Total Anaerobic Count 134 3.5.6.2.3 Each Streptococcal Species as a Percentage
o f the Total Streptococcal Count 134 3.5.6.2.4 Each Streptococcal Species as a Percentage
o f the Total Anaerobic Count 135
3.5.6.3 Candida Species 135
3.5.6.4 Enterobacteriaceae 2inà¥;rAQrococQi 135
3.5.6.5 Lactobacilli 135
3.5.6.6 Summary o f the Microbiological Findings in the Control
Group between the Two Visits 135
3.5.7 Microbiological Findings in the RT Group 141
3.5.7.1 Total Viable Counts 141
3.5.7.2 Oral Streptococci 141
3.5.7.2.1 Isolation Frequency 141
3.5.7.2.2 Total Streptococcal Count as a
Percentage o f the Total Anaerobic Count 141 3.5.7.2.3 Each Streptococcal Species as a Percentage
o f the Total Anaerobic Count 141 3.5.7.2.4 Each Streptococcal Species as a Percentage
o f the Total Streptococcal Count 147
3.5.7.3 Candida Species 147
3.5.7.4 Enterobacteriaceae and Enterococci 147
3.5.7.5 Lactobacilli 147
3.5.7.6 Summary o f the Microbiological Findings between the
three visits o f the RT Group 147
3.5.8 Comparison o f the Microbiological Findings in the RT and
Control Groups 148
3.5.8.1 Total Viable Counts 148
3.5.8.2 Oral Streptococci 148
3.5.8.2.1 Isolation Frequency 148
3.5.8.2.2 Total Streptococcal Count as a
Percentage o f the Total Anaerobic Count 149 3.5.8.2.3 Each Streptococcal Species as a Percentage
o f the Total Streptococcal Count 149 3.5.8.2.4 Each Streptococcal Species as a
Percentage o f the Total Anaerobic Count 149
3.5.8.3 Candida species 149
3.5.8.4 Lactobacilli 149
3.5.8.5 Summary o f the Microbiological Findings in the RT
Children Compared with the Matched Controls 149 3.6 Changes in Antibiotic Susceptibility o f Streptococci isolated from
the Renal Transplant Patients and Control Subjects 151
3.6.1 Type Strains 151
3.6.2 Comparison o f the M lCs o f Antibiotics for Streptococci 151
3.6.2.1 Amoxicillin 151
3.6.2.3 Gentamicin 152
3.6.2.4 Teicoplanin 152
3.6.2.5 Vancomycin 152
3.6.2.6 Ciprofloxacin 152
3.6.2.7 Proportions o f Antibiotic - Resistant Streptococci 153 3.6.3 Comparison o f the MICs o f Antibiotics for S. mitis 158
3.6.3.1 Amoxicillin 158
3.6.3.2 Clindamycin 158
3.6.3.3 Gentamicin 158
3.6.3.4 Teicoplanin 158
3.6.3.5 Vancomycin 159
3.6.3.6 Ciprofloxacin 159
3.6.3.7 Proportion o f Antibiotic - Resistant S. mitis 159 3.6.4 Comparison o f the MICs o f Antibiotics for S. salivarius 163
3.6.4.1 Amoxicillin 163
3.6.4.2 Clindamycin 163
3.6.4.3 Gentamicin 163
3.6.4.4 Teicoplanin 164
3.6.4.5 Vancomycin 164
3.6.4.6 Ciprofloxacin 164
3.6.4.7 Proportion o f Antibiotic - Resistant S. salivarius 166 3.6.5 Comparison o f the MICs o f Antibiotics for S. mutans 168
3.6.5.1 Amoxicillin 168
3.6.5.2 Clindamycin 168
3.6.5.3 Gentamicin 168
3.6.5.4 Teicoplanin 168
3.6.5.5 Vancomycin 169
3.6.5.7 Ciprofloxacin 169
3.6.5.8 Proportion o f Antibiotic - Resistant «S. 171
CHAPTER 4
4. DISCUSSION AND CONCLUSIONS 175
4.1 Dental Health in the Children with CRF 175
4.1.1 Dental Indices 175
4.2 Dental Health, Oral Microflora and Salivary Changes in Children with
Chronic Renal Failure 178
4.2.1 Oral Microflora o f Children with CRF 178
4.2.2 Salivary Findings in the Children with CRF 180 4.2.3 Findings in CRF Children with and without Gastrostomies 180
4.2.3.1 Dental Indices in CRF Children with and without
Gastrostomies 180
4.2.3.2 Oral Microflora in CRF Children with and without
4.2.3.3 Salivary Findings in CRF Children with and without
Gastrostomies 181
4.3 Dental Health and Oral Microflora o f Children
Undergoing Renal Transplantation 181
4.3.1 Dental Indices in Children with RT 181
4.3.2 Oral Microflora o f RT Children 184
4.3.2.1 Control Group 184
4.3.2.2R T Group 184
4.4 Oral Focal Infection 188
4.5 Antibiotic Sensitivity Testing Using the E-test 189 4.6 General Conclusions and Clinical Implications 191
4.7 Future Work 192
R E FE R E N C E S 193
LIST OF TABLES Chapter 1
Table 1.1 Classification o f The Causes o f CRF 25
Table 1.2 Chapter 2 Table 2.1 Table 2.2 Table 2.3 Table 2.4 Table 2.5 Table 2.6 Table 2.7 Table 2.8 Table 2.9 Table 2.10 Chapter 3 Table 3.1 Table 3.2 Table 3.3 Table 3.4 Table 3.5 Table 3.6
Differential Phenotypic Characteristics o f Viridans Streptococci 47
Medication used by Children with CRF (Study 1) 60 Medication used by Children with CRF (Study 2) 61 Medication taken 90 Days Post - transplantation 63
Scoring o f Gingival Enlargement 64
Media, Dilution and Incubation Time at 37°C 68
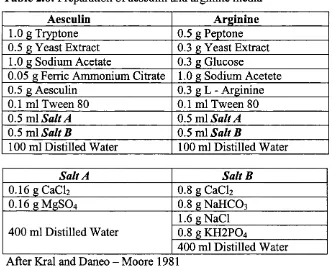
Preparation o f Aesculin and Arginine 70
Carbohydrate Fermentation and Substrate Hydrolysis Patterns o f the Type Strains o f Viridans Streptococci 73 Preformed Enzyme Hydrolysis Activity o f the Type Strains o f
Viridans Streptococci. 74
The Numbers o f Species Tested for Antibiotic Sensitivity at
Different Sampling Times 79
Breakpoints o f Antibiotics for Streptococci according to the Interpretative Standards o f the National Committee o f Clinical
and Laboratory Standards (2000) 82
Inter - and Intra - Examiner Reliability for Recording Dental
Caries 84
Table 3.7 Numbers o f Children on Different Types o f Dialysis (Study 1) 88 Table 3.8 Blood Biochemistry o f the children with CRF (Study 1) 88 Table 3.9 Caries Experience: CRF Group vs Control Group (Study 1) 91 Table 3.10 Decayed, Missing and Filled Surfaces and Teeth for Primary
Dentition (dmfs/dmft) and Decayed, Missing and Filled Surfaces and Teeth for Permanent Dentition (DMFS/DMFT):
CRF vs Control Group (Study 1) 91
Table 3.11 Plaque and Gingivitis Scores: CRF Group vs Control Group
(Study 1) 92
Table 3.12 Plaque and Gingivitis Index: CRF Group vs Control Group
(Study 1) 92
Table 3.13 Gingival Enlargement (GE) Score and Index: CRF Group vs
Control Group (Study 1) 94
Table 3.14 Enamel Defects Score: CRF Group vs Control Group (Study 1) 94 Table 3.15 Primary Diagnosis o f the Children with Chronic Renal Failure
(Study 2) 96
Table 3.16 Numbers o f Children on Different Types o f Dialysis (Study 2) 97 Table 3.17 Blood Biochemistry o f the children with CRF (Study 2) 97 Table 3.18 Caries Experience: CRF Group vs Control Group (Study 2) 99 Table 3.19 Decayed, Missing and Filled Surfaces and Teeth for Primary
Dentition (dmfs/dmft) and Decayed, M issing and Filled Surfaces and Teeth for Permanent Dentition (DMFS/DMFT) :
CRF vs Control Group (Study 2) 99
Table 3.20 Plaque and Gingivitis Scores: CRF Group vs Control Group
(Study 2) 100
Table 3.21 Plaque and Gingivitis Index: CRF Group vs Control Group
(Study 2) 100
Table 3.22 Gingival Enlargement (GE) Score and Index: CRF Group vs
Control Group (Study 2) 102
Table 3.23 Enamel Defects Score: CRF Group vs Control Group
(Study 2) 102
Table 3.24 Total Viable Counts as Colony Forming Units (cfu) per ml
Table 3.25 M ean Number o f Streptococcal Species: CRF vs Control
Group (Study 2) 106
Table 3.26 Total Streptococcal Count as a Percentage o f the Total
Anaerobic Count: CRF vs Control Group (Study 2) 106 Table 3.27 Proportion o f Each Streptococcal Species as a
Percentage o f t he Total Streptococcal Count: CRF V5 Control
Group (Study 2) 107
Table 3.28 Proportion o f Each Streptococcal Species as a
Percentage o f the Total Anaerobic Count: CRF vs Control
Group (Study 2) 108
Table 3.29 Salivary Findings: CRF vs Control Group (Study 2) 110 Table 3.30 dmfs, dmft, DMFS, DMFT, Plaque Score and Index and
Gingivitis Score and Index: CRF with Gastrostomies vs CRF
with no Gastrostomies (Study 2) 114
Table 3.31 Total Viable Counts as Colony Forming Units per ml (logio values): CRF with Gastrostomies vs CRF with no
Gastrostomies (Study 2) 115
Table 3.32 M ean Number o f Streptococcal Species: CRF with
Gastrostomies vs CRF with no Gastrostomies (Study 2) 116 Table 3.33 Total Streptococcal Count as a Percentage o f the Total
Anaerobic Count: CRF with Gastrostomies vs CRF with
no Gastrostomies (Study 2) 116
Table 3.34 Proportion o f Each Streptococcal Species as a Percentage o f the Total Streptococcal Count: CRF with Gastrostomies vs CRF
with no Gastrostomies (Study 2) 117
Table 3.35 Proportion o f Each Streptococcal Species as a Percentage o f the Total Anaerobic Count: CRF w ith Gastrostomies vs CRF with
no Gastrostomies (Study 2) 118
Table 3.36 Salivary Findings: CRF with Gastrostomies vs CRF with
no Gastrostomies (Study 2) 121
Table 3.37 Primary Diagnosis o f Chronic Renal Failure Condition
(Study 3) 122
Table 3.38 Blood Biochemistry o f Renal Transplant Children 123 Table 3.39 Times o f Oral Examination and Microbiological Sampling
Table 3.40 Mean dmfs, dmft, DMFS and DMFT for the Primary and
Permanent Teeth: The Control Group at Baseline 126 Table 3.41 Plaque Score, Gingivitis Score, Plaque Index, Gingivitis
Index and Gingival Enlargement (GE) Index: Control
Group at Baseline (V I) and 90 Days Later (V3) (Study 3) 127 Table 3.42 Mean dmfs, dmft, DMFS and DMFT for the Primary and
Permanent Teeth: The RT Group at Baseline 129 Table 3.43 Plaque Score, Gingivitis Score, Plaque Index, Gingivitis
Index and Gingival Enlargement (GE) Index: RT Group at Baseline (V I), within 2 Days Post - transplant (V2) and
90 Days Later (V3) (Study 3) 130
Table 3.44 Demographic and Drugs Variables for the RT Patients who had Gingival Enlargement (GE) compared to those
with no Gingival Enlargement (No GE) 131
Table 3.45 Correlation between the Gingival Enlargement Index with the Plaque Index, Gingivitis Index at the Final Visit
Using Spearman's Rank Correlation Coefficient (rho) 132 Table 3.46 Total Viable Counts as Colony Forming Units per ml
(logio values): Control Group at Baseline (V I) and
90 Days Later (V3) (Study 3) 137
Table 3.47 Mean Number o f Streptococcal Species: Control
Group at Baseline (V I) and 90 Days Later (V3) (Study 3) 138 Table 3.48 Total Streptococcal Count as a Percentage o f the Total
Anaerobic Count: Control Group at Baseline (V I) and
90 Days Later (V3) (Study 3) 138
Table 3.49 Proportion o f Each Streptococcal Species as a Percentage o f the Total Streptococcal Count: Control Group at Baseline (V I)
and 90 Days Later (V3) (Study 3) 139
Table 3.50 Proportion o f Each Streptococcal Species as a Percentage o f the Total Anaerobic Count: Control Group at Baseline (V I)
and 90 Days Later (V3) (Study 3) 140
Table 3.51 Total Viable Counts as Colony Forming Unit per ml (logio values): RT at Baseline (V I), within 2 Days
Table 3.52 Isolation Frequency (%) o f the Detected Bacteria: RT Group at Baseline (V I), within 2 Days (V2) and 90
Days Post - transplantation (V3) 143
Table 3.53 Mean Number o f Streptococcal Species: RT group at Baseline (VI), within 2 Days o f Transplantation (V2)
and 90 Days Later (V3) (Study 3) 144
Table 3.54 Total Streptococcal Count as a Percentage o f the Total Anaerobic Count: RT Group at Baseline (V I), within 2 Days o f Transplantation (V2) and 90 Days
Later (V3) (Study 3) 144
Table 3.55 Proportion o f Each Streptococcal Species as a Percentage o f the Total Anaerobic Count: RT Group at Baseline (V I), within 2 Days o f Transplantation (V2) and 90 Days
Later (V3) (Study 3) 145
Table 3.56 Proportion o f Each Streptococcal Species as a Percentage o f the Total Streptococcal Count: RT Group at Baseline (V I), within 2 Days o f Transplantation (V2) and 90 Days
Later (V3) (Study 3) 146
Table 3.57 MIC50 and MIC90 (pg/ml) for S. mitis, S. salivarius and
S. mutans Type Strains 154 Table 3.58 MIC50 and MIC90 (pg/ml) for Staphylococcus aureus and
S. pneumoniae 154
Table 3.59 In vitro Activity o f the Antibiotics Against Streptococci: RT Children at the Three Visits, Baseline (V I), within 2 Days Post - transplantation (V2) and 90 Days Post - transplantation
(V3) 155
Table 3.60 In vitro Activity o f the Antibiotics Against Streptococci: Control Children at the Two Visits, Baseline (V I) and
90 Days Later (V3) 155
Table 3.61
Table 3.62
Proportions o f Streptococci which were Susceptible, o f Intermediate Susceptibility and Resistant to the Range o f Antibiotics Tested: RT group at Baseline (V I), within 2 Days Post - transplantation (V2) and 90 Days Post - transplantation (V3). The p Value is for o f the Resistant Streptococci 156 Proportions o f Streptococci which were Susceptible, o f
Intermediate Susceptibility and Resistant to the Range o f Antibiotics Tested: Control Group at Baseline (V I) and 90 Days Later (V2). The p Value is for o f the Resistant Streptococci
Table 3.63
Table 3.64
Table 3.65
In vitro Activity o f the Antibiotics Against S. mitis:
RT Children at the Three Visits, Baseline (V I), within 2 Days Post - transplantation (V2) and 90Days Post - transplantation
(V3) 160
In vitro Activity o f the Antibiotics Against S. mitis:
Control Children at the Two Visits, Baseline (V I)
and 90 Days Later (V2) 160
Proportions o f S. mitis which were Susceptible, o f Intermediate Susceptibility and Resistant to the Range o f Antibiotics Tested: RT Group at Baseline (V I), 2 Days Post - transplantation (V2) and 90 DaysPost - transplantation (V3). The p Value is for o f the
Résistant S. mitis 161
Table 3.66
Table 3.67
Table 3.68
Table 3.69
Proportions o f S. mitis which were Susceptible, o f Intermediate Susceptibility and Resistant to the Range o f Antibiotics Tested: Control Group at the Baseline (V I) and 90 days Later (V2).
The p Value is for o f the Resistant S. mitis 161
In vitro Activity o f the Antibiotics Against S. salivarius:
RT Children at the Three Visits, At baseline (V I), within 2 Days Post - transplantation (V2)and 90 Days Post - transplantation (V3)
In vitro Activity o f the Antibiotics Against S. salivarius:
Control Children at the Two Visits, At baseline (V I) and 90 Days Later (V3)
Proportions o f S. salivarius which were Susceptible, o f Intermediate Susceptibility and Resistant to the Range o f Antibiotics Tested: RT Group at Baseline (V I), within 2 Days Post-transplantation (V2) and 90 Days Post - transplantation (V2). The p Value is for o f the Resistant
S. salivarius
165
165
167 Table 3.70 Proportions o f S. salivarius which were Susceptible, o f
Intermediate Susceptibility and Resistant to the Range o f Antibiotics Tested: Control Group at Baseline (V I) and 90 Days Later (V3). The p Value is for o f the Resistant
S. salivarius 167
Table 3.71 In vitro Activity o f the Antibiotics Against S. mutans:
RT Children at the Three visits, at baseline (V I), within 2 Days Post - transplantation (V2) and 90 Days Post - transplantation
Table 3.72 In vitro Activity o f the Antibiotics Against S. mutans:
Control Children at the Two Visits, at baseline (V I) and
90 Days Later (V3) 170
Table 3.73 Proportions o f S. mutans which were Susceptible, o f Intermediate Susceptibility and Resistant to the Range o f Antibiotics Tested: RT Group at Baseline (V I), within 2 Days Post - transplantation (V2) and 90 Days Post - transplantation (V3). The p Value is for o f the Resistant
S. mutans 172
Table 3.74 Proportions o f S. mutans which were Susceptible, o f Intermediate Susceptibility and Resistant to the Range o f Antibiotics Tested: Control Group at Baseline (V I) and 90 Days Later (V3). The p Value is for o f the Resistant
LIST OF FIGURES Chapter 2
Figure 2.1a, 2.1b, 2.1c and 2.1d: Sampling from Different Intraoral Sites
using a Calcium Alginate Swab. 66 Figure 2.2a and 2.2b: S. mutans Colonies on BMSA Plates. 69 Figure 2.3: Microtitre Tray with Carbohydrates after 24 hours Incubation. 71 Figure 2.4: Enzyme Activity using UV Transilluminator. 71 Figure 2.5: Candida Colonies on the SAB Agar Plates. 76
Figure 2.6: Gram Staining o f Candida Cells. 76
Figure 2.7: The Epsilon Zone o f Bacterial Growth Inhibition Around
an E - test Strip. 81
Chapter 3
Figure 3.1a: Linear Developmental Dental Defects in CRF Children. 95 Figure 3.1b: Hypoplastic Developmental Dental Defects in CRF Children. 95 Figure 3.2: Percentages o f Resistant Streptococcal Isolates in the Renal
Transplant Group (RT) and Control Group (C) at Baseline and
Final Visit. 157
Figure 3.3: Percentages o f Resistant S. mitis Isolates in the Renal Transplant Group (RT) and Control Group (C) at Baseline
and at the Final Visit. 162
Figure 3.4: Percentages o f Resistant S. mutans Isolates in the Renal Transplant Group (RT) and Control Group (C) at Baseline
ABBREVIATIONS
A G I Polyclonal antilymphocyte antibodies
ALG Polyclonal antilymphocyte antibodies
ALS Polyclonal antilymphocyte antibodies
BUN Blood urea nitrogen
CICHS Camden and Islington Community Health service NHS trust
CRF Chronic renal failure
CSA Cyclosporin A
dmfs Decayed, missing, filled primary tooth surfaces dmft Decayed, missing filled primary teeth
DDE Developmental defects o f enamel
DMFS Decayed, missing filled permanent tooth surfaces DMFT Decayed, missing filled permanent teeth
DNA Deoxyribonucleic Acid
EDH Eastman Dental Institute
EH Enamel hypoplasia
FAA Fastidious Anaerobe agar
GE Gingival enlargement
GOSH Great Ormond Street Hospital
HLA Human leukocyte antigen
ICH Institute o f Child Health
MAC MacConkey agar
MIC Minimum inhibitory concentration
M SA Mitis Salivarius Agar
NCCLS National Committee o f Clinical and Laboratory Standards OKT3 Monoclonal antilymphocyte antibodies
PTH Parathyroid hormone
RNA Ribonucleic Acid
RT Renal transplant
Chapter 1
CHAPTER 1
1. INTRODUCTION
The kidney is an essential multifunction organ that maintains fluid and electrolyte balance and regulates the acidity o f the body and the excretion o f body wastes. The kidneys are also involved in the production and metabolism o f a number o f hormones including vitamin D, renin, erythropoietin and prostaglandins.
1.1 Chronic Renal Failure
Chronic renal failure (CRF) results from progressive and irreversible renal damage manifested by the reduction o f the glomerular filtration rate. The condition is caused by a variety o f aetiological factors such as chronic glomerulonephritis, chronic pyelonephritis, congenital renal anomalies, hypertension and diabetes. A detailed classification o f the causes o f CRF is shown in Table 1.1. End stage renal failure has low prevalence in children. The UK Renal Registry reported a total number o f 775 patients less than 18 years o f age in the year 1999 (Ansell et al. 1999).
The loss o f renal function is attended by adaptive renal and metabolic responses, w hich lead to the development o f clinical signs and symptoms as loss o f function progresses. Detailed investigations are needed to assess the severity o f CRF. These investigations include full blood counts, electrolytes, urea, creatinine, calcium and parathyroid hormone levels. The glomerular filtration rate is a useful measurement in m ild and moderate, but not severe, CRF. Radiographs can also be taken o f the left hand, wrist and chest to assess bone age and any evidence o f renal osteodystrophy. An echocardiogram or ECG is also done (Rigden, 1994).
Table 1.1: Classification o f the causes o f CRF
Localised Causes Lower Urinary Tract Obstruction
Proliferative glomerulonephritis Upper urinary tract obstruction
Membranous glomerulonephropathy Chronic pyelonephritis Tuberculous pyelonephritis Renal calculi Congenital nephritis Polycystic disease
Medullary cystic disease
Renal hypoplasia
Renal tubular acidosis
Balkan nephropathy Prostatic enlargement Adenoma Neoplasm Urethral Stricture Urethral valves Neurogenic bladder
Bladder neck obstruction
Systemic Diseases
Polyarteritis nodosa
Hypertension
Lupus erythematosus
Amyloidosis
Analgesic over - consumption
Potassium deficiency
Hypercalcaemia
Cystinosis
Oxalosis
Consumption coagulopathies
Lead or cadmium poisoning
Atheroma
Systemic emboli
Subacute bacterial endocarditis
Rheumatic heart disease
Gout
Diabetes
Heart failure
Cirrhosis
(Modified from Kerr, 1975)
1.1.1 Medical Management o f Patients with CRF
There are points to be considered in the management o f CRF in children and these are the following (Rigden, 1994):
1.1.1 A Growth
Children with CRF have height velocity below the normal range for their age.
1.1.1.2 Nutrition
M alnutrition is a well-recognised problem in children with CRF (Borradori et al.
1999). These children tend to be anorexic with spontaneous energy intakes frequently below the estimated average requirement for age. Some children with CRF may need to be fed via nasal tubes or gastrostomy tubes.
All patients with CRF should be supervised by a nutritionist. Glucose polymers and fat emulsions as calorie supplements are usually given. The patients are required to limit intake o f cows’ milk to less than half a pint a day and avoid cheese and yoghurt to maintain the plasma phosphate in order to prevent secondary hyperparathyroidism. They are usually given calcium carbonate as a phosphate binder.
1.1.1.3 Fluid and Electrolytes
Children with renal dysplasia or obstructive uropathy are likely to become salt
depleted, which is detrimental to growth. Therefore, sodium chloride supplements are given with caution to improve growth to prevent the development o f oedema,
hypertension or hypematraemia. Water intake is not limited and is determined by the child to satisfy thirst.
1.1.1.4 Metabolic A cidosis
Persistent metabolic acidosis can contribute to bone demineralisation and
hyperkalaemia. Therefore maintaining acid - base equilibrium is very important in children. Sodium bicarbonate is usually given to correct metabolic acidosis.
1.1.1.5 Renal Osteodystrophy
Plasma calcium, phosphate and alkaline phosphate are measured at each clinical visit. Vitamin D DHCC) can be introduced and increased or decreased to maintain the appropriate plasma calcium level between each visit. Parathyroid hormone levels are also monitored and therapy is adjusted accordingly.
1.1.1.6 Hypertension
Hypertension may lead to progression o f CRF. Therefore, blood pressure control is important. Salt restriction and dialysis will control high blood pressure, but
1.1.1.7 Anaemia
CRF is associated with a normochromic, normocytic anaemia o f variable severity. Chronic renal failure children may need recombinant human erythropoietin therapy to maintain satisfactory haemoglobin levels. Iron and folic acid supplements are also given if indicated.
1.1.1.8 Infection
Infection is common in uraemic patients (Goldman and Vanherweghem, 1990). It is a frequent cause o f morbidity and mortality in patients receiving haemodialysis. The altered cellular immunity in chronic systemic uraemia along with malnutrition, which diminishes the ability to produce antibodies, can all result in an immunodefrcient state in these patients (Keane et a l 1977; Gabriel, 1984). Recurrent urinary tract infections are common in children with CRF and antibiotic cover is needed in these cases. Furthermore, the normal oral micro flora is considered a possible source o f local and systemic infections (Naylor et a l 1988). Both oral disease and dental manipulation may cause bacteraemia that would lead to significant morbidity and potential mortality in patients with renal failure. In addition infective endocarditis was reported in these patients. It was documented in 2.7% o f patients with CRF during haemodialysis and in 9% o f those who have an infection o f a vascular access site (Leonard et a l 1973; Reid and Rahimtoola, 1984). Viridans streptococci and enterococci account for 17% and 13% o f infective endocarditis in haemodialysis patients (Cross and Steigbigel, 1976).
1.1.1.9 Dialysis
There is no specific indication for the initiation o f dialysis unless the creatinine clearance reaches 5 - 10mFmin/1.73m^. Non - specific symptoms o f CRF, such as nausea, fatigue, decreased appetite, poorly controlled hypertension, renal
osteodystrophy and poor growth contribute to the physician’s decision to initiate dialysis (Fine and Tejani, 1994).
1.1.1.9.1 Peritoneal Dialysis
Peritoneal dialysis is based on the concept o f diffusion across the peritoneal membrane allowing the removal o f excess toxic molecules present in the bloodstream when an ideal aqueous solution is instilled in the peritoneal space. This was first used in the late 1940s (Bloxsom and Powell, 1948; Swan and Gordon,
1949). One o f its advantages is convenience. It allows for steady metabolic control, there is less restriction to dietary and fluid intake and it can be performed in the community. In paediatric patients the favoured method o f dialysis is continuous ambulatory peritoneal dialysis (Evans et a l 1995). Chronic ambulatory peritoneal dialysis is performed at home by exchanging 2 litres o f dialysis fluid four times a day with each cycle remaining intraperitoneally for 4 - 6 hours. It takes 30 minutes per exchange o f fluid dialysis and therefore occupies up to 3 hours/day (Rigden, 1994).
1.1.1.9.2 Haemodialysis
Haemodialysis uses extracorporeal perfusion for the transfer o f fluids and solutes by diffusion and ultra filtration between blood and dialysate. Infection and thrombosis are significant risks associated with this type o f dialysis, as catheter access to the subclavian, internal jugular or femoral vein is required (Evans et a l 1995).
Haemodialysis is usually performed three times a week for 4 - 6 hours in the dialysis ward (Rigden, 1994).
1.2 Renal Transplantation
Renal transplantation is the optimal option for treatment o f patients with end stage renal failure. The total number o f kidney transplants carried out in the UK and Republic o f Ireland in 1995 was 1920 (UKTSA report, 1996).
1.2.1 The Transplant
The presence o f pre - formed antibodies in the host reacting to the antigens on the donor kidney is an important hindrance to the success o f transplantation (Allen and Chapman, 1994). The ABO blood group and the HLA antigens are the most
important factors in the rejection o f the transplanted kidney. A cross match is carried out to assess the potential recipient’s sensitivity to a specific donor. The recipient’s serum is tested against the donor lymphocytes and a positive result indicates that the recipient has antibodies directed against donor cells. Consequently, hyperacute rejection o f the transplanted kidney may result (Bereket and Fine, 1995).
1.2.2 Factors Related to the Recipient
1.2.2.1 Age
The recipient’s age is considered to be an important factor in the prognosis o f both live - related donor and cadaveric donor grafts. The one year survival rate after live - related - donor transplantation is 77% for the 0 to 1 year age group, 83% for the 2 to 5 year age group, and 86% for those aged more than 6 years. For cadaveric - donor graft, these rates are 49%, 65% and 70%, respectively (Bereket and Fine, 1994; Grimm and Ettenger, 1992).
1.2.2.2 Underlying Disease
Underlying disease can affect the success o f the transplant, as some primary diseases such as focal segmental glomerular sclerosis and membranoproliferative
glomerulonephritis, may recur in the graft resulting in their damage and loss (Fine and Ettenger, 1994).
1.2.2.3 Immune Responsiveness
1.2.3 Donor Considerations
1.2.3.1 Donor age
The ideal donor age was reported to be between 13 and 20 years (Hardy et a/. 1994). The use o f paediatric donors is a controversial issue, as many reports bave shown decreased graft survival and increased incidence o f complications w ith the use o f cadaver donor grafts from children under 10 years o f age (Fine and Ettenger, 1994).
1.2.4 Drugs Used in Renal Transplantation
Corticosteroids, azatbioprine and cyclosporin form the bulk o f immunosuppressive therapy (Ettenger et al. 1992; Grimm and Ettenger, 1992; Bereket and Fine, 1995).
1.2.4.1 Corticosteroids
The corticosteroids decrease the growth and differentiation o f T - lymphocytes and B - lymphocytes. They also act as non - specific anti - inflammatory and
immunosuppressive agents. Prednisolone and methylprednisolone are the most frequently used corticosteroids in renal transplant patients. Long - term use o f corticosteroids has many adverse side effects in renal transplant children, such as growth impairment and increased susceptibility to infection. In addition,
corticosteroids can cause aseptic necrosis o f the bone, cataracts, Cushingoid appearance, glucose intolerance, hypertension, hypertrichosis and peptic ulcer.
1.2.4.2 Azathioprine
L2.4.3 Cyclosporin A
Cyclosporin A (CSA) has played a significant role in increasing organ transplant survival rates in the past 10 years. It is currently considered to be one o f the most important immunosuppressive agents used to prevent rejection in transplant patients (Kahan, 1989). CSA prevents early T - lymphocyte production and decreases their response to Interleukin -2 (Wahrenberger, 1995).
W hen compared with adults, children have been shown to have faster elimination o f CSA. Therefore, higher doses o f CSA at more frequent intervals are needed to achieve adequate immunosuppression in young children (Hoyer et al. 1984).
Nephrotoxicity and renal dysfunction are the most significant side effects o f CSA. Liver dysfunction can also occur. Hypertension is seen in more than 80% o f patients treated with CSA. Treatment with CSA has also been associated with gingival enlargement (GE), which develops during the first six months o f commencing therapy and reaches the plateau phase in 9 to 12 months (Tyldesley and Rotter 1984; Daley et al. 1986; Wondimu et a l 1993; Karpinia et a l 1996).
1.2.4.4 F K 506
FK 506 (Tacrolimus), a potent immunosuppressing drug, is relatively new and its use is limited to a few hospitals (Laskow et a l 1998). Intensive studies from different countries showed 74 - 98% initial success rate for tacrolimus rescue therapy o f rejected kidneys in patients treated with CSA. Its therapeutic activity is similar to that o f CSA. The major disadvantages o f FK 506 are nephrotoxicity, diabetogenicity and neurotoxicity. However, gingival enlargement was reported to be less common with FK 506 than with CSA (Spencer et a l 1997).
1.2.4.5 Antilymphocyte Antibodies
Antilymphocyte antibodies deplete T - cells from the circulation. There are two forms available, monoclonal (0K T 3) and polyclonal (ALS, ATG and ALG)
Ettenger et a l 1992). The side effects o f 0K T 3 are non - cardiogenic oedema, fever, bronchospasm, diarrhoea, headache, vomiting, polyserositis, and septic meningitis. The side effects o f polyclonal antibodies range through allergic reaction, serum sickness, neutropenia, thrombocytopenia, and increased susceptibility to infection.
1.2.5 Post - transplant Medical Complications
1.2.5.1 Hypertension
Hypertension is a very common problem in renal transplant recipients. The
prevalence o f post - transplant hypertension has been reported to be as high as 85% (Broyer 1987; Tejani, 1983).
1.2.5.2 Infections
Infections (by bacteria, viruses or fungi) are the m ajor cause o f morbidity and death in renal transplant patients mainly due to the use o f immunosuppressive drugs. Most o f the life - threatening infections occur during the first six months after
transplantation (Naylor et a l 1988). Staphylococcus aureusand Escherichia coli
infections are common during the first few weeks after transplant. Klebsiella,
Pseudomonas aeruginosaand bacteriodeswere found to be the most frequent causes o f death in 16 renal transplant patients (Tapia et a l 1973). Candida albicans and cytomegalovirus were other contributing causes o f death in these patients.
Furthermore, viral infections caused by cytomegalovirus, herpes virus and varicella - zoster virus are the most important complications o f organ transplantation.
Cytomegalovirus can affect more than 70% o f transplant recipients (Hibberd and Rubin, 1991). Post - transplantation pulmonary infections can also be a serious problem and some o f the organisms responsible for these infections are Legionella,
cytomegalovirus, Nocardia, Aspergillus, Mycobacterium tuberculosisand most importantly, Pneumocystis carinii(Bereket and Fine, 1995).
patients who underwent renal transplantation, 57% developed infection within the first month after transplantation with a similar frequency in males and females. In these patients the infection was identified more frequently in the head and neck region (31%) than the three other infected sites, which were the urinary tract (24%), respiratory tract (22%) and sites related to trauma (10%) (Stoufi et a l 1986).
1.2.5.3 Aseptic Bone Necrosis
Corticosteroid therapy and hyperparathyroidism have been implicated in the pathogenesis o f aseptic necrosis although the exact cause is unknown. It was reported to occur in 6 - 21% o f paediatric allograft renal transplant recipients (Hely et al 1982; Uittenbogaart et a l 1978).
1.2.5.4 Malignancies
The risk o f lip and skin carcinomas is higher in transplant recipients than in the general population (Wahrenberger, 1995). In children receiving renal transplant allografts lymphomas are the most common tumours. The use o f ALG and 0K T3 have been implicated in the pathogenesis o f tumour development (Cockfield et a l
1991), as have multidrug regimens and sequential immunosuppression (Melosky et a l 1992).
1.3 Oral Manifestations
1.3.1 Saliva in Renal Failure Children
The saliva content and rate o f flow are usually affected by renal failure. One study (Shasha et a l 1983) reported significantly higher salivary proteins, potassium and sodium and significantly less calcium and magnesium in the unstimulated saliva o f haemodialysed adult patients compared to healthy volunteers. The haemodialysis caused a significant decrease in salivary concentrations o f proteins, potassium, sodium and phosphate but no change in calcium and magnesium.
be higher in dialysis patients in all four secretions examined. These were both unstimulated and stimulated parotid saliva and unstimulated and stimulated sub - mandibular saliva.
In another study (Kho et a l 1999) the flow rates o f unstimulated whole and stimulated parotid saliva were decreased in 22 patients receiving haemodialysis in comparison with healthy volunteers. On the other hand, the pH and buffer capacity o f the unstimulated whole saliva were increased in the haemodialysis patients, but the stimulated parotid saliva showed no significant difference.
The urea and ammonia concentrations were studied in nine dialysis patients aged 7 - 1 4 years, who were found to be caries - inactive since the onset o f their renal insufficiency (De Stoppelaar and Van Damme, 1979). On average, the urea and ammonia concentrations in stimulated saliva were higher in the children with renal failure (65mg/100ml) than that in healthy children (27mg/100ml). There was no significant difference in the composition o f plaque flora in the two groups o f children, suggesting that the high levels o f ammonia were the cause o f their caries resistance.
1.3.2 Oral Manifestations in Patients with CRF
The oral manifestations o f renal insufficiency were first described by Frerichs, (1851). The oral signs and symptoms o f the CRF condition were reported in many studies. These may include ammonia - like smell, dysgeusia, stomatitis, gingivitis, decreased salivary flow, xerostomia and parotitis (Carlin and Seldin, 1969; Dahlberg
et a l 1967; Epstein et a l 1980; Halazonetis and Harley, 1967; Hovinga et a l 1975).
Renal osteodystrophy is a common problem in renal failure patients resulting from inability o f the kidney to form the vitamin D metabolite that is essential for calcium absorption. The consequence o f the body’s inability to absorb calcium can lead to hyperparathyroidism, which is associated with maxillary and mandibular
o f the body o f the mandible superior to the mandibular canal (Carl and Wood, 1976; Chow and Peterson, 1979; Sampson and Meister, 1984; Sowell, 1982; Westbrook
1978). Other oral manifestations include tooth mobility, malocclusion, and metastatic soft tissue calcification. Socket sclerosis, which is abnormal bone remodelling after extraction, is commonly seen in patients with CRF (Burrel and Goepp, 1973). In addition, the incidence o f pulp calcification is very high in
transplant patients and even more apparent in haemodialysis patients (Hutton, 1985).
A correlation between salivary urea levels and blood urea nitrogen (BUN) has been reported (Dahlberg et a l 1967). The elevation o f BUN over 150mg/L (normal range
10 - 20) was shown to correlate with the occurrence o f uraemic stomatitis, which manifests as red mucosa covered with a thick pseudomembrane or as an ulcerative form also with a pseudomembrane. The onset o f uraemic stomatitis is from a few days after BUN elevation and the resolution at two to three weeks after the BUN level returns to normal.
Another very common problem is enamel hypoplasia (EH), which is fi*equently seen in patients with renal disease (Woodhead et a l 1982; Jaffe et a/. 1986; Nunn et a l
2000). The location o f the hypoplastic enamel in the permanent teeth corresponds with the age o f onset o f CRF. The EH was attributed to the poorly formed enamel produced by ameloblast disruption due to numerous systemic insults. These included hypocalcaemia along with decreased serum levels o f 1,25 dihydroxycholecalciferol and raised serum levels o f inorganic phosphate and serum parathyroid hormone (Woodhead et a l 1982). Elevated serum fluoride level causing fluorosis may be an aetiological factor in the development o f dental defects in children with CRF, as the kidneys play an important role in removing the inorganic fluoride fi*om the body (Warady et a l 1989). Warady et a l have stated that the usual dietary loads o f fluoride would be excreted until the creatinine clearance decreased to
25ml/min/1.73m^ and that fluoride clearance in children with mild CRF
Low caries incidence has been reported in various studies (Chow and Peterson, 1979; Sowell, 1982; Sampson and Meister, 1984; Jaffe et a/. 1986; Nunn et a l 2000). In an effort to understand the low prevalence o f caries in patients with CRF the properties o f saliva and dental plaque affecting the caries process were investigated (Peterson et a l 1985). This study demonstrated that plaque pH correlates directly with salivary urea nitrogen concentration. The pH was found to be significantly more alkaline in patients with CRF compared to two other groups o f renal transplant children and healthy children. The children with CRF had significantly less dental caries than the renal transplant and healthy children. The absolute pH drop fi’om base line following carbohydrate exposure was not different between the three groups o f children, even though the baseline plaque pH was increased in subjects with CRF.
It was suggested that transplant patients are different from patients with CRF as they may be at increased risk o f caries (Peterson et a l 1985).
1.3.3 Oral Manifestations in Renal Transplant Patients
As lifelong immunosuppression therapy is essential for renal transplant recipients, infection is one o f their primary health concerns. Acute and chronic oral infections or bacteraemia associated with dental procedures can result in serious complications where resistance to infection is already low (Eigner et a l 1986). Therefore, sources o f infection must be eliminated before transplantation. Diagnosis o f infection can be difficult in renal transplant patients due to the inflammation - suppressing action o f steroids.
Thrush - like oral lesions were reported in seven immunosuppressed renal transplant patients. Although these lesions resembled candidal thrush, they were proved to be associated with bacterial growth and not with Candida (Tyldesley et a l 1979). The involved bacteria were staphylococci, streptococci. Neisseria, Coliforms and Lactobacilli.
medication (Schuller et a l 1973; Oshrain et a l 1979). A later study demonstrated a statistically significant correlation between plaque and gingivitis scores in such patients and that patients taking immunosuppressive drugs had less gingivitis than control patients with similar amounts o f dental plaque (Kardachi and Newcomb, 1978; Tollefsen and Johansen, 1985a). It has been suggested that the small size o f the groups studied and the different systems o f scoring used may explain these discrepancies. Immunosuppression does not appear to aggravate periodontal disease (Tollefsen and Johansen, 1985b).
Another common finding in renal transplant patients is gingival enlargement induced by the immunosuppressive drug cyclosporin A and / or Nifedipine, which are
commonly used in all patients undergoing organ transplantation (Seymour and Jacobs, 1992). The development o f cyclosporin A induced gingival enlargement has been reported to be positively correlated to the plasma concentration o f the drug during the first six months (Starzl et a l 1981; Seymour et a l 1987). The cyclosporin A induced gingival enlargement ranged fi*om 24% to 81% in adult renal transplant patients (Phillips et a l 1988; Friskopp and Klintmalm, 1986). It was reported that adults with blood cyclosporin A trough levels o f greater than 400pg/ml were at significantly greater risk o f developing gingival enlargement than subjects with lower levels (Hefii et a l 1994). Cyclosporin A is directly secreted fi*om the salivary glands into the oral cavity and individual variations in salivary cyclosporin A levels have been reported (McGaw et a l 1987). However, it was reported that FK506 (tacrolimus), would have less effect on the gingivae (Spencer et a l 1997; Thorpe et a l 2000).
There is little to be found in the literature on the prevalence and duration o f cyclosporin A induced gingival hyperplasia in children and adolescents, although studies have reported a 13 - 85% occurrence o f gingival hyperplasia in young
patients on cyclosporin A therapy (Tejani 1987; Saravia et a/. 1990; Seow et al 1991; W ondimu et a l 1993; Allman et a l 1994). It was reported that drug induced
enlargement has been positively related to the total dose o f the drug administered to renal transplant children during the first six months post - transplant (Wondimu et a l
1993).
Nifedipine has been shown to cause gingival enlargement after the first month o f administration. Most changes will occur within the first nine months o f therapy (Tagawa et a l 1989; James and Linden 1992). The prevalence o f gingival enlargement associated with nifedipine therapy is controversial and has been reported in the literature as between 14.7% and 83% (Tagawa et a l 1989; Fattore et a l 1991; Akimoto et a l 1991; Burkes and Stevens, 1992). There was an increase in the severity and incidence o f gingival enlargement in renal transplant patients when combining both cyclosporin A and nifedipine (Thomason et a l 1993). It is unclear if the drugs are acting synergistically or additively (Seymour, 1991).
The development o f cyclosporin A induced gingival enlargement is associated with increased plaque accumulation (Daley et a l 1986; M cGaw et a l 1987; Allman et a l
1994). Although many studies have shown a correlation between gingival enlargement and oral hygiene, it is not known whether poor oral hygiene is a consequence or a cause o f gingival enlargement (Seymour et a l 1994). The
1.4
Oral Microflora
The oral cavity harbours a large and variable microbial population. The oral microflora is associated with a number o f oral diseases such as dental caries and periodontitis and is the source o f opportunistic pathogens associated w ith infection in immunocompromised patients (Marsh and Martin, 1992). Little is known about the composition o f the oral micro flora in children with renal failure and their associated problems.
1.4.1 Fungal Species
Candida is the most common fungal genus isolated from the oral cavity. Candida
species are associated with two main diseases in the oral cavity, candidiasis and caries, with host factors being important in the pathogenesis o f oral candidosis (Marsh and Martin, 1992). Patients treated with corticosteroids have an increased susceptibility to fungal infections (Frenkel, 1962). Fungal infections represent 9% to 14% o f systemic infections following renal transplantation (Gallis et a l 1975) and C. albicanswas found to cause death in renal transplantation patients (Tapia et a l
1973).
It was reported that C. albicans,which is the principal fungal species associated with oral infections, is capable o f colonising saliva - coated surfaces as well as its ability to adhere to several oral streptococci species including S. gordonii, S. oralis and S. sanguinis (O ’Sullivan et al.2000).
The prevalence o f the oral carriage o f yeasts in healthy volunteers varied from 2% to 71% with a median o f 34% (MacFarlane, 1990). In Chinese subjects in Hong Kong the yeast prevalence was 24% (Sedgley and Samaranayake, 1994) and in a similar study in the UK it was 21% (Samaranayake et a l 1989). An increased prevalence o f oral yeast carriage was reported in patients who are medically compromised (Odds, 1988; Samaranayake, 1990), patients who are HIV - positive (Pindborg, 1989) and individuals with denture stomatitis (Budtz - Jorgensen, 1990). The isolation frequency o f oral yeast in children in hospitals was reported as 46% (Marks et a l
An investigation o f 265 living related renal allograft recipients receiving
immunosuppressive drugs demonstrated an increased risk o f developing oesophageal candidiasis. O f these, 42.9% had oral thrush (Gupta e /a/. 1994). It was also
reported that Candida from the oral cavity can colonise the stomach and silicone gastrostomy feeding tubes, which may cause deterioration o f the tubes (Gottlieb and Mobarhan, 1994). It was also assumed that the gastrostomy tubes used for 20
malnourished patients were probably colonized by oral Candida as the species isolated from each site was identical (Gottlieb et al. 1994).
1.4.2 Lactobacilli
Lactobacilli are commensal organisms in humans. Lactobacilli are associated with the aetiology o f dental caries, rheumatic vascular disease, septicaemia and infective endocarditis. Lactobacilli have been identified as relatively virulent pathogens causing bacteraemia in immunocompromised and seriously ill patients, particularly those receiving broad-spectrum antibiotic therapy (Husni et a l 1997). In children aged less than 2 years, oral lactobacilli have been isolated in low numbers and are transient colonisers (Carlsson et al. 1975). However, other workers have reported significant counts o f lactobacilli at a very early age (McCarthy et a l 1965; Onisi et a l 1959).
Although lactobacilli constitute a small proportion o f the total oral flora, their
1
.
4.3 EnterobacteriaceaeMembers o f the family Enterobacteriaceae are transient oral colonisers. The acquisition o f Enterobacteriaceaecan also be from exogenous sources like water, food, the hands o f hospital personnel or even hospital equipment (Shanson, 1989). Their colonisation can be influenced by several factors. Enhanced colonisation o f certain Enterobacteriaceae species by the presence o f Candida albicanshas been reported (Sedgley et a l 1996). These Gram - negative bacilli have been isolated from the oral cavity o f both healthy and sick individuals. The prevalence has been reported to be 4% in two different studies. One included a group o f 25 healthy
Malaysian children (Philpot eta/. 1980) and another consisted o f 490 healthy children in M innesota (Hable eta/. 1971). Another study showed a slightly higher prevalence (16%) in 50 healthy children in Scotland (Ross, 1971). However, in a later study no
Enterobacteriaceaewere isolated from 20 healthy children (Scully and MacFarlane, 1983).
In medically - compromised children a wide variation in the prevalence o f
Enterobacteriaceaehas been shown. In the study o f 25 Malaysian children with pharyngitis the prevalence o f Enterobacteriaceaein samples taken from the posterior pharynx and tonsillar area was 12% (Philpot et a l 1980). However, in samples from the same site taken from children with acute upper respiratory illness the prevalence was greater than 5% (Hable et a l 1971). In another study o f 44 oncology patients aged from 1 year to 16 years, in remission and attending an outpatient clinic, no
Enterobacteriaceaewere detected in swabs taken from the floor o f the mouth, dorsum o f the tongue and upper right buccal vestibule (Scully and MacFarlane, 1983). A low incidence was reported in a later study that investigated the oral microflora o f children with acute leukaemia undergoing cytotoxic treatment. Gram - negative bacteria were isolated from only 7 out o f 34 children during treatment and maintenance phases and during an infection episode (O ’Sullivan et a l 1993). In a more recent study on liver transplant children, Enterobacterspecies and an unidentified Gram - negative bacillus were isolated from only one o f the 27 patients included in this study (Sheehy et a l
The length o f hospitalisation and antibiotic administration were not found to be related to the increased prevalence o f aerobic Gram - negative bacilli in physically ill or moribund patients (Johanson et a l 1969). In contrast, a later study showed that hospitalisation and attendant treatment procedures may result in increased oral and oropharyngeal colonisation by Enterobacteriaceae. The prevalence o f
Enterobacteriaceaewas 57% o f 14 patients hospitalised for more than 2 months compared to 24% o f 17 patients hospitalised for one to three days (Wahlin and Holm,
1988). In addition, similar observations were reported by other workers (Sedgley et a l
1995). The study showed a higher prevalence o f Enterobacteriaceaein adult patients hospitalised for longer than 15 days compared to those hospitalised for 8 to 15 days.
1.4.4 Enterococci
Enterococci are found mainly in the gastrointestinal tract and temporarily in the vagina, oral cavity and dental plaque. Enterococci may be isolated from the healthy human mouth but only as a minor proportion o f the total streptococcal flora (Hardie and Bowden, 1974).
Enterococci are associated with factors that may correlate with pathological changes in the host. For example, E. faecalis,which is the most commonly isolated enterococci in the oral cavity, produces sex pheromones and plasmid encoded pheromone inhibitors, which are chemotactic for polymorphonuclear leukocytes in vitro. They can also produce a plasmid - encoded haemolysin associated w ith increased severity o f infection. In addition, enterococci are capable o f inducing platelet aggregation and tissue factor - dependent fibrin production, which may be relevant to the pathogenesis o f enterococcal endocarditis (Johnson, 1994). Enterococcal endocarditis has been reported in two patients on haemodialysis following dental scaling (Goodman et al.
1969, W yler et a l 1972).