Article
1
Rapidity of genomic adaptations to prasinovirus
2
infection in a marine microalga
3
Sheree Yau1,2, Gaëtan Caravello1,2, Nadège Fonvieille1,2, Élodie Desgranges1,2, Hervé Moreau1,2
4
and Nigel Grimsley 1,2,*
5
1 Integrative Biology of Marine Organisms Laboratory (BIOM), CNRS UMR7326, France;
6
[email protected] (S.Y.); [email protected] (G.C.); Nadège Fonvieille;
7
[email protected] (N.F.); Élodie Desgranges;
8
[email protected] (É.D.); [email protected] (H.M.)
9
2 Sorbonne University, OOB, Avenue de Pierre Fabre, 66650 Banyuls-sur-Mer, France
10
* Correspondence: [email protected]; Tel.: +33-4-6888-7396
11
12
Abstract: Prasinoviruses are large dsDNA viruses commonly found in aquatic systems worldwide,
13
where they can infect and lyse unicellular prasinophyte algae such as Ostreococcus. Host
14
susceptibility is virus strain-specific, but resistance of susceptible Ostreococcus tauri strains to a
15
virulent virus arises frequently. In clonal resistant lines that re-grow, viruses are usually present for
16
many generations, and genes clustered on chromosome 19 show physical rearrangements and
17
differential expression. Here, we investigated changes occurring during the first two weeks after
18
inoculation of viruses. By serial dilutions of cultures at the time of inoculation, we estimated the
19
frequency of resistant cells arising in virus-challenged O. tauri cultures to be 10-3–10-4 of the
20
inoculated population. Re-growing resistant cells were detectable by flow cytometry 3 days
post-21
inoculation (dpi), visible re-greening of cultures occurred by 6 dpi, and karyotypic changes were
22
visually detectable at 8 dpi. Resistant cell lines showed a modified spectrum of host-virus
23
specificities and much lower levels of OtV5 adsorption.
24
Keywords: Ostreococcus tauri; Mamiellophyceae; Phycodnaviridae; resistance; karyotype;
25
rearrangement; chromosome; specificity; host range; adsorption
26
27
1. Introduction
28
Although the first prasinovirus was discovered in over 40 years ago [1], complete genomes of
29
some of these abundant [2,3] large dsDNA viruses have become available only over the last 10 years
30
[4–9]. Complete genomes of several of their tiny eukaryotic unicellular host algae have also been
31
sequenced [10–14] and these species can be grown in culture, permitting genome-based physiological
32
analyses of these ecologically important host-virus interactions to progress[15–17]. Using
33
ostreococcus tauri virus 5 (OtV5), and its host microalga Ostreococcus tauri, we observed recently by
34
transcriptomic analyses that in diurnal 12 h day – 12 h dark laboratory-grown cultures, prasinovirus
35
gene expression was low in the day but much higher in the night, the majority of cells lysing the
36
following morning [15], giving a more complete overview of this host-virus life cycle. Viral gene
37
transcripts were much more abundant in the night, when host cells remained intact and 4% of host
38
genes were differentially expressed. Previous work showed that host resistance to viral lysis arises
39
frequently in culture in different species of the Mamiellophyceae [18], and that this resistance was
40
stable in culture over a period of 3 years, although a slight reduction in the fitness of these strains
41
was detectable. Some of the clonally resistant lines produced free of virus particles, while others
42
produced viruses. Yau et al [19] further investigated this phenomenon on a molecular level using a
43
set of 38 independently produced virus-resistant clonal lines alongside 8 control susceptible lines,
44
maintaining all lines in parallel. Transcriptomic RNA-Seq analyses of the cell lines revealed
45
differential expression (DE) of genes encoding glycosyltransferases, protein modifications,
46
transporters, and DNA-modifying enzymes. Surprisingly, a disproportionate number of DE genes
47
were localised on chromosome 19 and karyotypic analyses revealed that large-scale rearrangements
48
of chromosome had occurred in OtV5-resistant lines. Many overexpressed genes were clustered in a
49
150 kb long region of chromosome 19 [19]. This work required the maintenance of clonal lines over a
50
long period in order to obtain sufficient material for individual karyotype analyses and replicates for
51
RNA-Seq comparisons, but in each clonal line resistance was acquired within a week of OtV5
52
inoculation. Here, we investigate the rapidity of and frequency of genetic changes occurring in the
53
host alga more closely in the two weeks following OtV5-inoculation and test the effects resistance on
54
viral specificity and binding on the set of previously produced resistant lines.
55
2. Materials and Methods
56
2.1. Culture conditions
57
Host and viral cultures were grown in L1 medium (Bigelow Lab., NCMLA, USA) under a 12h
58
light / 12h dark photoperiod at 80–100 μmol photon m-2 s-1 white light at 20°C. The algal strain
59
RCC4221 (Roscoff Culture Collection, France), a recently resequenced [11] clonal isolate of the
wild-60
type sequenced O. tauri strain [10] that was previously known as RCC745, or at the time of isolation
61
as OTH0595 [20,21], was used as the OtV5-susceptible control throughout. Bathycoccus prasinos
62
RCC1105, and Picochlorum sp. RCC4223 were grown under identical conditions to those used for O.
63
tauri. The virus strains used have been described previously [22] and were routinely used at MOI 5
64
on exponentially growing O. tauri cells to produce lytic infections. Host cell densities were measured
65
using a BD FACSCanto II flow cytometer (BD Biosciences). Cellular autofluorescence of chlorophyll
66
[23] was used to assess the number of viable algal cells.Specifity of viral strains to host strains was
67
assayed by depositing 2 μl of viral lysate onto the host or test strain grown in a petri dish with L1
68
solidified with 0.15% agarose as previously described [22].
69
2.2. Karyotype analysis
70
Algal cells were grown to a density of about 2 x 10⁷ cells.mL-1, 8.7 × 10⁷ cells were pelleted by
71
centrifugation (8000 g for 20 min), resuspended 100 μl TE buffer (10 mM Tris-HCl, 125mM EDTA,
72
pH 8) and embedded in plugs by mixing with an equal volume of molten low melting point agarose
73
(1% in TE buffer precooled to 45ºC). Karyotype analysis was then done using pulsed field
74
electrophoresis as previously described [19,24].
75
2.3. Virus adsorption assay.
76
The protocol developed by Meints et al [25] was adapted to suit our system. One hundred mL
77
of cultures of the different algae (O. tauri susceptible or resistant strains, Bathycoccus sp. or Picochlorum
78
sp.) were grown up to around 2 x 10⁷ cells.mL-1. Cultures were then centrifuged and pellets
79
resuspended to obtain a final concentration of 109 cells.mL-1. Adsorptions of OtV5 to the different
80
strains/species were assayed in 1 ml volumes of culture medium containing 109 host cells and 107
81
Plaque forming units (PFU) of virus (MOI 0.01). Samples were incubated for 30 min at 20°C and the
82
reactions were stopped by a centrifugation 10,000 g 10 min. Supernatants were quickly transferred to
83
fresh tubes and viral PFU measured by plating [4]. The data are expressed as the percentage of
84
unadsorbed virus..
85
3. Results
86
3.1. Resistant cells grew 3 days after virus inoculation.
87
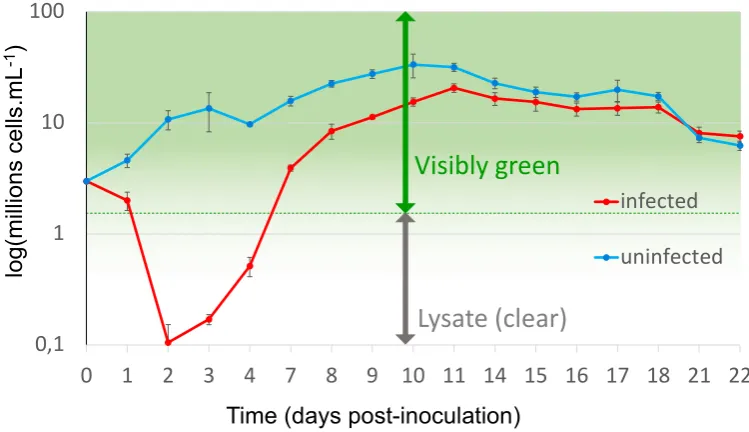
After inoculation with OtV5, the number of viable cells of O.tauri decreased from 2.98 x 10⁷
88
inoculation) and 1.05 x 10⁶ ± 4.76 x 10⁵ cells.mL-1 at 48 hpi. At the same time, cell densities increased
90
in control cultures from 2.98 x 10⁷ cells.mL-1 to 4.59 x 10⁷ ± 6.34 x 10⁶ cells.mL-1 (n = 3) at 24 hpi and
91
1.07 x 10⁸ ± 2.11 x 10⁷ cells.mL-1 at 48 hpi, consistent with about one cell division per day. However,
92
on the 3rd day (72 hpi), the average number of viable cells in infected cultures increased (Figure 1),
93
with an overall (n = 5) mean of 1.70 x 10⁶ ± 1.78 x 10⁵ cells.mL-1 and by the 4th day all of the 5 cultures
94
were re-growing despite the presence of an excess of infectious virus particles (as measured by PFU
95
plated on the susceptible host strain, data not shown). Moreover, duplicate aliquots of these regrown
96
virus-inoculated cultures did not lyse compared to non-infected controls when re-infected with OtV5.
97
These cells were thus virus-resistant. Furthermore, the virus-resistant cells grew at more than 1
98
division per day over the following 3 days (Figure 1), confirming that their fitness must be close to
99
that of the wild-type strain. In this experiment, the inoculated cultures appeared as cleared lysates for
100
a period of about 4 days before they started to re-green, in agreement with previous observations
101
[18].
102
103
Figure 1. Host cell dynamics during a lytic infection. Each point represents an average from 5
104
independent cultures of O. tauri. Lysis occurs over two days following OtV5 inoculation, but at 3 days
105
post-inoculation (dpi) OtV5-resistant cells observed by flow cytometry were growing, visible
re-106
greening of the cultures occurring by 5 to 6 dpi.
107
3.2. Evidence for chromosomal rearrangements within 8 days
108
Since Yau et al [19] observed that 34 of 36 independent OtV5-resistant clonal lines showed
109
chromosomal rearrangements during a period of co-evolution of host and virus over several months,
110
here we aimed to determine if chromosomal changes occurred as soon as possible following
111
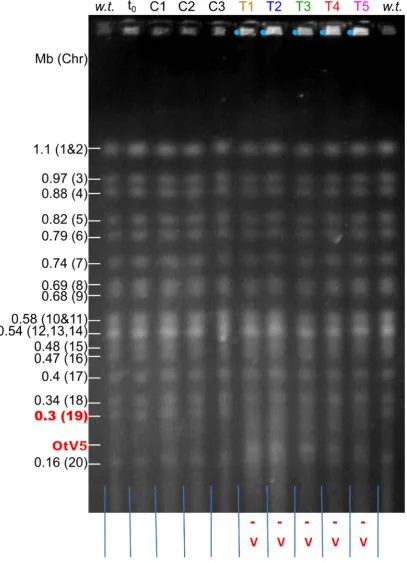
inoculation with OtV5. Pulsed field gel electrophoresis (PFGE) was used to examine the karyotypes
112
of individual cultures as soon as sufficient cells were present to perform such an analysis from the
113
cultures mentioned above (3.1). Eight days after inoculation with OtV5, 5 infected (Test) cultures and
114
3 non-inoculated (Control cultures) were used to prepare intact chromosomal DNA. Their karyotypes
115
were then compared by PFGE. In the 5 test lines, as expected, the linear OtV5 genome could be
116
observed at its expected size of 184 kb with a band intensity similar to the O. tauri chromosomes
117
indicating the virus is still present in the cultures at a high virus to cell ratio. However, in these
118
cultures chromosome 19, expected at about 300 kb, [19], was no longer visible (Figure 2), but there
119
was increased fluorescence in the gel wells, again suggesting the presence of circular or very large
120
DNA intermediates [19]. No visible changes in the sizes of other chromosomes were evident.
121
Visibly green
0,1
1
10
100
0
1
2
3
4
7
8
9 10 11 14 15 16 17 18 21 22
infected
uninfected
log
(millions
cells
.m
L
-1
)
Time (days post-inoculation)
122
Figure 2. Karyotypes of O. tauri cultures visualised by PFGE separation of the chromosomes. The
123
sizes and positions of O. tauri chromosomes are indicated on the left. Chromosome 19 (red numbers)
124
was not visualised in freshly OtV5-resistant test cultures (gel tracks indicated with red annotations at
125
the bottom). w.t.: wild-type O. tauri RCC4221 from the original culture used before inoculation. t0:
wild-126
type O. tauri RCC4221 from the RCC4221 culture at the start of the experiment. C1, C2, C3:
mock-127
inoculated Control cultures at 8 days post-inoculation (dpi). T1--T5: Test cultures inoculated with
128
OtV5 at MOI 5 (colours correspond with those in Figure 3 below), 8 dpi. - : absence of chromosome
129
19 at its expected mobility (312 kb) in Test cultures. v: presence of the OtV5 viral genome (184 kb long)
130
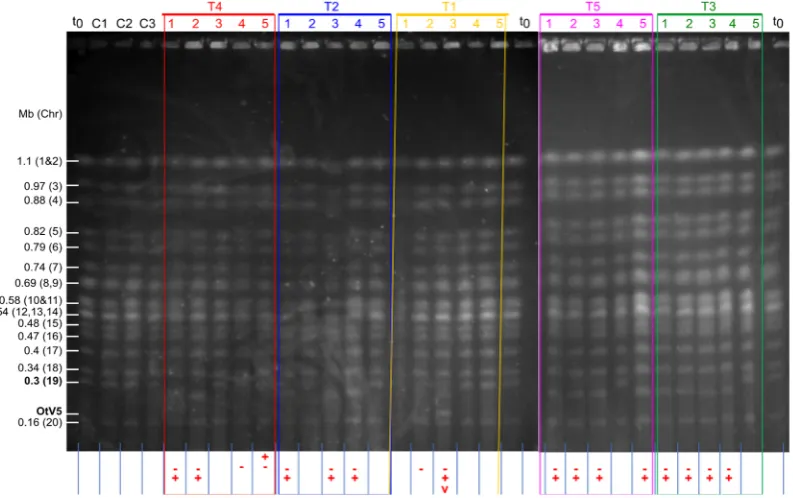
Clonal lines were then established from all cultures by spread plating and randomly picking
132
individual colonies into fresh liquid medium. Five clonal lines were picked from each of the test
133
OtV5-resistant cultures and 1 clonal line from the control susceptible cultures. Their karyotypes were
134
then compared by PFGE (Figure 3).
135
136
Figure 3. Karyotypes of clonal lines O. tauri visualised by PFGE separation of the chromosomes. The
137
figure is a composite of two separate gels. t0: wild-type O. tauri RCC4221 the start of the experiment.
138
C1, C2, C3: clonal lines established from mock-inoculated control cultures. T1—T5: Five independent
139
clonal lines were established from each of the Test (T1–T5) OtV5-resistant cultures shown in Figure 2,
140
i.e. 5 lines from each of 5 cultures (labelled and boxed with similar colours in both figures).
141
Annotations underneath the gel tracks show which tracks have bands with altered mobilities. - :
142
absence of chromosome 19 at its expected mobility (0.3 Mb, indicated position in bold on the left) in
143
Test cultures.
+
: presence of a chromosomal band not detected in Control cultures. v: presence of the144
OtV5 viral genome (184 kb long) in inoculated cultures.
145
None of the clonal lines from the control cultures showed a different karyotype to the wild-type
146
O. tauri. In the clonal OtV5-resistant lines, chromosome 19 was now resolved as a band detectable by
147
PFGE in 22 of 24 resistant clones (one of the karyotype profiles was not resolved). Fourteen resistant
148
lines showed a decrease in size of the SOC, 1 line showed an increase in size and the remaining 7
149
showed no visible change compared to the wild-type. Importantly, the sizes of the chromosome 19 in
150
clones coming from the same parent resistant culture always varied between clones, indicating that
151
the parent resistant cultures consisted of cells with a mixture of SOC sizes.
152
3.3. Acquisition of resistance is frequent
153
In order to make an approximate estimation of the minimal number of cells required for
154
resistance, 16 independent cultures were used to make a set of dilution series’ for inoculations, 8
155
controls with L1 medium added and 8 with a suspension of OtV5 in L1 medium. The plates were
156
158
Figure 4.Left: uninfected cultures, Right: cells inoculated with OtV5 at MOI 5 , as shown in the table.
159
Each of the 16 columns of wells is a separate culture, diluted as shown in the table in rows top (least
160
dilute) to bottom (most dilute). Green dots indicate the most dilute step of the series in which host
161
cell growth was visible in a proportion of the cultures.
162
In controls 2/8 cultures diluted to an average of 1 cell per culture well grew, and 8/8 cultures
163
started with 10 cells grew, whereas in OtV5-inoculated cultures about 37% of the cultures started
164
with 1000 cells in O. tauri became resistant, and 104 cells gave rise to resistant lines in 8/8 independent
165
cultures. Thus, 1 in 103–104 cells gave rise to a resistant line in these cultures.
166
3.4. OtV5-resistant strains showed a wide spectrum of viral resistance
167
In order to test whether the acquisition of resistance led to an altered specificity range we used
168
host and viral strains produced in previous studies. Many viruses of O. tauri have been isolated from
169
samples collected from different locations or on different sampling dates, and their host-virus
170
specificities have been tested[22,26]. We tested the virulence of these independently isolated viruses
171
on the set of 8 OtV5-susceptible control lines and 28 of the OtV5-resistant clonal lines previously
172
produced by experimental co-evolution of host and virus [19]. Overall, OtV5-resistant lines showed
173
an increased spectrum of resistance to viruses that were infectious in the original O. tauri strain
174
176
Figure 5. Altered spectrum of virus resistance in OtV5-resistant O. tauri lines. +: complete or almost
177
complete host cell lysis -: no or little host cell lysis ?: not possible to determine. Orange background
178
cell: result on susceptible O. tauri control differed from previous observation [22]. Blue background
179
cell: result that differed to the null hypothesis that the susceptibility of this strain would be the same
180
as that previously observed (S1a to S8a controls and [22]). Note that OtV5 is not highlighted since
181
these lines were selected for their resistance to this virus. S: susceptible clonal line [19]. R: resistant
182
clonal line [19]. vir2012: The number of independently isolated wild-type O. tauri strains on which
183
the viral isolate shown was noted as virulent out of 12 tested previously [22] (excluding the strain on
184
which the virus was isolated).
185
Resistance to OtV5 in the evolved clonal lines also conferred resistance to 89% (24/27) of other
186
independently isolated viruses [22] of the original O. tauri virus-susceptible strain.
187
3.5. OtV5-resistant strains do not adsorb OtV5
188
Naïvely, since the vast majority of cells were asymptomatic in OtV5-resistant lines exposed to OtV5,
189
we might expect that OtV5 particles no longer bind to resistant cells. We tested this hypothesis
190
using adsorption assays to determine the number of PFU remaining in an OtV5 lysate after
191
incubation together with different resistant or susceptible lines of O. tauri and related species of
192
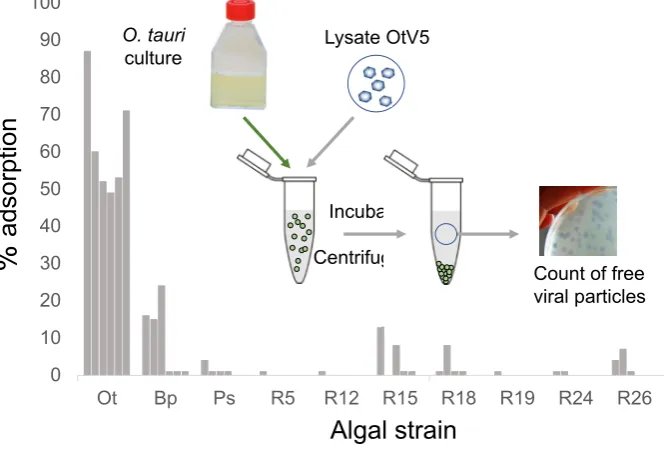
microalgae to measure the number of infectious particles (number of PFUs) which do not adsorb on
193
O. tauri resistant cells (Figure 6). Control susceptible O. tauri cells adsorbed 49—87% of the viable
194
particles present in the suspension, whereas the non-host species Bathycoccus sp. [14] and
195
Picochlorum costavermella [27] adsorbed 1—24% and 0—4% (variations in 6 replicates). There was
196
thus some adsorption to the phylogenetically more closely related Bathycoccus sp.
197
alga P. costavermella (Trebouxiophyceae). Seven independently isolated OtV5-resistant clones [19]
199
showed much reduced adsorption to O. tauri cells, in support of the hypothesis that at least some of
200
the resistance observed is due to lack of adsorption to these cells.
201
202
Figure 6. Acquired resistance reduces adsorption of OtV5. Ten algal strains (abscissa) were each
203
assayed six times (grey bars) for their ability to bind to OtV5. Ot: control susceptible wild-type O.tauri
204
RCC4221, Ps: Picochlorum sp. RCC4223, Bp: Bathycoccus sp. RCC4222,R: OtV5-resistant line[19].
205
4. Discussion
206
4.1. Is resistance induced?
207
We observed that about 5 x 10⁶ cells.mL-1 were growing at 4 dpi (Figure 1). A freshly cloned
208
culture of O. tauri was used, an MOI of 5 viral particles was present at the start of the experiment,
209
and might hypothesize that resistance may have been induced in the night the first infection cycle,
210
since most of the host and viral changes in gene expression occurred at that stage [15]. By “induced”
211
we mean that some process that leads to cellular viral resistance has been initiated by the infecting
212
virus. Assuming one division per day, resistance may thus have been induced in about 3.0 x 10⁵
213
cells.mL–1 in the 3.0 x 10⁷ cells.mL-1 used for inoculation (i.e. about 3 in104 cells). This figure is much
214
higher than the spontaneous mutation frequency of 4 x 10⁻¹⁰ mutations per nucleotide per generation
215
in O.tauri [28]. Independently, we showed clearly in a subsequent experiment (above 3.3) that about
216
103–104 cells were necessary for resistance, confirming this rough calculation.
217
While our results strongly favour the notion that resistance is induced, we have also observed
218
in this study and in previous work [19] that OtV5-resistance is strongly correlated with an increased
219
rate of spontaneous large rearrangements concentrated on the SOC. These changes may correspond
220
mainly to deletions and duplications occurring in the genetic material on this chromosome, perhaps
221
arising because of the selective pressure to overexpress some genes affecting resistance to OtV5, but
222
this interpretation remains to be investigated experimentally. Since the SOC represents only 2% of
223
the complete genome, a higher mutation rate was likely not detectable in this chromosome using
224
short read technology employed for measuring the spontaneous mutation rate by mutation
225
accumulation [28] because of repeated DNA in the SOC. Moreover, the spontaneous mutation rate
226
measured was of single nucleotide and short insertion-deletions (indels) and thus could not take into
227
account large indels or rearrangements. In wild-type strains, the SOC is variable in size and
228
composition [29,30], suggesting that the strong selective pressure arising from dense prasinovirus
229
populations in coastal environments [31] also favours genetic hypervariability in the SOC. Given that
230
0 10 20 30 40 50 60 70 80 90 100
Ot Bp Ps R5 R12 R15 R18 R19 R24 R26
%
adsorpti
on
Algal strain
O. tauri
culture
Incubation
Centrifugation Lysate OtV5
we were unable to measure the spontaneous rate in the SOC, we cannot rule out an alternative
231
hypothesis, that a small proportion of cells in the population always contain some level of ongoing
232
SOC rearrangements that are usually lost because of their reduced fitness. Intuitively this hypothesis
233
seems less likely, because the control O. tauri RCC4221 karyotype has been stable through
234
subculturing over many years [28] and there is little difference in the fitness between susceptible and
235
resistant strains [18,32].
236
4.2. Genomic rearrangements occur rapidly
237
In OtV5-resistant cultures at 8 dpi, chromosome 19 could not be seen at the expected position on
238
PFGE gels (Figure 2) consistent with these cultures containing a mixture of lines with different
239
rearrangements of chromosome 19 (Figure S1).
240
Thus, this study showed firstly, that SOC rearrangements were closely linked in time to OtV5
241
infection and acquisition of resistance, and secondly, that a variety of rearrangements reliably
242
occurred in the culture population. By contrast to Yau et al [19] where resistant lines had been
243
propagated over months, variability in SOC size was lower, with a larger proportion of resistant
244
clones showing no visible change in SOC size, and no changes were evident in other chromosomes.
245
This suggests continued host–virus interactions produces larger variability as a result of an
246
accumulation of mutations over time. As PFGE is not able to reveal small indels or rearrangements,
247
we cannot rule out that smaller changes may have occurred in lines with no apparent change in SOC
248
size, so it remains uncertain whether these rapid rearrangements in the SOC are necessary for
249
resistance or whether they are a by-product of contact with OtV5. If resistance is always linked to
250
rearrangement of the chromosome 19, the appearance of a variety of SOC types was as expected given
251
the frequency of appearance of resistant cell lines measured in section 3.3. Given that on average 3
252
cells in 104 would be expected to become resistant, and the inoculated culture was at about 3 x 10⁷
253
cells.mL-1, then we might expect there could in theory be up to 104 different resistant clones present.
254
However this will certainly be an overestimate, as only the fastest-growing cell lines would reach the
255
cell density required to produce enough cells for PFGE analysis, and eventually the fastest growing
256
variants would dominate the culture population.
257
4.3. Acquired resistance shows a broad specificity spectrum
258
The much increased spectrum of resistance observed (Figure 5) to other viral strains suggests
259
that a global adaptive response has been induced, and concurs with differential expression of many
260
genes [19], those on chromosome 19 being particularly important. The 3 viral strains (OtV06_12,
261
OtV09_562 and OtV09_574) still able to lyse the majority of the OtV5-resistant lines (Figure 5) were
262
shown by Clerissi et al [22] to be among the most virulent in terms of the large proportion of
263
independently isolated host strains (up to 85% of O. tauri strains) they lyse. Furthermore, these 3 viral
264
strains were of different DNA polymerase haplotypes when compared to the other viral strains which
265
can no longer lyse the OtV5-resistant lines [22]. This is consistent with observation that more closely
266
related viruses, based on similarity in taxonomic marker genes, are able to lyse a similar range of host
267
strains [22,26]. Accordingly, resistance to one virus strain would be expected to confer resistance to
268
genetically related strains. The effectiveness of the barrier to infection in resistant strains is witnessed
269
by the very low level of OtV5 viruses adsorbing to them (Figure 6), since even the non-host species
270
Bathycoccus sp. RCC4222 bound a higher proportion of virions than OtV5-resistant host O. tauri cells
271
(Figure 6). We were surprised to find that some of the viruses (on average 10%) adsorbed to
272
Bathycoccus sp., which is not susceptible to any of them [22]. Bathycoccus spp. are relatively abundant
273
in marine environments [33] and might thus compete for adsorption of Ostreococcus sp. viruses.
274
Resistance to such an extensive set of independently isolated viruses suggests that O. tauri has a
275
fast adaptive mechanism for resistance to viruses that permits induction of a specialised set of genes,
276
many of which were probably regrouped on chromosome 19, that may have been subject to the strong
277
selective pressure of abundant prasinoviruses in eutrophic coastal waters. Bellec et al [31] first
278
observed that coastal lagoons waters are much more densely populated with prasinoviruses than
279
or susceptibility to viruses in this class of algae that have been so successful and pervasive in aquatic
281
environments.
282
Author Contributions: “Conceptualization and Methodology, S.Y., H.M., NG.; Investigation, G.C., N.F., S.Y.,
283
E.D.; Writing-Original Draft Preparation, N.G.; Writing-Review & Editing, S.Y., H.M., N.G.; Visualization, N.G.,
284
S.Y., H.M.; Supervision, S.Y., H.M., N.G.; Project Administration, S.Y., NG., H.M.; Funding Acquisition, N.G.,
285
H.M.
286
Funding: This research was funded by French National Research Agency (Agence National de Recherche grants
287
PHYTOPOL ANR-15-CE02-0007 coordinator H.M., ALGALVIRUS, ANR-17-CE02-0012 coordinator NG,) that
288
have supported both personnel, including post-doc, students and technician (S.Y., G.C., N.F., E.D.,) and
289
consumable materials.
290
Acknowledgments: We thank Christophe Salmeron and David Pecqueur for their help with flow cytometry,
291
two anonymous reviewers for their useful remarks, and the Genophy team for discussions.
292
Conflicts of Interest: The authors declare no conflict of interest. The funders had no role in the design of the
293
study; in the collection, analyses, or interpretation of data; in the writing of the manuscript, and in the decision
294
to publish the results.
295
References
296
1. Mayer, J. A.; Taylor, F. J. R. Virus which lyses the marine nanoflagellate Micromonas pusilla. Nature
297
1979, 281, 299–301, doi:10.1038/281299a0.
298
2. Short, S. M. The ecology of viruses that infect eukaryotic algae. Environ. Microbiol. 2012,
299
doi:10.1111/j.1462-2920.2012.02706.x.
300
3. Hingamp, P.; Grimsley, N.; Acinas, S. G.; Clerissi, C.; Subirana, L.; Poulain, J.; Ferrera, I.; Sarmento,
301
H.; Villar, E.; Lima-Mendez, G.; Faust, K.; Sunagawa, S.; Claverie, J.-M.; Moreau, H.; Desdevises, Y.;
302
Bork, P.; Raes, J.; de Vargas, C.; Karsenti, E.; Kandels-Lewis, S.; Jaillon, O.; Not, F.; Pesant, S.; Wincker,
303
P.; Ogata, H. Exploring nucleo-cytoplasmic large DNA viruses in Tara Oceans microbial metagenomes.
304
ISME J.2013, 7, 1678–1695, doi:10.1038/ismej.2013.59.
305
4. Derelle, E.; Ferraz, C.; Escande, M.-L.; Eychenie, S.; Cooke, R.; Piganeau, G.; Desdevises, Y.; Bellec,
306
L.; Moreau, H.; Grimsley, N. Life-cycle and genome of OtV5, a large DNA virus of the pelagic marine
307
unicellular green alga Ostreococcus tauri. PLoS ONE 2008, 3, e2250, 1–13,
308
doi:10.1371/journal.pone.0002250.
309
5. Weynberg, K. D.; Allen, M. J.; Ashelford, K.; Scanlan, D. J.; Wilson, W. H. From small hosts come big
310
viruses: the complete genome of a second Ostreococcus tauri virus, OtV-1. Environ. Microbiol.2009,
311
11, 2821–2839, doi:10.1111/j.1462-2920.2009.01991.x.
312
6. Weynberg, K. D.; Allen, M. J.; Gilg, I. C.; Scanlan, D. J.; Wilson, W. H. Genome sequence of
313
Ostreococcus tauri virus OtV-2 throws light on the role of picoeukaryote niche separation in the ocean.
314
J. Virol.2011, 85, 4520–4529, doi:10.1128/JVI.02131-10.
315
7. Derelle, E.; Monier, A.; Cooke, R.; Worden, A. Z.; Grimsley, N. H.; Moreau, H. Diversity of viruses
316
Infecting the green microalga Ostreococcus lucimarinus. J. Virol. 2015, 89, 5812–5821,
317
doi:10.1128/JVI.00246-15.
318
8. Moreau, H.; Piganeau, G.; Desdevises, Y.; Cooke, R.; Derelle, E.; Grimsley, N. Marine prasinovirus
319
genomes show low evolutionary divergence and acquisition of protein metabolism genes by horizontal
320
gene transfer. J. Virol.2010, 84, 12555–12563, doi:10.1128/JVI.01123-10.
321
9. Zhang, W.; Zhou, J.; Liu, T.; Yu, Y.; Pan, Y.; Yan, S.; Wang, Y. Four novel algal virus genomes
322
discovered from Yellowstone Lake metagenomes. Sci. Rep.2015, 5, 15131, doi:10.1038/srep15131.
10. Derelle, E.; Ferraz, C.; Rombauts, S.; Rouzé, P.; Worden, A. Z.; Robbens, S.; Partensky, F.; Degroeve,
324
S.; Echeynié, S.; Cooke, R.; Saeys, Y.; Wuyts, J.; Jabbari, K.; Bowler, C.; Panaud, O.; Piégu, B.; Ball, S.
325
G.; Ral, J.-P.; Bouget, F.-Y.; Piganeau, G.; Baets, B. D.; Picard, A.; Delseny, M.; Demaille, J.; Peer, Y.
326
V. de; Moreau, H. Genome analysis of the smallest free-living eukaryote Ostreococcus tauri unveils
327
many unique features. Proc. Natl. Acad. Sci.2006, 103, 11647–11652, doi:10.1073/pnas.0604795103.
328
11. Blanc-Mathieu, R.; Verhelst, B.; Derelle, E.; Rombauts, S.; Bouget, F.-Y.; Carré, I.; Château, A.;
Eyre-329
Walker, A.; Grimsley, N.; Moreau, H.; Piégu, B.; Rivals, E.; Schackwitz, W.; Peer, Y. V. de; Piganeau,
330
G. An improved genome of the model marine alga Ostreococcus tauri unfolds by assessing Illumina de
331
novo assemblies. BMC Genomics2014, 15, 1103, doi:10.1186/1471-2164-15-1103.
332
12. Worden, A.; Lee, J.-H.; Mock, T.; Rouzé, P.; Simmons, M. P.; Aerts, A. L.; Allen, A. E.; Cuvelier, M.
333
L.; Derelle, E.; Everett, M. V.; Foulon, E.; Grimwood, J.; Gundlach, H.; Henrissat, B.; Napoli, C.;
334
McDonald, S. M.; Parker, M. S.; Rombauts, S.; Salamov, A.; Von Dassow, P.; Badger, J. H.; Coutinho,
335
P. M.; Demir, E.; Dubchak, I.; Gentemann, C.; Eikrem, W.; Gready, J. E.; John, U.; Lanier, W.; Lindquist,
336
E. A.; Lucas, S.; Mayer, K. F. X.; Moreau, H.; Not, F.; Otillar, R.; Panaud, O.; Pangilinan, J.; Paulsen, I.;
337
Piegu, B.; Poliakov, A.; Robbens, S.; Schmutz, J.; Toulza, E.; Wyss, T.; Zelensky, A.; Zhou, K.;
338
Armbrust, E. V.; Bhattacharya, D.; Goodenough, U. W.; Van de Peer, Y.; Grigoriev, I. V. Green evolution
339
and dynamic adaptations revealed by genomes of the marine picoeukaryotes Micromonas. Science2009,
340
324, 268–272, doi:10.1126/science.1167222.
341
13. Palenik, B.; Grimwood, J.; Aerts, A.; Rouze, P.; Salamov, A.; Putnam, N.; Dupont, C.; Jorgensen, R.;
342
Derelle, E.; Rombauts, S.; Zhou, K. M.; Otillar, R.; Merchant, S. S.; Podell, S.; Gaasterland, T.; Napoli,
343
C.; Gendler, K.; Manuell, A.; Tai, V.; Vallon, O.; Piganeau, G.; Jancek, S.; Heijde, M.; Jabbari, K.;
344
Bowler, C.; Lohr, M.; Robbens, S.; Werner, G.; Dubchak, I.; Pazour, G. J.; Ren, Q. H.; Paulsen, I.;
345
Delwiche, C.; Schmutz, J.; Rokhsar, D.; Van de Peer, Y.; Moreau, H.; Grigoriev, I. V. The tiny eukaryote
346
Ostreococcus provides genomic insights into the paradox of plankton speciation. Proc. Natl. Acad. Sci.
347
U. S. A.2007, 104, 7705–7710, doi:10.1073/pnas.0611046104.
348
14. Moreau, H.; Verhelst, B.; Couloux, A.; Derelle, E.; Rombauts, S.; Grimsley, N.; Bel, M. V.; Poulain, J.;
349
Katinka, M.; Hohmann-Marriott, M. F.; Piganeau, G.; Rouzé, P.; Silva, C. D.; Wincker, P.; Peer, Y. V.
350
de; Vandepoele, K. Gene functionalities and genome structure in Bathycoccus prasinos reflect cellular
351
specializations at the base of the green lineage. Genome Biol.2012, 13, R74,
doi:10.1186/gb-2012-13-8-352
r74.
353
15. Derelle, E.; Yau, S.; Moreau, H.; Grimsley, N. H. Prasinovirus Attack of Ostreococcus Is Furtive by Day
354
but Savage by Night. J. Virol.2018, 92, e01703-17, doi:10.1128/JVI.01703-17.
355
16. Monier, A.; Chambouvet, A.; Milner, D. S.; Attah, V.; Terrado, R.; Lovejoy, C.; Moreau, H.; Santoro, A.
356
E.; Derelle, É.; Richards, T. A. Host-derived viral transporter protein for nitrogen uptake in infected
357
marine phytoplankton. Proc. Natl. Acad. Sci.2017, 201708097, doi:10.1073/pnas.1708097114.
358
17. Monier, A.; Welsh, R. M.; Gentemann, C.; Weinstock, G.; Sodergren, E.; Armbrust, E. V.; Eisen, J. A.;
359
Worden, A. Z. Phosphate transporters in marine phytoplankton and their viruses: cross-domain
360
commonalities in viral-host gene exchanges. Environ. Microbiol.2012, 14, 162–176,
doi:10.1111/j.1462-361
2920.2011.02576.x.
362
18. Thomas, R.; Grimsley, N.; Escande, M.; Subirana, L.; Derelle, E.; Moreau, H. Acquisition and
363
maintenance of resistance to viruses in eukaryotic phytoplankton populations. Environ. Microbiol.2011,
364
13, 1412–1420, doi:10.1111/j.1462-2920.2011.02441.x.
19. Yau, S.; Hemon, C.; Derelle, E.; Moreau, H.; Piganeau, G.; Grimsley, N. A Viral Immunity Chromosome
366
in the Marine Picoeukaryote, Ostreococcus tauri. PLOS Pathog 2016, 12, e1005965,
367
doi:10.1371/journal.ppat.1005965.
368
20. Courties, C.; Vaquer, A.; Troussellier, M.; Lautier, J.; Chretiennotdinet, M. J.; Neveux, J.; Machado, C.;
369
Claustre, H. Smallest Eukaryotic Organism. Nature1994, 370, 255, doi:10.1038/370255a0.
370
21. Courties, C.; Perasso, R.; Chretiennot-Dinet, M. J.; Gouy, M.; Guillou, L.; Troussellier, M. Phylogenetic
371
analysis and genome size of Ostreococcus tauri (Chlorophyta, Prasinophyceae). J. Phycol. 1998, 34,
372
844–849, doi:10.1046/j.1529-8817.1998.340844.x.
373
22. Clerissi, C.; Desdevises, Y.; Grimsley, N. H. Prasinoviruses of the marine green alga Ostreococcus tauri
374
are mainly species-specific. J. Virol.2012, 86, 4611–4619, doi:10.1128/jvi.07221-11.
375
23. Trask, B. J.; van den Engh, G. J.; Elgershuizen, J. H. Analysis of phytoplankton by flow cytometry.
376
Cytometry1982, 2, 258–64, doi:10.1002/cyto.990020410.
377
24. Rodriguez, F.; Derelle, E.; Guillou, L.; Le Gall, F.; Vaulot, D.; Moreau, H. Ecotype diversity in the marine
378
picoeukaryote Ostreococcus (Chlorophyta, Prasinophyceae). Environ. Microbiol. 2005, 7, 853–859,
379
doi:10.1111/j.1462-2920.2005.00758.x.
380
25. Meints, R. H.; Burbank, D. E.; Van Etten, J. L.; Lamport, D. T. Properties of the Chlorella receptor for
381
the virus PBCV-1. Virology1988, 164, 15–21, doi:10.1016/0042-6822(88)90614-9.
382
26. Bellec, L.; Clerissi, C.; Edern, R.; Foulon, E.; Simon, N.; Grimsley, N.; Desdevises, Y. Cophylogenetic
383
interactions between marine viruses and eukaryotic picophytoplankton. BMC Evol. Biol.2014, 14, 59,
384
doi:10.1186/1471-2148-14-59.
385
27. Krasovec, M.; Vancaester, E.; Rombauts, S.; Bucchini, F.; Yau, S.; Hemon, C.; Lebredonchel, H.;
386
Grimsley, N.; Moreau, H.; Sanchez-Brosseau, S.; Vandepoele, K.; Piganeau, G. Genome analyses of the
387
microalga Picochlorum provide insights into the evolution of thermotolerance in the green lineage.
388
Genome Biol. Evol.2018, doi:10.1093/gbe/evy167.
389
28. Krasovec, M.; Eyre-Walker, A.; Sanchez-Ferandin, S.; Piganeau, G. Spontaneous Mutation Rate in the
390
Smallest Photosynthetic Eukaryotes. Mol. Biol. Evol. 2017, 34, 1770–1779,
391
doi:10.1093/molbev/msx119.
392
29. Subirana, L.; Péquin, B.; Michely, S.; Escande, M.-L.; Meilland, J.; Derelle, E.; Marin, B.; Piganeau, G.;
393
Desdevises, Y.; Moreau, H.; Grimsley, N. H. Morphology, Genome Plasticity, and Phylogeny in the
394
Genus Ostreococcus Reveal a Cryptic Species, O. mediterraneus sp. nov. (Mamiellales,
395
Mamiellophyceae). Protist2013, 164, 643–659, doi:10.1016/j.protis.2013.06.002.
396
30. Blanc-Mathieu, R.; Krasovec, M.; Hebrard, M.; Yau, S.; Desgranges, E.; Martin, J.; Schackwitz, W.;
397
Kuo, A.; Salin, G.; Donnadieu, C.; Desdevises, Y.; Sanchez-Ferandin, S.; Moreau, H.; Rivals, E.;
398
Grigoriev, I. V.; Grimsley, N.; Eyre-Walker, A.; Piganeau, G. Population genomics of picophytoplankton
399
unveils novel chromosome hypervariability. Sci. Adv.2017, 3, :e1700239, doi:10.1126/sciadv.1700239.
400
31. Bellec, L.; Grimsley, N.; Derelle, E.; Moreau, H.; Desdevises, Y. Abundance, spatial distribution and
401
genetic diversity of Ostreococcus tauri viruses in two different environments. Environ. Microbiol. Rep.
402
2010, 2, 313–321, doi:10.1111/j.1758-2229.2010.00138.x.
403
32. Heath, S. E.; Knox, K.; Vale, P. F.; Collins, S. Virus Resistance Is Not Costly in a Marine Alga Evolving
404
under Multiple Environmental Stressors. Viruses2017, 9, 39, doi:10.3390/v9030039.
405
33. Vannier, T.; Leconte, J.; Seeleuthner, Y.; Mondy, S.; Pelletier, E.; Aury, J.-M.; Vargas, C. de; Sieracki,
406
M.; Iudicone, D.; Vaulot, D.; Wincker, P.; Jaillon, O. Survey of the green picoalga Bathycoccus genomes
407
in the global ocean. Sci. Rep.2016, 6, 37900, doi:10.1038/srep37900.