Abstract— The adsorption of Chromium trivalent has been studied. Its equilibrium isotherm has been measured. The isotherm was determined by stirring 3 g of Cement Kiln Dust, with 250 ml of a chromium solution (from a tannery effluents wastewater) of initial concentrations 2336 and 4320 mg/L respectively. The stirring rate was used at constant rate of 1200 rpm and the temperature maintained at 25±2 oC. A contact time of around 60 min. was required to achieve equilibrium. The experimental isotherm results have been fitted using Langmuir, Freundlich, Temkin and Dubinin-Radushkevich equations. The monolayer adsorption capacity is 303 mg Cr(III) per g of Cement Kiln Dust. A comparison of kinetic models applied to the adsorption of Cr(III) ions on the adsorbent was evaluated for the first order, the pseudo first order, the pseudo second order, Elovich and intraparticle diffusion kinetic models, respectively. Kinetic parameters, rate constant, equilibrium sorption capacities and related correlation coefficients for each kinetic model were calculated and discussed. Results show that the pseudo second order kinetic model was found to correlate the experimental data well.
Index Terms—Isotherm and Kinetics, Intraparticle diffusion, Cement Kiln Dust, Tannery wastewater.
I. INTRODUCTION
Chromium is an important toxic material because it does not undergo biodegradation. This pollutant is introduced into natural waters by a variety of industrial wastewaters including those from textile, leather tanning, electroplating, and metal finishing industries. When accumulated at high levels, chromium can generate serious problems and, when concentration reaches 0.1 mg/g body weight, it can ultimately become lethal [1]. Currently, the most common processes for elimination chromium are adsorption, reverse osmosis and chemical reactions that involve reduction and
Manuscript received June 9, 2008. This work was supported in part by Al-Mergheb University .
Mohamed Al-Meshragi is with Al-Mergheb University, Faculty of Engineering, Chemical Engineering Department, Al-Khoms City, Libya. He is now head of Research and Engineering Consulting Centre at Al-Mergheb University (corresponding author to provide phone: ++218-92-542-3656; fax: ++218-31-629-370; e-mail: moh_almeshragi@ yahoo.com).
Hesham G. Ibrahim is Lecturer with Al-Mergehb University, Faculty of Engineering, Chemical Engineering Department, Al-Khoms City, Libya, (e-mail: [email protected]).
Mohamed Aboabboud is head of chemical Engineering Department, Faculty of Engineering, Al-Mergheb University, Al-Khoms City, (e-mail: [email protected]).
precipitation. Among them adsorption has been shown as a feasible alternative method for removing traces of chromium from wastewater. Although many different adsorbents were tried to remove chromium from wastewaters [1-3].
Adsorption is by far the most effective and widely used technique for the removal of toxic heavy metals from wastewater [4]. Owing to the high cost and difficult procurement of activated carbon, efforts are being directed towards finding efficient and low cost adsorbent materials. A variety of low cost materials like fly ash [5], wood charcoal[6], bituminous coal [7], bagasse and coconut jute [8], rice husk carbon [9], peat [10], red mud [11], Used black tea leaves [12], activated carbon from sugar industrial waste [13] and sugarcane bagasse [14] and have been tried. As shown recently, research efforts have been directed towards the use of industrial waste as an adsorbent material in an attempt to minimize processing costs and with the protection of the environment and public health. Therefore, the present objective of this study is to evaluate the chromium trivalent removal potential and related kinetics of Cement Kiln Dust due to the fact that it is a very abundant as a byproduct from a cement manufacturing process an inexpensive material in The Great Jamahiriya and in the world. The adsorption ability of Cr(III) using CKD was investigated. The Lagnmuir, Freundlich, Temkin and Dubinin-Radushkevich equations were used to fit equilibrium isotherm. Finally, the rates and mechanism of the adsorption process were investigated. Various kinetic evaluations have been used to describe the adsorption process. Here we attempted to apply a simple first order kinetic model [15] for changing the bulk concentration, and pseudo first-order rate equation [16] and pseudo second-order [17], Elovich model [18,19] and intraparticle diffusion model [20,21] for the adsorbent phase concentration. These fundamental data will be useful for further applications in the treatment of particle waste or process effluents.
II. MATERIAL AND METHODS
The experiment was carried out to remove chromium (III) from tanning wastewater effluents by using by-pass cement kiln dust (CKD) as an adsorbent. The cement kiln dust was collected from the (Al-Mergheb Portland Cement Factory, Al-Khoms). The analysis of the sample of CKD was made by X-ray fluorescence, the composition of the constituents is shown in Table.1.
Equilibrium and Kinetics of Chromium
Adsorption on Cement Kiln Dust
Table.1 The chemical composition of CKD
Constituents Composition*, (wt%)
SiO2 19.58
Al2O3 3.6
Fe2O3 2.97
CaO 54.89
MgO 2.12
K2O 2.32
SO3 0.83
Cl 0.54
Na2O 0.109
Other residues 13.041
* Average values for four different batch samples.
The wastewater obtained from national tanneries effluents, this wastewater obtained after the tanning operation was filtered to obtain a tanning solution, which is to be further treated for the chromium (III) removal.
A. Reduction of hexavalent chromium to trivalent chromium
The most of chromium is discharged into aqueous solution from tannery effluents as Cr(III) and small content of Cr(VI). Also, CKD had no effect on the removal of hexavalent chromium, while it adsorbs trivalent chromium from solutions. Thus, before the addition of CKD to tanning solution, reduction of hexavalent chromium was carried out by using sodium bisulfite as a reducing agent and sulfuric acid (0.1 N). The sodium bisulfite was added in different amounts 0.5, 1 and 1.5 g to 50 ml of the tanning solutions sample, while sulfuric acid was gradually added [22]. The addition of sulfuric acid was continued until the reduction was completed as detected by oxidation reduction potential which was used as a sensor in the device titroprocessor (Type: Metrohm 682).
B. Experimental Procedure
The experimental was carried out by batch process for the tanning solution obtained from tanneries effluents. The Cr(III) content in the tanning solution was determined using UV visible spectrophotometer (Unicam 8700), at a wavelength of =540 nm. Each sample was digested by adding 5 ml of nitric acid to 50 ml of the sample before measuring its chromium content by the spectrophotometer. Then the solution was evaporated on a hot plate to its volume becomes 15 ml. Further, 5 ml of concentrate nitric acid and 10 ml of concentrate sulfuric acid (95% wt.) were added and the solution was evaporated until dense white fumes of SO3 appeared. The solution was cooled and diluted to about 50 ml with distilled water. Then, the solution was heated top almost boiling to dissolve gradually salts and then cooled and diluted with distilled water to 100 ml after that, the solution was ready for chromium (III) measurement.
The initial concentrations of Cr(III) in tanning solutions were treated in an experimental were 2336 and 4320 mg/l respectively. These two tanneries batches are taking from two different national tanneries effluents wastewater.
In the determination of equilibrium adsorption isotherm 3 g CKD and 250 ml of the stock solution of Cr(III) (tanning solutions prepared above) were transferred a conical flask and agitated using an agitator operation at 1200 rpm for 60 min (the time required for equilibrium to be reached between trivalent chromium adsorbed and trivalent chromium in solution) at room temperature (25
2 oC) and pH value 0.5. This pH was found to be the optimum for chromium trivalent adsorption onto CKD in the previous experiments (not shown). The pH of the test solutions was adjusted using reagent grade dilute sulfuric acid. A pH meter (Model: HI 8417, HANNA Instrument) was used to measure the pH of solutions.The amount of adsorption at equilibrium, qe(mg/g), was
computed as follows:
s e o e
m V C C
q (1) where Coand Ceare the initial and equilibrium solution
concentrations (mg/L), respectively, V the volume of the solution (L) and msthe weight of CKD used (g). Each
experiment was performed twice at least under identical conditions. Reproducibility of the measurements was mostly within 2%.
In the experiments of batch kinetic adsorption, 250 mL of the chosen desired concentration of the stock solution of Cr(III) were placed in a conical flask together with 3 g CKD and agitation by agitator at temperature (25
2 oC) and pH value 0.5. At predicted intervals of time, samples were taken, and their concentrations were determined.III. RESULTS AND DISCUSSION A. Equilibrium Studies
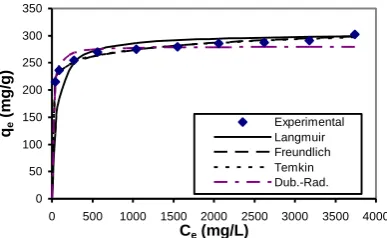
Figure (1) shows the equilibrium adsorption of trivalent chromium (qe vs. Ce) using by pass cement kiln dust. The isotherm rises sharply in the initial stages for low Ce and qe values. This indicates that there are plenty of radially accessible sites. Eventually a plateau is reached, indicating that the adsorbent is saturated at this level. The decrease in the curvature of the isotherm, tending to a monolayer, considerably increasing the Ce values for a small increase in
qe, is possibly due to less active sites being available at the end of the adsorption process and/or the difficulty of the edge molecules in penetrating the adsorbent, Cr(III) molecules partially covering the surface sites.
fit is necessarily good [23]. So, the conformity between experimental data and the model predicted values was expressed by the total mean error, is the discrepancy between the experimental data and the predicted values [24]:
n
1 i
e(Eper.) n
1 i
e(Calc.) e (Exper.)
q q q
% (2)
A relatively low ( %) value indicate that the model successfully describes the equilibrium kinetic of Cr(III) adsorption.
0 50 100 150 200 250 300 350
0 500 1000 1500 2000 2500 3000 3500 4000
Ce (mg/L)
qe
(m
g
/g
)
Experimental Langmuir Freundlich Temkin Dub.-Rad.
Fig.1 Equilibrium isotherms of Cr(III) on CKD. Conditions: 3 g/250 mL dose, 25 oC temperature and pH 0.5.
i) The Langmuir Isotherm
The widely used Langmuir isotherm has found successfully application in many real sorption processes [25-31] and is expressed as:
e L
e L e
C a
C K q
1 (3) A linear form of this expression is:
e L L
L e
e C
K a
K q C
1 (4)
where qe (mg/g) and Ce(mg/L) are the amount of adsorbed Cr(III) per unit weight of adsorbent and unabsorbed Cr(III) concentration in solution at equilibrium, respectively. The constant KL is the Langmuir equilibrium constant and the
KL/aL gives the theoretical monolayer solution capacity, Qo. Therefore a plot of Ce/qeversus gives a straight line of slope
aL/KL and intercept 1/KL. The values of the Langmuir constants aL, KL and Qo with the correlation coefficient are listed in Table(2) for the Cr(III)-CKD system and the Langmuir isotherm is plotted in Figure (1) together with the experimental data points. The mean total error ( %) between this models with the experimental data was 8.870 %. We note that the monolayer saturation capacity (Qo) is 303.149 mg/g. the value of the total mean error is higher than other three isotherms values. In all cases, the Langmuir equation represents the poorest fit of experimental data than other isotherm models (Figure.1).
ii)The Freundlich Isotherm
The well known Freundlich isotherm is often used for heterogeneous surface energy systems [1,25,27,2,33]. The Freundlich equation is given as:
n e F
e K C
q 1 (5) A linear form of this expression is:
e F
e C
n 1 K
q log log
log (6)
where KF is he Freundlich constant and n the Freundlich exponent. KF and n can be determined from the linear plot of log qe versus log Ce. The values of the Freundlich constants together with the correlation coefficient are presented in Table (2) and the theoretical Freundlich equation is shown in Figure (1). Value of the mean total error ( %) is much lower than values of the other three isotherm models, which is reach up to 1.102519%. In all cases, the Freundlich equation represents the best fit of experimental data than other isotherm equations (Figure. 1). This trend is due to the high surface area of the adsorbent, and multilayer of adsorption on the CKD. This trend was investigated also by Schneider, et al. [1] of adsorption Cr(III) onto activated carbon, in which Freundlish isotherm gives a best fits.
iii) The Temkin Isotherm
The Temkin isotherm [25,34] have been used in the following form:
) (A C b
RT
qe ln e (7) A linear form of the Temkin isotherm can be expressed as:
e
e C
b RT A b RT
q ln ln (8)
where; B
b RT
.
The sorption data can be analyzed according to equation (8). Therefore a plot of qe versus ln Ce enables one to determine the constants A and b. the values of the Temkin constants A and B are listed in Table (2) and the theoretical plot of this isotherm is shown in Figure (1). The correlation coefficient is also listed in Table (2). Value of the mean total error ( %) is equal to 1.315%, it's lower than the Langmuir value but higher than Freundlich Value. Therefore, the Temkin equation represents a better fit of experimental data than of both Langmuir and Dubini-Radushkavich equations, but not in the case of Freundlich equation (Figure.1).
iv) The Dubinin-Radushkevich Isotherm
[image:3.595.49.196.114.175.2] [image:3.595.55.249.238.357.2]2
-β m
e q e
q (9) A linear form of Dubinin-Radushkevich isotherm is:
2
ln
lnqe qm (10)
Where qm is the Dubinin-Radushkevich monolayer capacity (mg/g), β a constant related to sorption energy, and ε is the Polanyi potential which is related to the equilibrium concentration as follows:
) C
1 (1 M RT ε
e
ln (11)
where R is the gas constant (8.314 J/mol.K), T is the absolute temperature and M is the molecular weight of the adsorbed. The Constant β gives the mean free energy (E) of sorption per molecule of the sorbate when it is transferred to the surface of the solid from infinity in the solution and can be computed using the relationship [34,35]:
2 1
E (12)
The Dubinin-Radushkevich constants are calculated and given in Table (2) and the theoretical Dubinin-Radushkevich isotherm is plotted in Figure (1) together with experimental data points.
The value of mean total error has been determined and the value is higher than both Freundlich and Temkin values but lower than Langmuir value. Therefore, the Dubinin-Radushkevich equation represents a better fit of experimental data than Langmuir model but is not in the both cases of Freundlich and Temkin models (Figure 1).
B. Kinetic Studies
Figure (2) shows that the amount of Cr(III) adsorption increases with time and it remains constant after a contact time of about 60 min. (i.e. equilibrium time). The equilibrium time is independent of initial Cr(III) concentration. The time profile of chromium uptake is a single, smooth and continuous curve leading to saturation, suggesting the possible multilayer coverage of chromium on the surface of the adsorbent.
0 100 200 300 400
0 20 40 60 80
Time (min)
A
m
o
u
n
t
a
d
s
o
rb
e
d
(m
g
/g
)
2336 mg/L 4320 mg/L
Fig.2 Adsorption kinetics of Cr(III) on CKD at different initial concentrations. Conditions 3 g/250 mL dose, 25 oC temperature and pH 0.5.
In order to examine the mechanism of adsorption process such as mass transfer and chemical reaction, a suitable kinetic model is needed to analyze the rate data. Many models such as homogeneous surface diffusion model and heterogeneous diffusion model (also known as pore and diffusion model) have been extensively applied in batch reactors to describe the transport of adsorbate inside the adsorbent particles [36-38]. The conformity between experimental data and the model predicted values was expressed by the correlation coefficient (r2, values close or equal to 1). A relatively high r2 value indicates that the model successfully describes the kinetics of Cr(III) adsorption.
i) Simple First Order Model
The sorption kinetics may be described by a simple first order equation [12,15]. The change in bulk concentration of the system using the following simple first order rate Equation (13):
t k o
t C e
C 1 (13)
Equation 13 can be rearrangement to obtain a linear form:
o 1
t t C
2.303 k
C log
log (14) Where Ct and Co are the concentration of Chromium at time t and initially (mg/L), respectively, and k1 is the first order rate constant, (1/min.).
The experimental results showed that the log Ct versus log t (Figure.3) for different initial concentrations of Cr(III) were deviated considerably from the theoretical data. A comparison of the results with the correlation coefficient is shown in Table.3, which indicates the failure in expressing this adsorption process by the simple first order kinetics. On the other hand, the literature review Sparks [39] has proposed that the simple kinetic models such as first- or second order rate equations are not applicable to the adsorption system with solid surfaces, which are rarely homogeneous like our CKD, because the effect of transport phenomena and chemical reactions are often experimentally inseparable. This trend was investigated also by Hossain, et al. [12] .
0 0.5 1 1.5 2 2.5 3 3.5 4
0 20 40 60 80
t (min)
lo
g
(C
t
)
2336 mg/L 4320 mg/L
ii)Pseudo Firs-order Model
The sorption kinetics may be described by a pseudo first order equation [12,25,40,41,42]. The differential equation is the following:
e t
1 t
q q k dt dq
(15) After integration by applying the initial conditions qt 0 at
0
t and qt qt at tt, Equation (15) becomes:
t k
q q
q
t e
e
303 . 2
log 1
(16) Equation (16) can be rearrangement to obtain a linear form:
qe q
qe k t303 . 2 log
log 1 (17) where qe and qt are amounts of chromium adsorbed at
equilibrium and at time t (mg/g), respectively, and k1 is the
equilibrium rate constant of pseudo first-order adsorption, (1/min).
Figure (4) shows a plot of linearization form of pseudo first-order model at all concentrations studied. The slopes and intercepts of plots of log
qeqt
versus t were used todetermine the pseudo first-order constant k1 and
equilibrium adsorption density qe . However, the
experimental data deviated considerably from the theoretical data. A comparison of the results with the correlation coefficients is shown in Table 3. The correlation coefficients for the pseudo first order kinetic model obtained at all the studies concentrations were low. Also the theoretical qe
values found from the pseudo first-order kinetic model did not give reasonable values. This suggests that this adsorption system is not a pseudo first-order reaction.
iii)Pseudo Second-order Model
The adsorption kinetics may also be described by a pseudo second-order equation [25,37,42,43,44,45,46]. The differential equation is the following:
22 e t
t k q q
dt
dq
(18)
-3 -2 -1 0 1 2 3
0 20 40 60 80
t (min)
lo
g
(q
e
-q
t
)
2336 mg/L 4320 mg/L
Fig.4 Plot of the pseudo first-order adsorption kinetics of Cr(III) on CKD at different initial concentration.
Units
Integrating Equation (18) and applying the boundary conditions, gives:
qe qt
qe k t2
1
1
(19)
Equation (19) can e rearranged to obtain a linear form:
t q q k
qt e e
1 1 1
2 2
(20)
where k2 is the equilibrium rate constant of pseudo
second-order adsorption (g/mg.min).
The slopes and intercepts of plots t/qtversus t were used
to calculate the pseudo second-order rate constants k2 and
e
q . The straight lines in plot of t/qt versus t Figure (5)
show good agreement of experimental data with the pseudo second-order kinetic model for different initial chromium concentrations. Table 3 lists the computed results obtained from the pseudo second-order kinetic model. The correlation coefficients for pseudo second-order kinetic model obtained were greater than 0.998 for all concentrations. The calculated qe values also agree very well with the
[image:5.595.142.539.77.327.2]experimental data. These indicate that the adsorption system studied belongs to the second order kinetic model. The similar phenomena are also observed in adsorption of dye RR189 on cross-linked chitosan beads [43], in adsorption of dye BB69 and DR227 on activated clay [44] and in adsorption of AB9 on mixed sorbents (activated clay and activated carbon) [42] and in adsorption of Chromium hexavalent on used black tea leaves [12].
Table .2 Langmuir, Freundlich, Temkin and Dubinin-Radushkevich constants
Langmuir Freundlich
KL aL Qo r2 % KF n r2 %
(L/g) (L/mg) (mg/g) (L/g)
5.102 0.01683 303.149 0.998 8.870 173.38 15.12 0.9831 1.102519
Temkin Dubinin-Radushkevich
B A r2 % q
m β E r2 %
(L/g) (mg/g) (mg2/J2) (J/mg)
0 0.05 0.1 0.15 0.2 0.25 0.3 0.35 0.4 0.45
0 20 40 60 80
t (min)
t/
qt
(g
.m
in
/m
g
)
[image:6.595.68.255.58.185.2]2336 mg/L 4320 mg/L
Fig.5 Plot of the pseudo second-order adsorption kinetics of Cr(III) on CKD at different initial concentration.
iv)Elovich Model
The Elovich model equation is generally expressed as [18,19]:
t
t exp βq
dt
dq α
(21) where is the initial adsorption rate (mg/g.min) and is the adsorption constant (g/mg) during any experiment. To simplify the Elovich equation, Chien and Clayton [18] assumed αt and by applying the boundary conditions
0
t
q at t0 and qt qtat tt equation (21) become:
tqt 1ln α 1ln
(22)
If Cr(III) adsorption fits the Elovih model, a plot of qt versus
tln should yield a linear relationship with a slope of
1 and an intercept of
1 lnα .Figure (6) shows a plot of linearization form of Elovich model at all concentrations studied. The slopes and intercepts of plots of qt versus ln
t were used to determine theconstant and the initial adsorption rate
α
. However, the experimental data deviated considerably from the theoretical data. A comparison of the results with the correlation coefficients is shown in Table 3. The correlation coefficients for the Elovich kinetic model obtained at all the studies concentrations were low. This suggests that this adsorption system is not an acceptable for this system.0 100 200 300 400
0 1 2 3 4 5
ln(t)
qt
(m
g
/g
)
2336 mg/L 4320 mg/L
Fig.6 Plot of the Elovich model for adsorption kinetics of Cr(III) on CKD at different initial concentration.
v) The Intra-particle Diffusion Model
The intra-particle diffusion model is expressed as [20,21,47]:
a id tk
R (23) A linearization form of the equation is followed by:
t a kR log id log
log (24) where Ris the percent of Cr(III) adsorbed, kid is a rate
factor (percent Cr(III) adsorbed per minute) and a depicts the adsorption mechanism.
Such plots may present a multilinearity [37,40], indicating that two or more steps take place. The first, sharper portion is the external surface adsorption or instantaneous adsorption stage. The second portion is the gradual adsorption stage, where intraparticle diffusion is rate-controlled. The third portion is the final equilibrium stage where intraparticle diffusion starts to slow down due to extremely low adsorbate concentrations in the solution.
Figure (7) show a plot of the linearized form of the intraparticle diffusion model at all concentrations studied. As shown in Figure (7), the external surface adsorption (stage 1) is completed before 5 min., and then the stage of intraparticle diffusion control (stage 2) is attained and continuous from 5 min to 30 min. Finally, final equilibrium adsorption (stage 3) starts after 30 min. the chromium (III) is slowly transported via intraparticle diffusion into the particles and is finally retained in the micropores. In general, the slope of the line in stage 2 is called as intraparticle diffusion rate constant, kid.
The rate parameters kid , together with the correlation
coefficients are also listed in Table 3.
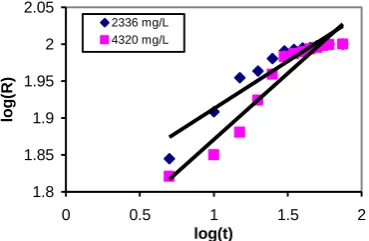
A comparison of calculated and measurement results for 4320 mg/L and 2336 mg/L concentrations are shown in Figures (8) and (9) respectively. As can be seen from these figures, the pseudo second-order kinetic model provides the best correlation for all of the adsorption process, whereas the Elovich model fits the experimental data well for an initial period of the adsorption process only. Hence it was concluded that the pseudo second-order kinetic model was found to be rate limiting, followed by the Elovich kinetic model. Similar phenomena are also observed in adsorption of chrome dye (OCRME) on mixed adsorbents-fly ash and coal [48], in adsorption of phenols on fly ash [49], in adsorption of lead (II) on cypress leaves [50], in adsorption of phosphorus on calcined alunite [25], and in adsorption of chromium (VI) on the activated carbon prepared from agricultural wastes [47].
1.8 1.85 1.9 1.95 2 2.05
0 0.5 1 1.5 2
log(t)
lo
g
(R)
[image:6.595.52.245.620.736.2]2336 mg/L 4320 mg/L
[image:6.595.312.497.637.757.2]Fig.8 Comparison between the measured and modeled time profiles for adsorption of Cr(III) (for initial concentration 2336 mg/L).
IV. CONCLUSION
Equilibrium and kinetic studies were made for the adsorption of chromium trivalent from aqueous solutions onto cement kiln dust (CKD) in the concentration range 2336 – 4320 mg/L at pH 0.5 and 298 K. the equilibrium data have been analyzed using Lanmguir, Freundlich, Temkin and Dubinin-Radushkevich isotherms. The characteristic parameters for each isotherm and related correlation coefficients have been determined. The Freundlich isotherm was demonstrated to provide the best correlation and the lowest total error for sorption of Cr(III) onto CKD.
The suitability of the fist and pseudo first- and second- order equations, Elovich kinetic model and intraparticle diffusion kinetic model for the sorption of Cr(III) onto CKD is also discussed. The pseudo second-order kinetic model agrees very well with the dynamical behavior for the adsorption of Cr(III) onto CKD for different initial Cr(III) concentrations over the whole range studied.
It may be concluded hat CKD may be used as low-cost, natural and abundant source for the removal of Cr(III) and it may be an alternative to more costly materials. It may also be effective in removing as well other harmful or undesirable species such as dyes, present in the waste effluents.
0 100 200 300 400 500 600
0 20 40 60 80
Tim e (m in)
qt
(m
g
/g
)
Exper. 1st Order Pseudo 1st order Pseudo 2nd order Elovich model Int rapart icle dif f usion
Fig.9 Comparison between the measured and modeled time profiles for adsorption of Cr(III) (for initial concentration 4320 mg/L).
REFERENCES
[1] Schneider, R.M., Cavalin, C.F., Barros, M.A.S.D., and Tavares, C.R.G., (2007), ―Adsorption of Chromium Ions in Activated Carbon‖, Chem. Eng. J., 132, pp.355-362. [2] Cooney, O. D, (1999) ―Adsorption Design for
Waste-water Treatment‖, Lewis Publishers.
[3] Youssef, A.M., El-Nabarawy, Th., and Samra, S.E., (2004) ―Sorption properties of chemically activated carbons. 1. Sorption of cadmium(II) ions‖, Colloids Surf. A, 235, pp.153–163.
[4] Selvi, K., Pattabhi, S., and Kadirvelu, K., (2001) ―Removal of Cr(VI) from Aqueous Solution by Adsorption onto Activated Carbon‖, Bioresour. Technol., 80, pp.87-89.
[5] Grover, M. and Narayanswamy, M.S., (1982) ―Removal of Hexavalent Chromium by Adsorption on Fly Ash‖, Institution of Engineers Indian, J. Environ. Eng., 63, pp.36-39.
[6] Deepak, D. and Gupta, A. K, (1991) ―A study on Removal of Chromium (VI) by Adsorption Lignite Coal‖, Ind. J. Environ. Pollut., 11, pp.241-245. [7] Kannan, N. and Vanangamudi, A., (1991) ―A Study on
Removal of Chromium Cr(VI) by Adsorption by Adsorption Lignite Coal‖, Ind. J. Environ. Pollut., 11, pp.241-245.
_ Pseudo 2nd order_________
__ Pseudo 1st order__________
__Simple 1st order__
r2 qe cal.
k2 r2
qe cal. k1
r2 k1
qe exp. Co
(mg/g) (g/mg.min)
(mg/g) (1/min)
(1/min) (mg/g)
(mg/L)
0.999 204.08
2.12×10⁻³
0.848 63.1865
0.05297 0.976
0.09925 194.667
2336
0.998 384.615
5.87×10⁻³
0.914 483.931
0.11492 0.982
0.0935 360.01
4320
Intra-particle diffusion ______ Elovich Model___________
r2 a
kid r2
α
β
(mg/g.min) (g/mg)
0.884 0.1279
60.956 0.904
3680.849 0.0464
0.929 0.1789
49.2045 0.931
794.596 0.01858
0 50 100 150 200 250
0 20 40 60 80
Tim e (m in)
qt
(
m
g
/g
)
Exper. 1st Order Pseudo 1st order Pseudo 2nd order Elovich model Int rapart icle dif f usion
[8] Chand, S., Agarwal, V.K., and Pavankumar, C., (1994) ―Removal of Hexavalent Chromium from Wastewater by Adsorption‖, Ind. J. Environ. Health, 36, pp.151-158. [9] Srinivasan, K., Balasubramaniam, N., and
Ramakrishna, T.V., (1988) ―Studies on Chromium Removal by Rice Husk Carbon‖, Ind. J. Environ. Health, 30, pp.376-387.
[10]Brown, P. A. and Allen, S. J., (2000) ―Metal removal from Wastewater Using Peat‖, Wat. Res., 34 (16), pp.3907-3916.
[11]Gupta, V.K., Gupta, M., and Sharma, S., (2001) ―Process Development for the Removal of Lad and Chromium from Aqueous Solutions Using Red Mud-an Aluminum Industry Waste‖, Water Res., 35, pp.1125-1134.
[12]Hossain, M.A., Kumita, M., Michigami, Y., and Mori,S., (2005) ― Kinetics of Cr(VI) Adsorption on Used Black Tea Leaves, J. Chem. Eng. Japan, 38(6), pp.402-406.
[13]Fahim, N.F., Barsoum, B.N., Eid, A.E., and Khalil, M.S., (2006) ―Removal of Chromium (III) drom Tannery Wastewater Using Activated Carbn from Sugar Industrial Waste”, J. Hazard Mater., 136(2), pp.303-309.
[14]Khan, N.A. and Mohamad, H., (2007, Jan./Feb.) ―Investigation on the Removal of Chromium (VI) from Waste-water by Sugarcane Bagasse‖, Water and Wastewater Asia, pp.37-41.
[15]Eligwe, C.A. and Okolue, N.B., (1994) ―Adsorption of Iron(II) by a Nigerian Brown Coal‖, Fuel, 73, pp.569-572.
[16]Lagergren, S.K., (1898) ―About the Theory of So-called Adsorption of Soluble Substances‖, Sven. Vetenskapsakad. Handingarl, 24, pp.1-39.
[17]Ho, Y.S., McKay, G., Wase Daj, and Foster, C.F., (2000) ―Study of the Sorption of Divalent Metal Ions onto Peat‖, Adsorp. Sci. Technol., 22, pp.51-64.
[18]Chien, S.H and Clayton, W.R., (1980) ―Application of Elovich Equation to The Kinetics of Phosphate Release and Sorption on Soils‖, Soil Sci. Soc. Am. J., 44, pp.265-268.
[19]Sparks, D.L., ―Kinetics of Reaction in Pure and Mixed Systems, in Soil Physical Chemistry‖, CRC Press, Boca Raton (1986).
[20]Srivastava, S.K., Tyagi, R. and Pant, N., (1989) ―Adsorption of Heavy Metal Ions on Carbonaceous Martial Developed from the Waste Slurry Generated in Local Fertilizer Plants‖, Wat. Res., 23, pp.1161-1165. [21]Weber, W.J. and Morris, J.C., (1963) ―Kinetics of
Adsorption on Carbon from Solution‖, J. Sanit. Eng. Div. Am. Soc. Civ. Eng., 89, pp.31-60.
[22]Ayres, D.M., Davis, A.P., and Gietka, P.M., (1994) ―Removing heavy metals from wastewater‖,report of Engineering Research Centre, University of Maryland, USA.
[23]Chapra, S.C. and Canale, R.P., (1998) ―Numerical Methods for Engineers‖, 3rd
edition, McGraw-Hill Co. Singapore,.
[24]Press, W.H., Flannery, B.P., Teukolsky, S.A., and Vetterling, W.T., (1989) ―Numerical Recipes in Pascal:
The Art of Scientific Computing‖, Cambridge University Press, Cambridge.
[25]Özacar, M., (2003) ―Equilibrium and Kinetic Modeling of Adsorption of Phosphorus on Calcined Alunite‖, Adsorption, 9, pp.125-132.
[26]Bajpai, A.K., Rajpoot, M., and Mishra, D.D., (2000) ―Static and Kinetic Studies on the Adsorption Behavior of Sulfadiazene‖, Adsorption, 6, pp.349-357.
[27]Agyei, N.M., Strydom C.A., and Potgieter, J.H, (2000) ―An Investigation of Phosphate Ion Adsorption from Aqueous Solution by Fly Ash and Slag‖, Cem. Concr. Res., 30, pp.823-826.
[28]Ho, Y.S. and McKay, G., (1999) ―Competitive Sorption of Copper and Nickel Ions from Aqueous Solution Using Peat‖, Adsorption, 5, pp. 409-417.
[29]Connor, P.A. and McQuillan,, A.J., (1999) ―Phosphate Adsorption onto TiO2 from Aqueous Solutions: An in Situ Internal Reflection Infrared Spectroscopic Study‖, Langmuir, 15, pp. 2916-2921.
[30]Sakadevan, K. and Bavor, H.J., (1998) ―Phosphate Adsorption Characteristics of Solids, Slags and Zeolite to be Used as Substrates in Constructed Wetland Systems‖, Wat. Res., 32(2), pp.393-399.
[31]Onar, A.N., Balkaya, N., and Akyüz, T., (1996) ―Phosphate Removal by Adsorption‖, Environ. Technol., 17(2), pp. 207-213.
[32] Baup, S., Jaffre, C., Wolbert, D., and Laplanche, A., (2000) ―Adsorption of Pesticides onto Granular Activated Carbon: Determination of Surface Diffusivities Using Simple Batch Experiments‖, Adsorption, 6, pp. 219-228.
[33]Bhargava, D.S. and Sheldarkar, S.B., (1993) ―Use of TNSAC in Phosphate Adsorption Studies and Relationships. Isotherm Relationships and Utility in the Field‖, Wat. Res., 27(2), pp. 325-335.
[34]Choy, K.K.H., McKay, G., and Porter, J.F., (1999) ―Sorption of Acid Dyes from Effluents Using Activated Carbon‖, Resources, Conservation and Recycling, 27, pp.57-71.
[35]Lin, S.H. and Juang, R.S., (2002) ―Heavy Metal Removal from Water by Sorption Using Surfactant-Modified Montmorillonite‖, J. Hazard. Mater., 92, pp.315-326.
[36]Fadali, O.A., Ebrahiem, E.E., Magdy, Y.H., Daifullah, A.A.M., and Nassar, M.M., (2005) ―Removal of Chromium from Tannery Effluents by Adsorption‖, J. Environ. Sci. Health, Part A Environ. Sci. Eng, 9, pp.465-472.
[37]Wu, F.C., Tseng, R.L., and Juang, R.S., (2001) ―Adsorption of Dyes and Phenols from Water on the Activated Carbons Prepared from Corncob Wastes‖, Environ. Technol., 22, pp.205-213.
[38]Raven, K.P., Jain, A., and Loeppert, R.H., (1998) ―Arsenite and Aresenate Adsorption on Ferrihydrite: Kinetics, Equilibrium, and Adsorption Envelopes‖, Environ. Sci. Technol., 32, pp.344-349.
[39]Sparks, D.L., (1989) ―Kinetics of Soil Chemical Processes‖, 1st
[40]Annadurai, G., Juang, R.S., and Lee, D.J., (2002) ―Use of Cellulose-Based Wastes for Adsorption of Dyes from Aqueous Solutions‖, J. Hazard. Mater., 92, pp.263-274. [41]Özacar, M. and Şengil, İ.A., (2002) ―Adsorption of Acid Dyes from Aqueous Solutions by Calcined Alunite and Granular Activated Carbon‖, Adsorption, 8, pp.301-308.
[42]Ho, Y.S. and Chiang, C.C., (2001) ―Sorption Studies of Acid Dye by Mixed Sorbents‖, Adsorption, 7, pp.139-147.
[43]Chiou, M.S. and Li, H.Y., (2002) ―Equilibrium and Kinetic Modeling of Adsorption of Reactive Dyes on Cross-Linked Chitosan Beads‖, J. Hazard. Mater., 93 (2), pp.233-248.
[44]Wu, F.C., Tseng, R.L., and Juang, R.S., (2001) ―Kinetics of Color Removal by Adsorption from Water Using Activated Clay‖, Environ. Technol., 22, pp.721-729.
[45]Wu, F.C., Tseng, R.L., and Juang, R.S., (2001) ―Kinetic Modelling of Liquid-Phase Adsorption of Reactive Dyes and Metal Ions on Chitosan‖, Wat. Res., 35(3), pp.613-618.
[46]Ho, Y.S. and McKay, G., (1999) ―Pseudo-Second Order Model for Adsorption Processes‖, Process Biochem., 34, pp.451-465.
[47]Demirbas, E., Kobya, M., Oncel, M.S., and Sencan, S. (2002) ―Removal of Ni(II) from Aqueous Solution by Adsorption onto Hazelnut Shell Activated Carbon: Equilibrium Studies‖, Bioresour. Technol., 84, pp.291-293.
[48]Gupta, G.S., Prasad, G., and Singh, V.N, (1990) ―Removal of Chrome Dye from Aqueous Solutions by Mixed Adsorbents: Fly Ash and Coal‖, Wat.,Res., 24, pp.45-50,.
[49]Singh, B. and Rawat, N.S., (1994) ―Comparative Sorption Kinetic Studies of Phenolic Compounds on Fly Ash and Impregnated Fly Ash‖, J. Chem. Tech. Biotechnol., 61, pp.57-65.