ABSTRACT
BREHL, DAVID EDWARD. 3-D Microstructure Creation Using Elliptical Vibration-Assisted Machining (EVAM). (Under the direction of Thomas A. Dow, Ph.D.)
In elliptical vibration-assisted machining (EVAM), a diamond cutting tool is made to move in a micrometer-scale elliptical path at high frequency. This oscillation is superimposed on the normal feed motion of the tool. Compared to diamond turning and spindle-type micromachining processes, EVAM has several advantages for making millimeter-scale and smaller structures. These include smaller machining forces, reduced vibration, elimination of runout error, and extended diamond life when cutting ferrous or brittle materials. To date EVAM has been used mostly to make binary and low aspect ratio / low relief features with vertical dimensions of only a few micrometers. The current research explored EVAM's ability to make 3-D microstructures with geometry typical of micro-optical, micro-fluidic, and MEMS devices.
The Ultramill EVAM tool previously developed at North Carolina State University was employed in this work. A new hydrostatic oil-bearing Y-axis was installed on the Nanoform diamond turning machine which improved surface finish by increasing stiffness in the depth of cut direction. To suppress thermal upsets which could cause form error, the Ultramill's original gravity-driven cooling system was replaced with a closed-circulation arrangement. At the small feed velocities used for microstructure fabrication, surface roughness after the cooling system conversion was found to be caused principally by coolant pump pulsations which partially offset the improvement gained from the stiffer Y-axis.
Existing 2-D kinematic and theoretical surface roughness relationships for EVAM were expanded to the general case of 3-D surfaces. Commercial CNC motion planning software could not calculate the complicated cutter compensation required by EVAM's elliptical tool path, so an innovative method was developed for motion program generation, based on surface morphology methods used in image processing and contact probe microscopy.
ii
A variety of 3-D parts were raster-cut with the Ultramill. Round-nosed diamond tools were used to make features with convex, concave, tilted planar and sculpted 3-D geometry. Positive features had heights up to 20 μm, and negative features depths as great as 130 μm. Height-to-width aspect ratios of 0.15 were achieved, compared to 0.01 for most previous parts. EVAM's ability to make functional components was demonstrated by fabrication of millimeter-scale reflecting optical surfaces. These included concave spherical elements with a form error of 62 nm RMS. A complex off-axis segment of an ellipsoidal surface was also made, as might be used in a free-space fiber optic beam splitter. This part had estimated centerline form error of ~480 nm RMS limiting its functional performance. A significant cause of this form error was found to be axis squareness error, rather than being assignable to the EVAM process.
3-D Microstructure Creation Using Elliptical Vibration-Assisted Machining (EVAM)
by
David Edward Brehl
A dissertation submitted to the graduate faculty of North Carolina State University
in partial fulfillment of the requirements for the Degree of
Doctor of Philosophy
Mechanical Engineering
Raleigh, NC
2014
APPROVED BY:
____________________________ ____________________________ Gregory A. Buckner Ronald O. Scattergood
____________________________ ____________________________
Thomas A. Dow Paul I. Ro
ii
BIOGRAPHY
iii
ACKNOWLEDGEMENTS
I would like to thank everyone who has given me guidance and instruction during my time at NC State University. The whole team at the Precision Engineering Center provided invaluable help, and I greatly enjoyed working in a research environment with such excellent facilities and exposure to such a wide variety of projects and disciplines. The following people deserve a personal thank-you:
Dr. Thomas Dow, my advisor, for giving me the chance to learn so much at the PEC,
Drs. Greg Buckner, Ron Scattergood, and Paul Ro, my committee members.
Alex Sohn and Ken Garrard, Research Engineers at the PEC, for all their help, knowledge, and support.
Dr. Dow, Alex, Matthew Cerniway, Nobu Negishi, and Brett Brocato for the work on the Ultramill 1999-2005. Standing on the shoulders of giants etc.
Brandon Lane, for keeping me updated on his work with EVAM after I left the PEC in 2008.
Karl Falter, PEC MS ’89, for his expertise with the Nanoform and for performing the Moore Y-axis integration.
Dr. Dow once more, for letting me have the experience of co-organizing the 2007 spring ASPE special topic meeting on vibration-assisted machining.
Ken Garrard, again, for his early suggestion of using morphology methods in motion-program planning, and for MATLAB routines for analyzing Zygo New View data.
Dr. John Ellis-Monaghan of IBM (PhD NCSU 1995) for the initial suggestion in 2003 to go back to grad school. I think I am grateful for this.
iv
Steve Brehl my brother, for dragging me back to ND at a critical time
Steve Brehl my cousin, for his general support and interest.
Marianne Brehl, for the timely reminder “finished is maybe more important than good”
This project was sponsored by the National Science Foundation, under NSF contract # DMI-0433215, Monitor: George Hazelrigg.
Additional financial support was received from Sandia National Laboratories, Oak Ridge National Laboratory, and Panasonic Boston Laboratory.
v
TABLE OF CONTENTS
LIST OF TABLES ... xi
LIST OF FIGURES ... xii
1 INTRODUCTION ... 1
1.1 OVERVIEW ... 1
1.2 MICROSTRUCTURE CREATION USING MECHANICAL MICROMACHINING ... 2
1.2.1 Mechanical Micromachining ... 2
1.2.2 Mechanical Micromachining Issues ... 4
1.3 VIBRATION-ASSISTED MACHINING ... 5
1.4 REVIEW OF MICROSTRUCTURE FABRICATION USING VAM ... 11
1.4.1 VAM Microstructure Examples ... 12
1.4.2 EVAM Experience at the Precision Engineering Center ... 14
1.5 OBJECTIVES OF THE CURRENT RESEARCH ... 16
2 3-D EVAM KINEMATICS AND THEORETICAL SURFACE ROUGHNESS ... 18
2.1 COORDINATE SYSTEM ... 18
2.2 EQUATIONS OF MOTION ... 19
2.3 EVAM CYCLE PARAMETERS ... 27
2.4 THEORETICAL EVAM SURFACE ROUGHNESS ... 28
3 EQUIPMENT DESCRIPTION and IMPROVEMENTS ... 32
3.1 ULTRAMILL-NANOFORM SYSTEM ... 32
3.2 ULTRAMILL EVAM TOOL ... 33
vi
3.4 NANOFORM DIAMOND TURNING MACHINE... 39
3.4.1 Description ... 39
3.4.2 Y-Axis Upgrade ... 41
3.4.3 Video Zoom Cameras ... 45
4 ULTRAMILL THERMAL STABILITY IMPROVEMENT ... 46
4.1 INTRODUCTION ... .46
4.1.1 Ultramill Temperature Variation ... 46
4.1.2 Heat Generation by Piezoelectric Actuators ... 47
4.2 OPEN- and CLOSED-CIRCULATION COOLING ... 48
4.3 FORM ERROR IMPROVEMENT WITH CLOSED-CIRCULATION COOLING ... 51
4.4 EXPERIMENT SETUP ... 52
4.5 UlLTRAMILL COOLING SYSTEM EXPERIMENTS ... 54
4.5.1 Overview ... 54
4.5.2 Coolant System Flow Rate ... 55
4.5.3 Energy Balance Test ... 55
4.5.4 Temperature Tests ... 56
4.5.5 Long-Duration Temperature Stability ... 59
4.5.6 Capacitance Gauge Tests ... 60
4.5.7 Machined Flats ... 62
4.6 SUMMARY of ULTRAMILL COOLING SYSTEM EXPERIMENTS ... 66
5 SINGLE-GROOVE MACHINING EXPERIMENTS ... 68
5.1 PREVIOUS ULTRAMILL SURFACE ROUGHNESS RESULTS ... 68
vii
5.3 SINGLE-GROOVE ROUGHNESS RESULTS. ... 70
5.3.1 Open-Circulation Cooling ... 70
5.3.2 Open-Circulation Cooling with Y-Axis Camera ... 75
5.3.3 Closed-Circulation Cooling ... 77
5.4 PROFILES OF EVAM FEATURES ... 78
5.4.1 Open-Circulation Cooling ... 78
5.4.2 Closed-Circulation Cooling ... 81
5.5 AUTOCOVARIANCE ANALYSIS OF EVAM FEATURES ... 82
5.6 SUMMARY ... 86
6 MOTION PROGRAM PLANNING ... 88
6.1 INTRODUCTION ... 88
6.1.1 Raster Machining of 3-D Surfaces ... 88
6.1.2 Cutter Compensation ... 89
6.2 MORPHOLOGY METHOD ... 92
6.2.1 “Dilation” and “Erosion” ... 92
6.2.2 MATLAB Program for Motion Program Generation ... 98
6.3 MORPHOLOGY METHOD VALICATION AND ACCURACY ... 102
6.3.1 Morphology Method Validation ... 102
6.3.2 Sensitivity to Upfeed Velocity and to Sloped Surfaces ... 109
7 3-D MICROSTRUCTURES MADE USING ROUND-NOSED TOOLS ... 115
7.1 INTRODUCTION ... 115
7.2 UPFEED KNIFE EDGE ... 116
7.2.1 Part Description, Motion Program, and Machining ... 116
viii
7.3 FLYING WING ... 121
7.3.1 Part Description, Motion Program, and Machining ... 121
7.3.2 Metrology Results ... 122
7.4 SCULPTED 3-D GEOMETRY (“POTATO CHIP” PART)... 128
7.4.1 Part Description, Motion Program, and Machining ... 128
7.4.2 Metrology Results ... 130
8 OPTICAL SURFACE FABRICATION: CONCAVE SPHERICAL REFLECTOR ... 147
8.1 PART DESIGN... 132
8.2 PART FABRICATION... 134
8.2.1 Motion Program and Machining Strategy ... 134
8.2.2 Machining Operations ... 135
8.3 METROLOGY RESULTS ... 137
8.3.1 Form Error ... 137
8.3.2 Surface Roughness ... 142
9 OPTICAL SURFACE FABRICATION: FIBER OPTIC BEAM BENDER ... 147
9.1 INTRODUCTION ... 147
9.1.1 Beamsplitter Concepts... 147
9.2 DEMONSTRATION REFLECTOR ... 150
9.2.1 Beam Bender Concept and Test Setup... 150
9.2.2 Optical Fiber Specification ... 151
9.2.3 Optical Surface Design ... 152
9.3 REFLECTOR FABRICATION ... 154
9.3.1 Machining Setup and Motion Program ... 154
ix
9.4 PERFORMANCE TEST ... 159
9.5 METROLOGY RESULTSs ... 163
9.5.1 Form Error ... 163
9.5.2 Surface Roughness ... 168
9.6 ERROR ANALYSIS of BEAM BENDER REFLECTOR ... 169
10 3-D MICROSTRUCTURES MADE USING SHARP-NOSE TOOLS ... 173
10.1 INTRODUCTION ... 173
10.1.1 Limitations of Round-Nosed Tools ... 173
10.1.2 Sharp-Nose Tools ... 174
10.1.3 Sharp-Nose Tool Cutting Edge Velocity ... 176
10.2 TETRAHEDRON ARRAYS ... 178
10.2.1 Part Design and Fabrication ... 178
10.2.2 Tetrahedron Results – SEM Imagery of Copper Parts ... 182
10.2.3 Tetrahedron Results – Burr Formation ... 184
10.2.4 Tetrahedron Results – Tool Wear ... 187
10.3 ADDITIONAL MACHINING EXPERIMENTS WITH SHARP-NOSE TOOLS ... 190
10.3.1 Grooves Made with 40º Nose-Angle Tool ... 190
10.3.2 Microchannel Stream Combiner ... 191
11 CONCLUSIONS and RECOMMENDATIONS FOR FUTURE WORK ... 196
11.1 CONCLUSIONS ... 196
11.2 RECOMMENDATIONS FOR FUTURE WORK ... 203
x
13 APPENDICES ... 212
13.1 APPENDIX A: MODELING OF EVAM SURFACE FEATURES ON A SLOPED SURFACE ... 213
13.2 APPENDIX B: MACHINING PROCEDURE FOR ULTRAMILL ... 225
13.3 APPENDIX C: ULTRAMILL ELLIPTICAL TOOLPATH VERIFICATION ... 229
13.4 APPENDIX D: ULTRAMILL VIDEO MICROSCOPE CAMERAS ... 232
13.5 APPENDIX E: TEMPERATURE MEASUREMENT FOR ULTRAMILL THERMAL EXPERIMENTS ... 245
13.6 APPENDIX F: LABVIEW BLOCK DIAGRAM FOR ULTRAMILL THERMAL EXPERIMENTS ... 248
13.7 APPENDIX G: ULTRAMILL ENERGY BALANCE ... 251
13.8 APPENDIX H: THEORETICAL INVESTIGATION of THE MINIMUM CHIP THICKNESS EFFECT IN EVAM ... 258
13.9 APPENDIX I: PROGRAM LISTING FOR UPFEED KNIFE-EDGE PART ... 276
13.10 APPENDIX J: PROGRAM LISTING FOR FLYING WING PART... 278
13.11 APPENDIX K: PROGRAM LISTING FOR “POTATO CHIP PART” (DOUBLE-SINUSOIDAL GROOVES) ... 287
13.12 APPENDIX L: PROGRAM LISTING FOR SPHERICAL REFLECTOR ... 294
13.13 APPPEDIX M: DERIVATION of ELLIPSOID REFLECTOR PROFILE ... 306
13.14 APPENDIX N: ELLIPSOID ROTATION TO MACHINING ORIENTATION ... 311
13.15 APPENDIX O: BEAM BENDER REFLECTOR MOTION CONTROL PROGRAM ... 314
13.16 APPENDIX P: TETRHEDRON TOOL ANGLE DERIVATION ... 328
xi
LIST OF TABLES
TABLE 3-1. ULTRAMILL-NANOFORM SYSTEM CONFIGURATIONS……….33 TABLE 3-2 PIEZOELECTRIC STACK ACTUATOR CHARACTERISTICS……….…36 TABLE 3-3. UPFEED SURFACE FINISH COMPARISON BETWEEN AIR-BEARING AND
HYDROSTATIC OIL-BEARING Y-AXIS………....42 TABLE 4-1. ESTIMATED PIEZO STACK THERMAL OUTPUT USING EQUATION 4-1 AND K=0.24
(TOTAL FOR 2 STACKS)……….……….………48 TABLE 4-2. EFFECT OF COOLANT FLOW RATE ON ULTRAMILL TEMPERATURE
OSCILLATIONS……….58 TABLE 4-3. TEMPERATURE AND TARGET POSITION VARIATION FOR CAP GAUGE TESTS……..62 TABLE 4-4. FIGURE ERROR AND SURFACE ROUGHNESS FOR FLATS MADE USING
CLOSED-CIRCULATION COOLING………65 TABLE 5-1. MACHINING CONDITIONS AND MATERIAL PROPERTIES FOR GROOVE PARTS
MACHINED USING OPEN-CIRCULATION COOLING………...…….71 TABLE 6-1. ERROR CAUSED BY STRUCTURING ELEMENT DISTORTION ON SLOPED
SURFACE………...112 TABLE 7-1. SURFACE ROUGHNESS OF SHALLOW SLOPES ON “FLYING WING” PART………….127 TABLE 8-1. MACHINING CONDITIONS FOR CONCAVE SPHERICAL REFLECTOR………...134 TABLE 8-2. AREA-BASED SURFACE ROUGHNESS FOR SPHERICAL REFLECTOR SURFACE MADE IN HARD-PLATED COPPER…….………..…145 TABLE 8-3. AREA-BASED SURFACE ROUGHNESS FOR SPHERICAL REFLECTOR SURFACE MADE IN ALUMINUM………....145 TABLE 9-1. MACHINING CONDITIONS FOR BEAM-BENDER REFLECTOR…..……….156 TABLE 9-2. RASTER PASSES, CROSSFEED SPACING, AND DEPTH OF CUT FOR REFLECTOR
SURFACE………..157 TABLE 9-3. BEAM BENDER PERFORMANCE………....161 TABLE 9-4. AREA-BASED SURFACE ROUGHNESS FOR ELLIPSOIDAL REFLECTOR SURFACE....161 TABLE 9-5. PREDICTED DEVIATION FROM DESIGN SURFACE CAUSED BY NANOFORM
SQUARENESS AND MOTION PROGRAM ERRORS.……….171 TABLE 10-1. SCHEMES FOR GROOVE CUTS FOR THE TETRAHEDRON ARRAYS………....181 TABLE 10-2. PROPERTIES OF MATERIALS USED FOR TETRAHEDRON FABRICATION
xii
LIST OF FIGURES
FIGURE 1-1. 2 TYPES OF VIBRATION-ASSISTED MACHINING. LEFT 1-D VAM RIGHT ELLIPTICAL
VIBRATION-ASSISTED MACHINING (EVAM)……….….6
FIGURE 1-2. COMPARISON OF 1-D VAM AND EVAM WHEN CUTTING A DOWNWARD TILTED SURFACE………..8
FIGURE 1-3. INSTANTANEOUS TOOL FORCE MEASUREMENTS FOR VAM. (TOP) PEAK 1-D VAM FORCES ARE THE SAME AS THE CONVENTIONAL FORCES. (BOTTOM) PEAK 2-D VAM FORCES ARE SMALLER THAN CONVENTIONAL TOOL FORCES………9
FIGURE 1-4. EFFECT OF DIAMOND TOOL WEAR FOR 1-D AND EVAM WHEN DIAMOND TURNING STEEL. (LEFT) AVERAGE TOOL FORCES AS A FUNCTION OF CUMULATIVE CUTTING DISTANCE. (RIGHT) SURFACE ROUGHNESS AS A FUNCTION OF CUMULATIVE CUTTING DISTANCE………...………...10
FIGURE 1-5. MOLDS MACHINED IN HARD STEEL USING EVAM [48]………...13
FIGURE 1-6. MICRO-CHANNELS IN MACHINED IN PLATED COPPER USING THE ULTRAMILL EVAM SYSTEM AND 50-µM NOSE RADIUS ROUND-NOSED DIAMOND TOOL. (LEFT) 3 µM DEEP CHANNELS (CENTER) BURR-FREE EDGE DETAIL OF 1.5 µM DEEP CHANNEL (RIGHT) EXIT DETAIL OF CHANNEL. [3]………13
FIGURE 1-7. SEM IMAGE AND INTERFEROGRAM OF 200 µM SQUARE ANGSTROM SYMBOL……15
FIGURE 1-8. INTERFEROGRAM AND SEM IMAGE OF THUNDERBIRD MADE IN 17-4 PH STAINLESS STEEL [3]………..…15
FIGURE 2-1. COORDINATE SYSTEM USED FOR EVAM………19
FIGURE 2-2. MOTION OF TOOL TIP IN EVAM………...……….……….21
FIGURE 2-3. IMPORTANT ANGLES WHEN MACHINING ON A SLOPED SURFACE…...……….24
FIGURE 2-4. DEPTH OF CUT FOR EVAM ON AN INCLINED SURFACE………..26
FIGURE 2-5. FORMATION OF SURFACE FEATURES IN EVAM…………...……….29
FIGURE 2-6. THEORETICAL PV SURFACE ROUGHNESS AS A FUNCTION OF UPFEED INCREMENT FUP AND FEED MOTION ANGLE Ζ………..………..31
FIGURE 3-1. ULTRAMILL CONCEPT……….34
FIGURE 3-2. CUTAWAY VIEW OF THE ULTRAMILL, SHOWING ITS FUNCTIONAL COMPONENTS………...35
xiii
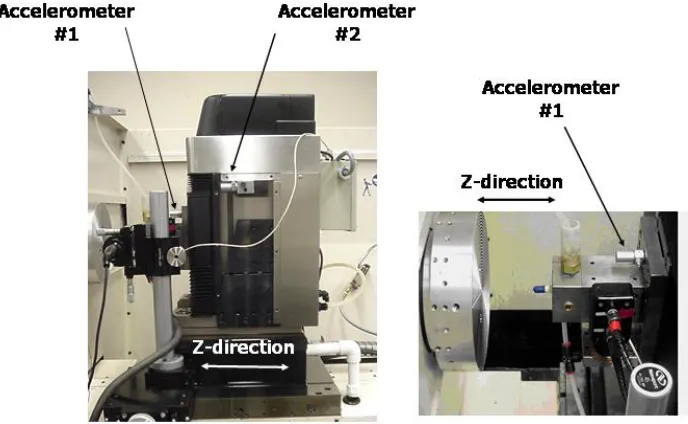
FIGURE 3-4. SEM IMAGES OF SINGLE-CRYSTAL DIAMOND TOOLS. (A) ROUND-NOSE GEOMETRY. TOOL SHOWN HAS 1 MM NOSE RADIUS. (B) SHARP NOSE TOOL. TOOL SHOWN IS “DEAD SHARP” WITH A NOSE ANGLE OF APPROXIMATELY 70º BETWEEN THE CUTTING EDGES……….………..38 FIGURE 3-6. ULTRAMILL INSTALLED ON NANOFORM DTM, WITH OIL-BEARING Y-AXIS. (LEFT)
PRIOR TO INSTALLATION OF Y-AXIS CAMERA (CONFIGURATION II). (RIGHT) Y-AXIS CAMERA INSTALLED (CONFIGURATION III-A/B). SIDEVIEW TOUCHOFF CAMERA
REMOVED IN THIS VIEW………40 FIGURE 3-7. ULTRAMILL BOLTED TO Y-AXIS CARRIER PLATE………...40 FIGURE 3-8. ACCELEROMETER LOCATIONS FOR Y-AXIS TESTING……….…....43 FIGURE 3-9. OSCILLOSCOPE RESPONSE, ACCELEROMETER 1, FOR OIL-BEARING Y-AXIS WITH
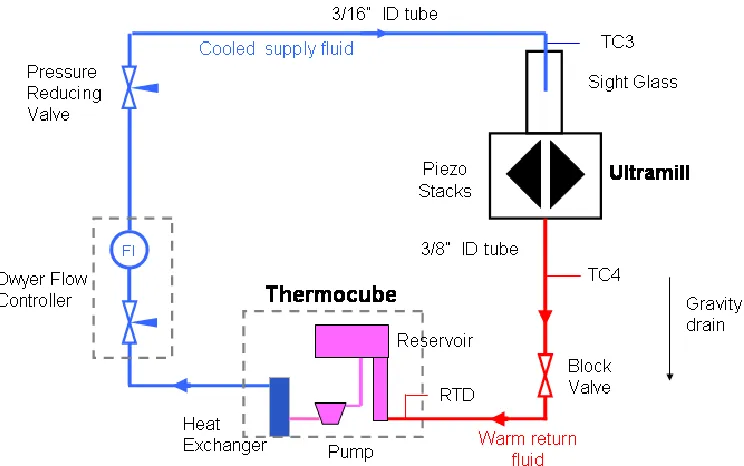
ULTRAMILL OPERATING AT 1000 HZ……….….43 FIGURE 4-1. OPEN-CIRCULATION COOLING ARRANGEMENT……….………..50 FIGURE 4-2. CLOSED-CIRCULATION COOLING CONFIGURATION………....50 FIGURE 4-3. CROSSFEED PROFILES FOR “POTATO CHIP” PART DESCRIBED IN CHAPTER 7,
OBTAINED BY WHITE-LIGHT INTERFEROMETRY. (LEFT) PROFILE FOR
OPEN-CIRCULATION COOLING SHOWS FORM ERROR BECAUSE OF ULTRAMILL TEMPERATURE VARIATION. (RIGHT) CLOSED-CIRCULATION COOLING NEARLY ELIMINATES FORM ERROR BY IMPROVING TEMPERATURE STABILITY………...51 FIGURE 4-4. THERMOCOUPLE INSTALLATION LOCATIONS ON ULTRAMILL………...52 FIGURE 4-5. (LEFT) VIDEO-MICROSCOPE PICTURE OF CAPACITANCE GAUGE AND ALUMINUM
TARGET INSTALLED ON TOOLHOLDER IN PLACE OF DIAMOND TOOL. (RIGHT) TARGET
MOTION RELATIVE TO CAPACITANCE GAUGE………...54
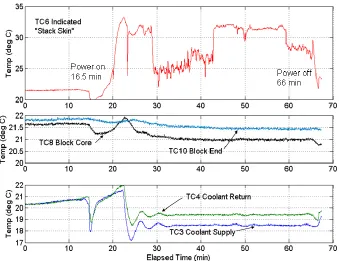
FIGURE 4-6. ULTRAMILL TEMPERATURES FOR OPEN-CIRCULATION COOLING
CONFIGURATION……….57
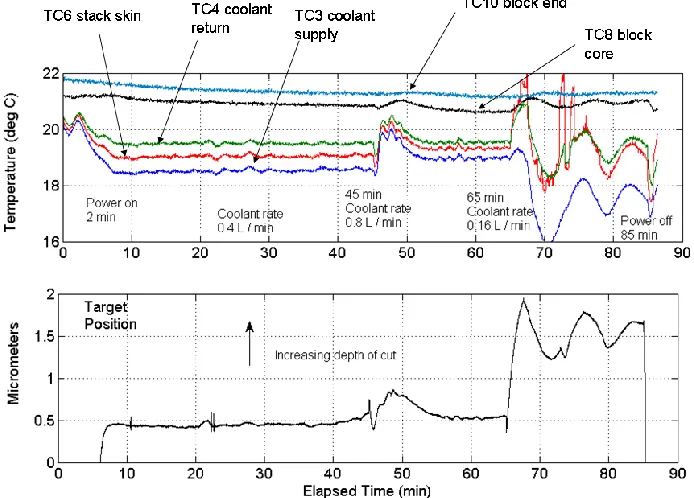
FIGURE 4-7. ULTRAMILL TEMPERATURES FOR MACHINING TEST USING
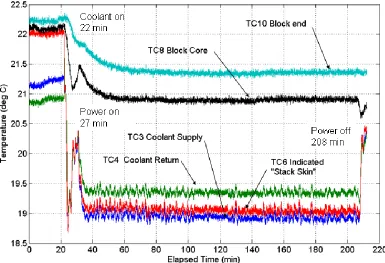
CLOSED-CIRCULATION COOLING. COOLANT FLOW WAS REDUCED FROM 0.4 L/MIN TO 0.16 L/MIN AT 38 MINUTES’ ELAPSED TIME………..……57 FIGURE 4-8. ULTRAMILL TEMPERATURES RECORDED DURING 3-HR LONG MACHINING RUN.
AFTER BLOCK TEMPERATURES TC8 AND TC10 REACH STEADY STATE AT 80 MINUTES, THEY SHOW VARIATION OF LESS THAN 0.1ºC……….…59 FIGURE 4-9. OPEN-CIRCULATION CAPACITANCE GAUGE TEST………..…61 FIGURE 4-10. CLOSED-CIRCULATION CAPACITANCE GAUGE TEST………..………...61 FIGURE 4-11. FORM ERROR BASED ON A 0.5 MM LONG X 0.4 MM WIDE AREA IN THE CENTRAL
xiv
FIGURE 4-12. SURFACE ROUGHNESS FOR RASTERED FLATS, OBTAINED FROM 0.017 MM X 0.013 MM MEASUREMENT AREAS (EACH POINT IS AVERAGE OF RMS SURFACE ROUGHNESS AT THREE LOCATIONS)………64 FIGURE 5-1. SKETCH OF THE SINGLE GROOVE TEST PART………...70 FIGURE 5-2. ROUGHNESS RESULTS – PARTS 60 (HARD-PLATED COPPER) AND 61
(1100 ALUMINUM)…………..………...…..….73 FIGURE 5-3. ROUGHNESS RESULTS BEFORE (PART 60) AND AFTER LAPPING THE TOOL
(PART 62)………...………...…..73 FIGURE 5-4. ROUGHNESS RESULTS – DEPTH OF CUT EFFECT ON PART 62………...74 FIGURE 5-5. SURFACE ROUGHNESS – Y-AXIS CAMERA INSTALLED (PART 148) VS. NO CAMERA
(PART 60)………....76 FIGURE 5-6. SURFACE ROUGHNESS COMPARISON BETWEEN CLOSED-CIRCULATION COOLING WITH Y-AXIS CAMERA (PART 158), OPEN-CIRCULATION COOLING WITH Y-AXIS CAMERA (PART 148), AND OPEN CIRCULATION COOLING ONLY (PART 62)………..…78 FIGURE 5-7. UPFEED PROFILES AT 8, 4, 2, 1, AND 0.2 MM/S FOR PART MADE IN PLATED COPPER USING FRESHLY-LAPPED TOOL (PART 62). OPEN-CIRCULATION COOLING….…………...80 FIGURE 5-8. PROFILES OF GROOVES MADE IN HARD-PLATED COPPER WITH
CLOSED-CIRCULATION COOLING. VERTICAL RANGE ON PANEL (A) IS 2 TIMES THAT OF THE OTHER TWO PANELS………..…………....82 FIGURE 5-9. AUTOCOVARIANCE PLOTS FOR SINGLE-GROOVE PARTS MADE WITH
OPEN-CIRCULATION (PART 62) AND CLOSED-OPEN-CIRCULATION COOLING (PART 169) …………..…..84 FIGURE 6-1. RASTER MACHINING SEQUENCE………..89 FIGURE 6-2. CUTTER COMPENSATION IN EVAM………..…90 FIGURE 6-3. (LEFT) “PROBE” DEFINITION (RIGHT) PROBE IN CONTACT WITH SURFACE AT
TANGENT POINT………..91 FIGURE 6-4. CREATING TOOLPATH OFFSET SURFACE J BY “PROBING” A SURFACE S....……..94
FIGURE 6-5. COMPARISON OF PROBE AND STRUCTURING ELEMENT……….…..95 FIGURE 6-6. CREATING IMAGE I BY DILATING SURFACE S WITH STRUCTURING
ELEMENT SE……….….…96
FIGURE 6-7. RECONSTRUCTING A SURFACE S*, BY ERODING THE IMAGE I FORMED IN FIGURE 6-6, USING STRUCTURING ELEMENT SE. THE NOTCH IN THE ORIGINAL SURFACE DOES NOT APPEAR IN THE RECONSTRUCTION DUE TO IT BEING SMALLER THAN CAN BE
xv
FIGURE 6-8. STRUCTURING ELEMENT GENERATED BY MORPH3D PROGRAM. ELEMENT SHOWN HERE IS BASED ON EQUATION 6-1 USING A 1 MM TOOL RADIUS AND 22 µM X 4 µM VIBRATION ELLIPSE………100 FIGURE 6-9. VALIDATION CASES FOR TESTING THE MATLAB MORPHOLOGY MOTION
PROGRAM………..………..……103 FIGURE 6-10. ACCURACY OF MORPHOLOGY METHOD FOR CONCAVE SPHERICAL SURFACE
PROBED BY HEMISPHERICAL STRUCTURING ELEMENT. “DEVIATION” IS THE DIFFERENCE IN Z COORDINATES BETWEEN THE THEORETICAL AND
PROGRAM-GENERATED IMAGE SURFACE……….………..………....105 FIGURE 6-11. MINIMUM DEVIATION Δ AS A FUNCTION OF CROSSFEED POSITION FOR 500-µM
RADIUS CONCAVE SPHERICAL SURFACE (SEE FIGURE 6-10) ………...………106 FIGURE 6-12. ACCURACY OF MORPHOLOGY METHOD FOR CONVEX SPHERICAL SURFACE
PROBED BY HEMISPHERICAL STRUCTURING ELEMENT. “DEVIATION” IS THE DIFFERENCE IN Z COORDINATE BETWEEN THE THEORETICAL AND
PROGRAM-GENERATED IMAGE SURFACE……….………..107 FIGURE 6-13. ACCURACY OF MORPHOLOGY METHOD FOR SINUSOIDAL SHEET PROBED BY
STRUCTURING ELEMENT BASED ON ELLIPSOIDAL FEED PATH. “DEVIATION” IS THE DIFFERENCE IN Z-COORDINATE BETWEEN THE THEORETICAL AND
PROGRAM-GENERATED IMAGE SURFACE……….…109 FIGURE 6-14. DISTORTION OF ELLIPTICAL VIBRATION PATH CAUSED BY UPFEED AND
VERTICAL FEED MOTION………110 FIGURE 6-15. TEST CASE FOR CHECKING SENSITIVITY TO MACHINING TILTED SURFACES…112 FIGURE 6-16. DEVIATION BETWEEN DESIRED AND ACTUAL SURFACE PRODUCED FOR TILTED
SURFACE CASE SHOWN IN FIGURE 6-14. FEED MOTIONS DISTORT THE STRUCTURING ELEMENT FROM IDEAL ELLIPTICAL VIBRATION PATH……….………113 FIGURE 7-1. LAYOUT SKETCH SHOWING CROSS-SECTION OF THE “KNIFE-EDGE” FEATURE.
NOTE BACKFEED STEP TO CREATE THE FEATURE, AS WELL AS THE CURVED LOWER PORTIN OF THE LEADING EDGE SLOPE DUE TO THE ELLIPTICAL VIBRATION PATH…….117 FIGURE 7-2. SEM IMAGE OF “KNIFE EDGE” FEATURE………..118
FIGURE 7-3. WHITE LIGHT INTERFEROGRAM AND PROFILE OF KNIFE-EDGE PART………119 FIGURE 7-4. DESIGN SKETCH FOR THE “FLYING WING” FEATURE………...………121 FIGURE 7-5. WHITE-LIGHT INTERFERORGRAMS OF THE “FLYING WING” PART, WITH PROFILES
AT TWO LOCATIONS SHOWING CONCAVE FORM ERROR IN THE STEEPLY SLOPED
xvi
FIGURE 7-6. SEM IMAGE OF “FLYING WING” FEATURE. (LEFT) OVERALL PART (RIGHT)
DETAIL SHOWING CONCAVE SLOPE AND LINEAR FEATURE ERRORS………...123
FIGURE 7-7. (TOP) WHITE-LIGHT INTERFEROGRAM SHOWING FLATNESS OF THE SHALLOW SLOPED SURFACE FORMING ONE OF THE REAR “WINGS”. (BOTTOM) PROFILES ALONG THE SPAN AND CHORD OF THE FLATNESS EVALUTATION AREA………...…125
FIGURE 7-8. PIEZO STACK TEMPERATURE WHILE MACHINING FINISH PASS OF THE FLYING WING……….…126
FIGURE 7-9. “POTATO CHIP” PART WITH 3-D SCULPTED GEOMETRY………..………129
FIGURE 7-10. WHITE-LIGHT INTERFEROGRAM OF THE “POTATO CHIP” PART. PART SHOWN WAS MADE USING CLOSED-CIRCULATION FOR THE ULTRAMILL………..129
FIGURE 7-11. UPFEED AND CROSSFEED PROFILES OF “POTATO CHIP PART” EXTRACTED FROM WHITE-LIGHT INTERFEROMETRY DATA AND PLOTTED USING MATLAB………...………..131
FIGURE 8-1. DESIGN DIMENSIONS OF SPHERICAL REFLECTOR……….…133
FIGURE 8-2. CENTERLINE CROSS SECTION OF CONCAVE SPHERICAL REFLECTOR………133
FIGURE 8-3. TOOLPATHS FOR 2 RASTER PASSES ON THE SPHERICAL REFLECTOR……….136
FIGURE 8-4. MACHINING SCHEME FOR THE CONCAVE SPHERICAL REFLECTOR……….136
FIGURE 8-5. GPI INTERFEROGRAMS OF SPHERICAL REFLECTORS MADE WITH THE ULTRAMILL. PLOTS SHOW DEVIATION OF THE SURFACE FROM THE DESIGN RADIUS OF CURVATURE (4.5 MM CONCAVE)………..………138
FIGURE 8-6. HOW X-Y SQUARENESS ERROR CAUSED ASTIGMATISM……….139
FIGURE 8-7. PREVENTING CROSSFEED TRENCH AT BASE OF CONCAVE PART (TOP) FRICTION IN Z-AXIS BALLSCREW NUT DURING REVERSAL OF DIRECTION CAUSES IT TO LAG BEHIND X-AXIS AT BOTTOM OF PART (BOTTOM) SLOWING DOWN X-AXIS AFTER Z-AXIS REVERSAL KEEPS THE TWO AXES SYNCHRONIZED………....140
FIGURE 8-8. WHITE-LIGHT INTERFEROMETRY PROFILES AT BOTTOM OF THE CONCAVE REFLECTOR (BEST-FIT SPHERE REMOVED). (LEFT) EFFECT OF Z-AXIS FRICTION ON MACHINES SURFACE (RIGHT) SUPPRESSION OF “TRENCH” FEATURE BY SLOWING DOWN X-AXIS AT REVERSAL POINT. HIGH-FREQUENCY FEATURES ARE CAUSED BY ULTRAMILL VIBRATION DUE TO PRESSURE PULSATIONS WITH CLOSED-CIRCULATION COOLING………..………142
FIGURE 8-9. LOCATION OF SURFACE ROUGHNESS MEASUREMENT ZONES………..…145
xvii
FIGURE 9-1. SCHEMATIC OF LIGHT PROPOGATING THROUGH AN OPTICAL FIBER BY TOTAL INTERNAL RELECTION, AND ANGLE OF ACCEPTANCE AND DIVERGENCE………..…147 FIGURE 9-2. FREE-SPACE BEAM SPLITTER WITH REFRACTING ELEMENTS TO COLLIMATE
LIGHT FROM THE SOURCE FIBER AND TO FOCUSE THE BRANCH BEAMS INTO THE
RECEIVING FIBERS………149 FIGURE 9-3. FIBER OPTIC BEAM SPLITTER, USING 3-D CURVED REFLECTOR……….……..149 FIGURE 9-4. CONCEPTUAL SKETCH SHOWING PHYSICAL IMPLEMENTATION OF REFLECTION
BEAM SPLITTER……….150 FIGURE 9-5. BEAM BENDER TEST SETUP FOR DEMONSTRATING THE FOCUSING REFLECTOR
CONCEPT………..……151 FIGURE 9-6. REFLECTION PROPERTY OF AN ELLIPSE. ANY RAY ORIGINATING AT FOCUS F1
(BLUE RAYS) IS REFLECTED AND PASSES THROUGH THE OTHER FOCUS, F2 (RED
RAYS)………152 FIGURE 9-7. LAYOUT OF ELLIPTICAL CENTERLINE PROFILE OF REFLECTOR SURFACE FOR THE BEAM BENDOR………...153 FIGURE 9-8. (LEFT) WORKPIECE SETUP FOR MACHINING BEAM BENDER REFLECTOR (RIGHT)
DESIGN SURFACE IS ROTATED THROUGH ANGLE Ψ TO ALIGN IT FOR MACHINING….…155 FIGURE 9-9. PREPARATION AND INSTALLATION OF THE ALUMINUM WORKPIECE USED TO
MAKE THE BEAM BENDER REFLECTOR. (A) MILLING 45º CHAMFERS. (B) WORKPIECE WITH CHAMFERS IN THE WORKHOLDER. (C) WORKPIECE AND WORKHOLDER
INSTALLED ON THE NANOFORM. A FEDERAL GAUGE IS USED TO ALIGN THE CHAMFERED WORK SURFACE WITH THE PLANE FORMED BY THE DTM’S X AND Y
AXES………..156 FIGURE 9-10. TEST SETUP FOR THE BEAM BENDER PART………...…159 FIGURE 9-11. INSTALLATION OF ALUMINUM WORKPIECE CONTAINING BEAM BENDER
REFLECTOR, SOURCE, AND RECEIVING FIBERS………...….160 FIGURE 9-12. SKETCHES SHOWING EXPECTED AND ACUTAL IMAGES OBTAINED BY
PROJECTING THE REFLECTED BEAM ONTO A WHITE CARD. THE REFLECTOR HAS FIGURE ERROR, SO THE ACTUAL IMAGE IS TOO LARGE FOR THE BEAM BENDER TO WORK AT HIGH EFFICIENCY………..162 FIGURE 9-13. COMPOSITE INTERFEROGRAM OF REFLECTOR, OBTAINED BY USING NEW VIEW
WHITE-LIGHT INTERFEROMETER TO STITCH 72 HIGH-MAGNIFICATION DATA SETS……163 FIGURE 9-14. MEASURED (FROM WHITE-LIGHT- INTERFEROMETRY) AND DESIGN PROFILES
xviii
FIGURE 9-15. REFLECTOR CENTERLINE PROFILE DETAILS (CALLED OUT FIGURE 9-14). …...166 FIGURE 9-16. DEVIATION BETWEEN DESIGN AND MEASURED REFLECTOR SURFACES ALONG
CENTERLINE, USING LEVELING AN ALIGNMENT SHOWN IN FIGURES 9-14 AND 9-15...167 FIGURE 9-17. MEASUREMENT ZONES FOR SURFACE ROUGHNESS………...168 FIGURE 9-18. ESTIMATED DEVIATION PROFILES BETWEEN DESIGN AND PREDICTED
REFLECTOR SURFACE, FOR COMBINED SQUARENESS AND VIBRATION PATH ERRORS. NOTE APPARENT TOOL FEED DIRECTION IS DRAWN OPPOSITE OF THAT FOR CENTERLINE PROFILES IN FIGURES 9-14 AND 9-15.………...172 FIGURE 10-1. COMPARISON OF GROOVES OF EQUAL DEPTH MADE BY ROUND-NOSED TOOLS
WITH NOSE RADII OF 1 MM AND 50 µM………..….173 FIGURE 10-2. (LEFT) SHARP-NOSE TOOL WITH 40º NOSE-ANGLE (RIGHT) GROOVES AND
POSITIVE FEATURES (RIDGES) POSSIBLE WITH 40º NOSE-ANGLE TOOL………...175 FIGURE 10-3. THEORETICAL CROSSFEED SURFACE FEATURE HEIGHT FROM DEAD-SHARP
TOOLS………...…175 FIGURE 10-4. ALTERNATE SHARP-NOSE TOOL GEOMETRIES TO PRODUCE BETTER SURFACE
ROUGHNESS THAN CAN BE CREATED WITH DEAD-SHARP TOOLS……….…176 FIGURE 10-5. RAKE FACE VIEW OF ROUND-NOSE AND SHARP-NOSE TOOLS……….…...177 FIGURE 10-6 MAKING TETRAHEDRONS BY ROTATING SPINDLE 60º BETWEEN EACH SET OF
CUTS……….….179 FIGURE 10-7. SUCCESSIVE TOOL PASSES IN SAME GROOVE AT INCREASING DEPTH OF
CUT………...………....….181 FIGURE 10-8. SEM IMAGES OF TETRAHEDRON ARRAY MACHINED IN HARD-PLATED COPPER.
SMALL INTERSTITIAL FEATURES WERE CAUSED BY TOOL CENTERING ERROR………....183 FIGURE 10-9. SEM IMAGES OF TETRAHEDRONS MACHINED IN OFHC COPPER (LEFT) BURR
RESULTED WHEN ONLY ROUGHING CUTS WERE USED. (RIGHT) BURR WAS REDUCED BY USING FINISHING CUTS………....183 FIGURE 10-10. SEM IMAGES OF TETRAHEDRONS MACHINED IN HARD-PLATED COPPER.
(LEFT) SLIGHT BURR ON FEATURE EDGES WHEN ONLY ROUGHING CUTS WERE USED. (RIGHT) FINISH CUTS ELIMINATED BURR………..………184 FIGURE 10-11. BURR FORMATION IN TETRAHEDON FEATURES MADE FROM DIFFERENT
MATERIALS……….………185 FIGURE 10-12. BINARY THUNDERBIRD FEATURE MACHINED IN 17-4 PH STAINLESS STEEL
USING 1 MM RADIUS ROUND-NOSED TOOL. DETAIL OF WING FEATURE SHOWS
xix
FIGURE 10-13. FESEM IMAGES SHOWEING WEAR ON DEAD-SHARP DIAMOND TOOL AFTER ACCUMULATING 2 M RASTER MACHINING DISTANCE IN 17-4 PH STAINLESS STEEL AND 1.6 M IN COPPER……….188 FIGURE 10-14. WEAR OF ROUND-NOSED DIAMOND TOOL AFTER IT WAS USED TO CUT TOOL
STEEL WITH EVAM. SEM IMAGES TAKEN AFTER 20 M RASTER MACHINING
DISTANCE………189 FIGURE 10-15. SEM IMAGES COMPARING WEAR OF DEAD-SHARP AND ROUND-NOSED
DIAMOND TOOLS AFTER APPROXIMATELY 2 M RASTER MACHINING DISTANCE IN 17-4 PH STAINLESS STEEL……….………..189 FIGURE 10-16. SHARP-NOSE TOOL WITH 40 DEGREE INCLUDED NOSE ANGLE AND ROUNDED
TIP. SEM IMAGE………191 FIGURE 10-17. DETAILS OF GROOVES MADE IN HARD-PLATED COPPER USING THE 40º
NOSE-ANGLE TOOL SHOWN IN FIGURE 10-16. NOTE ABSENCE OF BURR. SEM IMAGES……..…191 FIGURE 10-18. DESIGN SKETCH FOR MICROMIXER MADE WITH SHARP-NOSE TOOL……..…...192 FIGURE 10-19. SEM IMAGES SHOWING RESULTS OF MICROMIXER FABRICATION EXPERIMENT.
(LEFT) CHANNEL JUNCTION ERROR. (RIGHT) DETAIL OF JUNCTION SHOWING RIBBON
BURRS ON CHANNEL FLOOR………..……192 FIGURE 10-20. CROSSFEED PROFILE SHOWING LINEAR FORM OF MICROMIXER RESERVOIR
WALL AND FLOOR, OBTAINED BY WHITE-LIGHT INTERFEROMETERY……….193 FIGURE 10-21. (LEFT) UPFEED SURFACE PROFILE OF SIDEWALL. (RIGHT) AUTOCOVARIANCE
PLOT FOR THE SIDEWALL PROFILE……….……….193 FIGURE A-1. TWO CONSECUTIVE TOOL PASSES MODELED BY MATLAB. THE LOWER HALF OF
EACH TOOL PASS IS SHOWN. THE LOWER HALF OF EACH TOOL PASS IS DEFINED OVER A LENGTH 2*@+0.5*FUP. STARTING POINT FOR THE SECOND PASS IS DISPLACED FUP IN THE
UPFEED DIRECTION………..214 FIGURE A-2. SUCCESSIVE CALCULATED TOOL PASSES, WITH STARTING POINTS FUP APART.
NOTE HOW OVERLAPPING TOOL PASSES PRODUCE MULTIPLE POINTS (X, Z) FOR EACH VALUE OF X.………...…214 FIGURE A-3. THEORETICAL SURFACE, CALCULATED BY REMOVING ALL BUT THE
BOTTOMMOST POINTS AT EACH VALUVE OF X, FROM THE OVERLAPPING TOOL PASS TRACES IN FIGURE A-2(B)………...…215 FIGURE C-1. PROFILES OF TEST GROOVE. SPIKE-LIKE FEATURES IN ENTRANCE (A) AND EXIT
xx
FIGURE D-1. Y-AXIS CAMERA—CRITICAL DIMENSIONS FOR LAYOUT.………..………....234 FIGURE D-2. SCREEN SHOT OF MONITOR SHOWING Y-AXIS CAMERA CROSSHAIRS
POSITIONED ON A FEATURE OF INTEREST……….235 FIGURE D-3. SCHEME FOR USING THE Y-AXIS CAMERA TO POSITION THE TOOL TIP AT A
DESIRED POINT ON THE WORKPIECE.……….236 FIGURE D-4. EXAMPLE OF AVERAGING THE LOCATION OF FEATURE EDGES TO ESTIMATE
CAMERA OFFSETS ΔX AND ΔY. FEATURE EDGES IN SKETCH ARE SHOWN MORE
CLEARLY THAN ON REAL FEATURES AS THEY APPEAR IN CAMERA MONITOR……...237 FIGURE D-5. SKETCH SHOWING PLUNGE CUT FEATURES MADE BY DIFFERENT TOOLS.
22 µM X 4 µM VIBRATION ELLIPSE AND DEPTH OF CUT 1 µM………..…...237 FIGURE D-6. (LEFT) TOUCHOFF CAMERA INSTALLATION WHEN WORKPIECE HAS BEEN
TURNED FLAT TO OPTICAL QUALITY FINISH. (RIGHT) MONITOR VIEW SHOWING TOOL AND REFLECTION IN WORKPIECE...240 FIGURE D-7. TOUCHOFF CAMERA INSTALLED IN ALTERNATE POSITION PROVIDING ANLGED
VIEW OF SURFACE………..………..242 FIGURE E-1. THERMOCOUPLE INSTALLATION LOCATONS ON ULTRAMILL………...……246 FIGURE F-1. LABVIEW CONFIGURATON AND CONTROL FOR THERMAL MEASUREMENT
CARD.………....……249 FIGURE F-2. TEMPERATURE RECORDING AND DISPLAY BLOCK………...249 FIGURE F-2. TEMPERATURE RECORDING AND DISPLAY BLOCK………...249 FIGURE F-3. TEMPERATURE RECORDING AND DISPLAY BLOCK………...250 FIGURE G-1. ULTRAMILL ENERGY BALANCE……….….252 FIGURE G-2. ULTRAMILL TEMPERATURE DATA DURING ENERGY BALANCE TEST.
HALF-ROUND STACKS OPERATING AT 1000 HZ FREQUENCY AND APPLIED VOLTAGE OF 400 VPP. THERMOCUBE SETPOINT 20ºC. PLASTIC THERMAL BARRIER IN PLACE.
ULTRAMILL ENERGY BALANCE………..….….254 FIGURE G-3. ULTRAMILL ENERGY BALANCE FOR TEMPERATURE DATA SHOWN IN FIGURE G-2.
HALF-ROUND STACKS OPERATING AT 1000 HZ FREQUENCY AND APPLIED VOLTAGE OF 400 VPP. THERMOCUBE SETPOINT = 20ºC. PLASTIC THERMAL BARRIER IN
PLACE………...………255 FIGURE H-1. SPANZITFEL HYPOTHESIS APPLIED TO UPFEED FEATURE FORMATION IN
xxi
FIGURE H-2. COMPARISON OF ACTUAL SURFACES AND SIMULATED SURFACE BASED ON THE MINIMUM CHIP THICKNESS EFFECT AT TWO UPFEED VELOCITIES. (LEFT) PROFILES OBTAINED FROM ACTUAL SURFACES. (RIGHT) SIMULATED PROFILES.………..……261 FIGURE H-3. COMPARISON OF SIMULATED SPANZITFEL ROUGHNESS AND ACTUAL RESULTS
FOR PART 62 (OPEN-CIRCULATION COOLING AND FRESHLY LAPPED
TOOL).………...…………262 FIGURE H-4. GENERATION OF SURFACE FROM TWO SUCCESSIVE TOOL PASSES....………264 FIGURE H-5. GENERATION OF SPANZITFEL………....………265 FIGURE H-6. SURFACE GENERATED WHEN THE THIRD TOOL PASS MISSES THE SPANZITFEL
PREVIOUSLY GENERATED……….………....………266 FIGURE H-7. FEATURE HEIGHT IS REDUCED BY THE THIRD TOOL PASS WHEN UPFEED
INCREMENT IS SMALL, RELATIVE TO SPANZITFEL HEIGHT……….…………....………266 FIGURE M-1. LAYOUT OF SOURCE AND RECEIVING FIBERS FOR THE BEAM BENDER. THE
FIBER CENTERLINES DEFINE AND XZ COORDINATE SYSTEM..…………....………306 FIGURE M-2. FINDING SOURCE BEAM INTERSECTION WITH ELLIPTICAL REFLECTOR SURFACE, AND THE ANGLE OF REFLECTED BEAM ENTERING THE RECEIVING FIBER…………...…..310 FIGURE N-1. ROTATION OF ELLIPSOID REFLECTOR FROM “PART COORDINATE SYSTEM” (TOP)
TO MACHINING COORDINATE SYSTEM (BOTTOM)………..311 \FIGURE P-1. TETRAHEDRON SLICED FROM A CUBE CORNER………...328 FIGURE P-2. BASE TRIANGLE OF A TETRAHEDRON………..330 FIGURE P-3. INTERIOR TRIANGLE OF A TETRAHDRON……….…...…330 FIGURE Q-1 CUT FIRST MEASUREMENT GROOVE WITH SPINDLE AT INITIAL ROTATION
ANGLE………..…333 FIGURE Q-2 ROTATE SPINDLE 180 DEGREES ………..………...…333 FIGURE Q-3 CUT SECOND GROOVE AFTER ROTATING SPINDLE 180 DEGREES……….…334 FIGURE Q-4 ROTATE SPINDLE BACK TO ORIGINAL POSITION AND MEASURE GROOVE
SEPARATION ………..………...…335 FIGURE Q-5 MEASUREMENT OF CENTERING FEATURES CUT INTO WORKPIECE. THE
CENTERLINE DISTANCES OF THE X AND Y FEATURES ARE CALCULATED USING
MEASUREMENTS OF THE Y CENTERING GROOE EDGES (Y1 AND Y2) AND ENDPOINTS OF
1
INTRODUCTION
1.1
O
VERVIEWMicrostructures can be defined as manufactured 2-D or 3-D features with critical dimensions ranging from several millimeters to smaller than 1 μm [15]. They can be functional small-scale devices in themselves, or features of a larger component. Accurate, economical microstructure generation is essential to the success of miniature products such as micro-electromechanical systems (MEMS), micro-optics, microfluidic “lab-on-a-chip” packages, and replication masters for molding-type processes.
Mechanical machining processes such as micro-milling and diamond turning can create microstructures with complex geometry [14, 15, 17]. When used with single-crystal diamond tools, such methods can achieve optical-quality surface finishes in ductile metals. However spindle-type cutting processes are plagued by issues such as runout, tool deflection and vibration, which limit the minimum feature size and tolerance. Moreover diamond tools wear at unacceptably high rates when machining ferrous metals and many brittle materials of interest.
2
1.2
M
ICROSTRUCTURESM
ADE BYM
ECHANICALM
ICROMACHINING1.2.1
Mechanical Micromachining
Microdevice fabrication methods have been researched for more than two decades. Lithography-based techniques adapted from the semiconductor industry are used to make many kinds of MEMS and microfluidic devices. These processes are typically limited to silicon-type materials and are usually economical only at large production volumes. Also lithography can only make 2-1/2 D and stepwise planar 3-D geometries. In silicon devices anisotropic etch behavior results in arbitrary side wall angles in the depth direction. Other processes exist that can create micro-structures with complex 3-D geometry, including focused ion beam milling (FIB), laser ablation, micro-electrodischarge machining (micro-EDM), micro-electrochemical machinining (micro-ECM), and LIGA1. Each of these techniques has limitations: extremely low material removal rate (FIB), limited material range (LIGA, micro-EDM and micro-ECM), or large tolerances and/or low resolution (laser ablation methods, micro-EDM) [2, 6].
Mechanical micromachining is the adaptation of traditional chip-making processes, such as turning or milling, to the micro-scale. These processes overcome several disadvantages of other microfabrication techniques. They can produce features with complex sculpted 3-D geometry and optical-quality surface finish in polymers, ductile metals such as aluminum, copper, and electroless nickel, as well as semiconductor materials including silicon and germanium [14]. Material removal rates are 103 to 105 μm3/s, comparable to laser methods and at least three orders of magnitude greater than for FIB milling. Dimensional tolerances
3
are typically in the 0.2 to 1.0 µm range, compared to 0.02 to 0.2 µm for FIB [2]. For applications where such precision is acceptable, mechanical micromachining offers a set of microstructure fabrication processes with large potential.
Two important types of mechanical micromachining are single-point diamond-turning (SPDT), and micro-milling based on high-speed spindles. SPDT uses diamond tools and lathe-configuration diamond turning machines (DTM's) to create optical-quality surfaces with nanometer-amplitude surface roughness. In general, feature geometries are limited to those which can be made by turning or facing operations, and the tool clearance angle limits the maximum slope of the cut surface. In SPDT the primary feed motion is achieved by rotating the workpiece past a "fixed" tool while surface form can be created by short-range tool moves in the depth of cut direction. The depth of cut variations may be made by the Z-axis (turning and slow slide servo) or by using a fast tool servo (FTS). The FTS is a high-bandwidth auxiliary axis which changes the depth of cut as a function of workpiece angular position and radius from rotational centerline. However short stroke length, frequency of operation, and machine dynamics of the tool servo make it difficult to create small high-aspect ratio features. For example, Panusittikorn [40] cut concave cylindrical and spherical surfaces that were over 100 μm deep, but which were longer than 5 mm in the tangential direction (an aspect ratio of 0.02). Long-range fast tool servos under development [7, 9] will eventually increase aspect ratio and vertical dimension range.
4
from cobalt-steel blanks using FIB. Takeuchi et al [45] and Kawai et al [24] used diamond pseudo-ball end-mills with multi-axis precision CNC machines to create 3-D figurines with submillimeter details in gold and copper. Machining time for these parts was as long as 36 hours due to the low material removal rate resulting from the small tool diameter. Micro-flycutting is illustrated by Takeuchi et al [15, 46] who made a variety of microstructured surfaces using spindle-driven single-crystal diamond tools. These microstructures, cut in brass, were 20 to 50 μm deep with aspect ratios exceeding one. Different feature cross-sections (e.g. rectangular, trapezoidal, triangular, etc.) were made by using diamond tools of several different cross-sections. To increase the variety of feature geometries, the cutting spindle axis was oriented at different angles to the workpiece which itself was fed along a single direction.
1.2.2
Mechanical Micromachining Issues
Micro-milling can make a wide range of 3-D geometries, complimenting those achievable by diamond turning. However accuracy and resolution of spindle-driven tools is reduced by several error sources. These include runout, chatter, and deflection of long tool shafts under machining loads. The minimum feature size is limited by the diameter of the tool. However as the tool diameter is reduced to improve resolution, tool deflection becomes more severe and tool strength is reduced. Smaller-diameter tools require higher spindle RPM to maintain the same cutting velocity. Preparation of milling-type tools is potentially a time-consuming, expensive operation as demonstrated in several of the above examples which used FIB machining to shape cutting edge profiles.
5
carbon to interact with with the workpiece metal [41, 54]. Activation energy studies indicate the loss of carbon from the diamond occurs through formation of carbon or metal-carbon-oxygen compounds in the workpiece, rather than by graphitization [29]. Brittle materials including glass also cause rapid diamond wear, although by mechanical abrasion instead of chemical mechanisms [27, 28]. Other tool materials such as tungsten carbide and cubic boron nitride (CBN) resist wear when machining ferrous metals, but are incapable of producing optical quality finishes. They can also produce severe edge burr when cutting non-ferrous metals such as brass [15, 47]. These material issues have helped limit mechanical micromachining's scope of application.
1.3
V
IBRATION-A
SSISTEDM
ACHININGSince the late 1980s, vibration-assisted machining (VAM) has been investigated as a way to overcome some of the limitations of mechanical micro-machining processes [4]. In VAM the tool oscillates at high frequency in a repeating path with an amplitude of roughly 1 to 20 μm. This vibratory motion is superimposed on the primary feed motion, so that the tool periodically breaks contact with the uncut workpiece material. As shown by Figure 1-1 the vibration can be reciprocating (1-D VAM) or elliptical (EVAM). Because the direction of vibration is normal to the tool rake face and in the same direction as the primary workpiece feed motion, VAM somewhat resembles flycutting and horizontal milling.
The absence of a high-speed spindle eliminates runout error. VAM possesses other significant advantages:
6
Figure 1-1. 2 types of vibration-assisted machining. left 1-D VAM right Elliptical vibration-assisted machining (EVAM)
Extended tool life when machining ferrous and brittle materials – When diamond tools are used to machine ductile metals like copper or aluminum, tool life can reach tens of kilometers' machining distance.2 But when diamond is used to cut steel, the surface finish (indicative of tool cutting edge condition) deteriorates drastically in only a few meters. In VAM acceptable surface finish in steel is maintained after more than 2000 meters [5, 28, 50, 56]. Dornfeld [15] asserts that vibration-assisted machining is presently the only practical, economic method for diamond-turning ferrous metals. VAM also extends tool life when cutting glass and other brittle materials [27, 37, 55].
Near-elimination of burr on the edges of machined features [6, 8, 33, 39].
7
Ductile regime machining of brittle materials at increased depth -- Ductile regime cutting produces low surface roughness in glass and other brittle materials by eliminating brittle damage in the machined surface [21, 28, 44, 64]. Unfortunately for many important materials the ductile cutting depth is submicrometer for conventional diamond turning. With VAM, Moriwaki, Shamoto and Inoue [37] and Suzuki et al [55] were able to increase the depth of cut for ductile cutting of soda-lime glass by a factor of 15. Increased ductile machining depth has also been demonstrated for calcium fluoride [55], silicon carbide [39], tungsten carbide [32, 55], zirconia ceramic [55], fused silica [21], and brittle plastics [26]. This advantageous behavior is believed to derive from overlapping cutting passes erasing the brittle damage generated by previous passes [28, 39, 44]. Klocke and Rubenach [28, 44] argue that for glass, VAM parameters can be selected to optimize the strain rate, plastic flow and initial contact stress, to form continuous chips characteristic of true ductile machining.
EVAM vs 1-D VAM
EVAM offers additional advantages compared to 1-D VAM:
8
1-D VAM -- Tool can hit the workpiece during backfeed portion of cycle
EVAM - Tool clears the surface
Figure 1-2. Comparison of 1-D VAM and EVAM when cutting a downward tilted surface
9
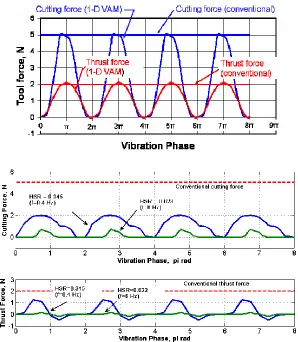
Figure 1-3. Instantaneous tool force measurements for VAM. (top) Peak 1-D VAM forces are the same as the conventional forces. (bottom) Peak 2-D VAM forces are smaller than
conventional tool forces. Redrawn from data in [49]
10
geometry. When the ellipse major axis is horizontal (aligned to the principal feed
direction), force reduction is due to very thin chips being cut during each vibration cycle. When the ellipse major axis is vertical, the thrust force becomes negative as the friction with the moving tool rake face helps “pull” the chip away from the workpiece.
Improved diamond life in ferrous metals-- Shamoto and Moriwaki [50] measured tool force and surface roughness as a function of cumulative machining distance while diamond-turning steel. They used an ultrasonic-frequency system capable of both 1-D VAM and EVAM. Figure 1-4 plots their results for time-averaged cutting and thrust forces, showing that these are smaller for EVAM compared to 1-D VAM. Furthermore, the tool forces increase more slowly with distance for EVAM. Figure 1-4 also compares surface
roughness for the two processes. At any distance, the EVAM surface roughness is superior to that of 1-D VAM, and deteriorates at a slower rate. These behaviors indicate that EVAM provides a longer usable tool life, in terms of the distance which can be achieved for a cutoff surface roughness. The mechanism for this has not been clearly identified. Diamond wear rate, considered as the volumetric loss of tool material per time, is thermo-chemical
11
in nature and follows the Arrehnius relationship, increasing exponentially with absolute temperature of the tool cutting edge [18, 29]. Until recently a dominant hypothesis proposed that EVAM extended diamond life because the intermittent cutting process allowed the tool to cool when not in contact with the workpiece, suppressing the driving force for the wear reactions. However finite element modeling by Lane [29] showed the tool cutting edge temperature in EVAM is actually higher than for conventional diamond turning at equivalent conditions. This is presumably because of the high surface velocity caused by superposition of high-frequency vibration onto the feed velocity. He also conducted machining experiments showing the rate of tool wear are the same magnitude for both EVAM and conventional diamond turning, although with proper parameter selection EVAM shows less wear for a given distance. Lane proposed that when cutting steel, the tool disengagement during EVAM prevented formation of a built-up edge and also reduced accumulation of chips or workpiece inclusions on the cutting edge which reduced roughness in the workpiece. However cumulative cutting distance was only a few meters in this work, and further research is necessary to explain EVAM’s relatively long tool life at distances in excess of a kilometer.
1.4
R
EVIEW OFM
ICROSTRUCTUREF
ABRICATIONU
SINGVAM
12
1.4.1
VAM Microstructure Examples
Klocke and Rubenach [28], Rubenach [44], and Dambon et al [13] used 1-D VAM to turn a variety of low-aspect ratio millimeter-scale optical elements and replication masters in glass and steel. Microstructures on these parts were made by using form tools with appropriate cross-sections.
Lee et al. [30] used EVAM with a round-nosed tool to machine 80 μm deep grooves in a glass substrate. These grooves were for alignment of 100 μm diameter optical fibers. Along the groove sides, where depth of cut below the original surface was shallow, ductile regime machining produced well-defined burr-free edges used to align the fibers. In the center portion of the groove, larger depths of cut were used to minimize machining time. This created brittle-fracture surface defects in the central region but this roughness was not critical to functionality. These parts had large depth but simple geometry.
13
(a) Fresnel lens mold (b) Mold for pick-up lens
(c) Flat plate with microribs for molding LED lens Figure 1-5. Molds machined in hard steel using EVAM [48]
14
This part was made using a 5-axis precision CNC machine tool. The Shamoto EVAM system has been converted to be able to vibrate elliptically in all 3 dimensions [53] and has been used to cut tungsten molds for glass lenses [57].
1.4.2
EVAM Experience at the Precision Engineering Center
EVAM research at the Precision Engineering Center at North Carolina State University began in 2001 with emphasis on the "Ultramill" concept. The Ultramill uses parallel piezoelectric actuators driven by sinusoidal voltage signals, and a mechanical linkage to create elliptical tool tip motion. Cerniway [8] built a prototype tool while Negishi [39] developed an improved version capable of multi-kHz operation. This later version of the Ultramill is described in Chapter 3 and was used in the current work.
Cerniway and Negishi debugged the Ultramill concept and used it to explore fundamental properties of EVAM. They investigated surface roughness in grooves and flat surfaces cut in copper, aluminum, and PMMA. Both conducted tool force experiments, validating an EVAM tool force model developed by Cerniway. Cerniway performed a comparative tool wear study between EVAM and conventional diamond turning of hardened tool steel. He discovered that cutting edge wear takes place in EVAM when machining steel, but that it is smooth, regular, and non-detrimental to surface finish. Negishi showed the Ultramill could machine brittle materials by turning an optically flat surface in CVD silicon carbide.
15
resolution as small as 15 μm wide (the side bar on the top knot on the angstrom). The
thunderbird was approximately 1.8 mm long x 1.2mm wide, cut in low-carbon 17-4 PH stainless steel using a 1 mm nose-radius tool. In scanning electron microscope (SEM) images taken at 1000x, the diamond tool used to cut the thunderbird
Figure 1-7 SEM image and interferogram of 200 μm square Angstrom symbol [6]
16
showed no discernible cutting edge wear after 2 m accumulated raster distance. This absence of tool wear is consistent with results by others for diamond turning of steel by EVAM. However the surface roughness of all of these features was 15-25 nm RMS, considerably worse than Negishi's results in copper and PMMA. The roughness was attributed to low stiffness in the depth of cut direction of the 3-axis DTM's air-bearing Y-axis, which caused machine vibration to be transferred into the machined surfaces.
Lane [29] used the Ultramill for detailed EVAM tool force and diamond wear investigations. These overturned then-existing assumption that reduced wear was caused by lower diamond temperatures, although alternative explanations were not conclusively proven.
1.5
O
BJECTIVES OF THEC
URRENTR
ESEARCHThe current work seeks to show how the Ultramill EVAM tool can fabricate 3-D microstructures similar to those found in functional devices. Effort is required in three areas:
1. EVAM System Development
Performance limitations identified in earlier Ultramill research need to be addressed by:
Increasing stiffness of the 3-axis Nanoform diamond turning machine's Y-axis, to reduce surface roughness caused by excessive vibration amplitude in the depth of cut direction
Improving temperature stability of the Ultramill, to minimize form error caused by thermal expansion / contraction of its structural components.
17 2. Analytical Development
Develop EVAM kinematic relationships and theoretical surface roughness prediction for motion required to make 3-D features.
Develop a motion program planning method for raster machining of arbitrary, sculpted 3-D surfaces. This must address the need for 3-3-D cutter compensation including the elliptical tool vibration path.
3. Microstructure Fabrication Experiments
EVAM machining capability needs to be evaluated for two classes of 3-D features:
Parts with complex sculpted 3-D geometry - Made using round-nosed diamond tools, such features are characteristic of micro-optic elements. Specific objectives include making features with:
Non-rotationally symmetric (NRS) geometry
Vertical aspect ratio of more than 0.1 (compared to less than 0.01 for most published work).
High sag (vertical relief) in excess of 50 μm. (Groove and binary features made to date have vertical dimensions of only a few micrometers.)
Feature sizes ranging from ~50 μm to >1 mm.
Optical quality figure error and surface finish
18
Non-rotationally symmetric geometry
Straight, steep sidewalls
Vertical aspect ratio of 1 or greater.
Vertical feature dimensions >10 μm.
19
2
3-D EVAM KINEMATICS AND THEORETICAL SURFACE
ROUGHNESS
To make sculpted 3-D features requires an ability to cut surfaces that are inclined in the direction of primary feed motion. To generate these sloped surfaces, the workpiece feed motion must include a component in the vertical, or depth of cut, direction. The vertical feed also affects the theoretical surface roughness since in EVAM this is caused by the interaction of the elliptical vibration path with the overall feed motion of the workpiece.
Previously-developed EVAM kinematic and theoretical roughness relationships [8, 39, 49] are now extended to the case of feed motion possessing both vertical and horizontal components.
2.1
C
OORDINATES
YSTEMFigure 2-1 shows the coordinate system used for the Ultramill. The X-axis is parallel to the direction of primary tool motion for cutting. This is the "upfeed" direction. The Y-axis lies along the "crossfeed" direction, perpendicular to the upfeed direction. The Z-axis is orthogonal to the X and Y axes, and parallel to the depth-of-cut direction. The negative Z direction is in the direction of increasing depth of cut.
20
2.2
E
QUATIONS OFM
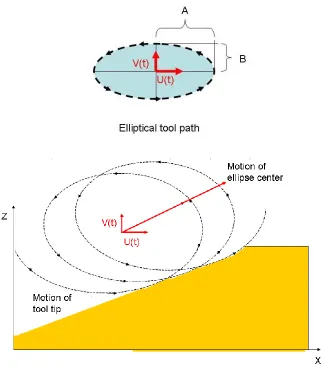
OTIONThe top portion of Figure 2-2 shows the path of a diamond tool tip moving around a vibration ellipse of horizontal amplitude A and vertical amplitude B. This cyclic tool motion is superimposed on the workpiece feed motion, which has instantaneous horizontal velocity U(t) in the X-direction and instantaneous vertical velocity V(t) in the Z-direction. Most diamond turning machines move the workpiece past a fixed tool to create the feed motion. However to maintain the sign convention of the elliptical vibration path, and to easily relate the tool motion to a fixed reference, hereafter the tool is assumed to be moving while the workpiece stays fixed. The net tool path for the combined elliptical and workpiece motion is shown schematically in the bottom portion of Figure 2-2, for an upward sloping surface.
The time to complete one circuit of the path is the period T. The vibration frequency f is 1/T. The instantaneous position of the tool relative to the ellipse center is given by
) cos(
)
(t A t
X (2-1)
Z(t)Bsin(t) (2-2)
21
Figure 2-2. Motion of tool tip in EVAM
Differentiating Equations 2-1 and 2-2 with respect to time gives the instantaneous horizontal and vertical velocity components X'(t) and Z'(t)
) sin( )
(
' t A t
X (2-3)
) cos( )
(
' t B t
Z (2-4)
22
The upfeed and vertical velocity components of the overall tool motion are
( )sin )
(
' t A t U t
X (2-5)
) ( ) cos( ) (
' t B t V t
Z (2-6)
When the feed velocity components are constant U(t) = U and V(t)=V. The tool motion becomes
t UA t
X'( ) sin (2-7)
V t B
t
Z'( ) cos( ) (2-8)
Integrating Equations 2-5 and 2-6 with respect to time yields the instantaneous position of the tool with respect to a fixed reference:
t 0 d U t A tX( ) cos( ) () (2-9)
t d V t B t Z 0 ) ( ) sin( )( (2-10)
where τ is a dummy variable for integration. The integral equations for tool tip position are required if the feed velocities are variable, for example when machining a surface with a profile curved in the X-Z plane. For constant feed velocities these equations become
t U t A
t
X( ) cos( ) (2-11)
t V t B
t
23
In raster machining, the crossfeed velocity Y'(t) is zero, while for turning at small crossfeed rates it is small compared to the upfeed velocity. Hence Y(t) can be approximated as constant.
Equations 2-1 and 2-2 provide the instantaneous tool position relative to the ellipse center. Subtracting them from Equations 2-9 and 2-10 yields the location of the ellipse center (XCEN , ZCEN ) relative to a fixed reference,
t
0
CEN t U d
X ( ) () (2-13)
t
0
CEN t V d
Z ( ) () (2-14)
or for constant feed velocities,
t U t
XCEN( ) (2-15)
t V t
ZCEN( ) (2-16)
The instantaneous direction of the feed motion ζ(t) is
) ( ) ( arctan ) ( t U t V t
(2-17)
while the instantaneous direction of the tool motion κ(t) is
) ( ) sin( ) ( ) cos( arctan ) ( ' ) ( ' arctan ) ( t U t A t V t B t X t Z t
(2-18)
24
(a) Direction of instantaneous velocity of ellipse center ζ(t) and tool tip κ(t)
25
The instantaneous tool rake angle γ(t) and instantaneous tool clearance angle α(t), relative to the X-axis are:
) ( )
(t o t
(2-19)
) ( )
(t o t
(2-20)
where γ0 and α0 are the tool rake and clearance angles, respectively. See Figure 2-3(b). EVAM
cycles should be designed so that the tool flank face does not contact the workpiece on the downward portion of the elliptical toolpath. This means γ(t1) ≥ 0 with t1 the time in the
vibration cycle when the tool first enters the workpiece during the downcutting portion of the cycle. By inspection of the tool path, it is seen this is the location of the steepest angle of tool motion κ(t), for the segment of the vibration cycle where the tool is in the workpiece.
The depth of cut d can be defined as the distance between the uncut work surface and the bottom of the groove made by the diamond tool. See Figure 2-4. When the feed motion has a vertical component, d will vary with time and hence with the position in the X direction, creating a tilted surface. For EVAM, the instantaneous depth of cut d(t) is given by
' )) ( ( )
(t abs Z t B
d CEN (2-21)
With the offset distance B’ given by
2 4 )) ( ( tan )) (
tan( t 2 t B2
26
Figure 2-4. Depth of cut for EVAM on an inclined surface
B’ is derived by finding the tangent point for the instantaneous direction of motion ζ(t) to the
vibration ellipse with semi-major and semi-minor axes A x B. In practice, where the surface slope varies continuously, the offset distance is found by a motion program planning method such as described in Chapter 6, rather than explicitly by employing Equation 2-22.
27
2.3
EVAM
C
YCLEP
ARAMETERSThe "upfeed increment" FUP and "horizontal speed ratio" HSR are defined [8] as:
f U
FUP (2-23)
A U HSR
(2-24)
FUP is the horizontal distance between equivalent points on the tool vibration path for two
successive cycles, and is also the horizontal distance traveled by the ellipse center in one vibration cycle. HSR is the ratio between upfeed velocity and the tool’s maximum horizontal vibration speed. Small values of FUP and HSR mean that there is a large overlap between two
successive elliptical cycles. As these parameters become larger the overlap grows smaller. Successive tool passes no longer overlap when HSR > 0.318.
Analogous parameters FDEPTH (depth feed index) and VSR (vertical speed ratio) can be defined
for vertical feed motion.
f V
FDEPTH (2-25)
B V
VSR (2-26)
28
2.4
T
HEORETICALEVAM
S
URFACER
OUGHNESSFigure 2-5(a) depicts theoretical surface features generated by EVAM. The overlapping elliptical tool paths create a series of cusp-like features in the upfeed direction, as shown in Figure 2-5(c). The spacing of the cusps is FUP. These features are superimposed on the
crossfeed features created on successive raster passes by overlapping portions of the tool profile (Figure 2-5(b)), to create the pocked surface structure seen in Figure 2-5(a).
The theoretical surface roughness from crossfeed features, PVCROSS, is controlled by the
crossfeed spacing ΔY and the tool nose radius Rtool, just as in conventional machinining:
tool CROSS R Y PV 8 ) ( 2 (2-27)
Cerniway adapted this equation to approximate the theoretical upfeed feature height, PVUP.
The surface feature height was assumed to be caused by the overlapping circular arcs corresponding to the maximum radius of curvature of the elliptical tool path, spaced at a distance of FUP (see Figure 2-5(c)). This resulted in Equation 2-28:
22 2 2 2 8 HSR A f A U B
PVUP
(2-28)
29
Figure 2-5. Formation of surface features in EVAM [8, 39]
Negishi [39] predicted theoretical surface feature height, by numerical simulation of the toolpath, with horizontal feed velocity added to the elliptical vibration (Equation 2-11). PVUP
was evaluated for a range of HSR from 0.0004 to 0.04. These results showed that Equation 2-28 overestimates the surface feature height PVUP. The discrepancy increases as HSR gets
larger.
30
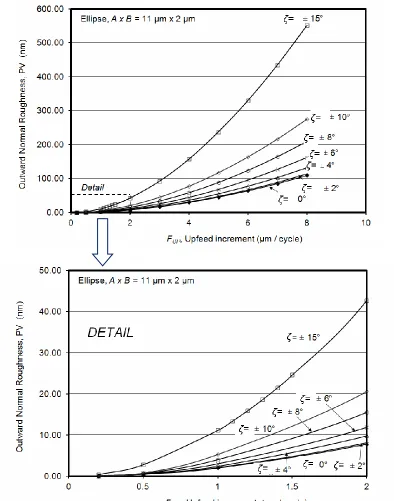
22 µm x 4 µm vibration ellipse (A x B = 11 µm x 2 µm), which was typically used in machining experiments later in this work. Theoretical surface roughness PVUP is shown as a function of
feed motion angle ζ and upfeed increment FUP . The PVUP surface roughness is defined here
as the outward normal from the sloped upfeed surface.
This simulation shows two major results. Upward and downward slopes at the same feed motion angle produce the same theoretical PVUP for small values of FUP. This is because the intersection between two successive cutting passes occurs at the same horizontal position, and the same vertical distance from the X-axis, whether the feed angle is +ζ or -ζ.
Also, it can be seen that the theoretical roughness grows larger as the feed angle ζ, for any constant value of FUP . The roughness grows more severe at an accelerating rate relative to the
rate of change of ζ. This result confirms the need to employ very small values of FUP and HSR
to provide a very smooth surface finish on sloping surfaces. For example, at constant FUP, the
surface roughness for a 15º angle is more than 5 times than that of a horizontal surface. To assure the theoretical roughness of this slope is smaller than an arbitrary value, the selected FUP needs to be about 30% of what might would used for a horizontal surface. (These
proportions apply only to the selected ellipse size and aspect ratio, and separate simulations must be run to examine other ellipse geometries.)
31
Figure 2-6. Theoretical PV surface roughness, for a vibration ellipse with semi-major axis A = 11 µm and semi-minor axisi B = 2 µm as a function of upfeed increment FUP and feed
32
3
EQUIPMENT DESCRIPTION AND IMPROVEMENTS
3.1
U
LTRAMILL-N
ANOFORMS
YSTEMBrocato integrated the Ultramill EVAM tool with a Rank-Pneumo Nanoform 600 3-axis diamond turning machine [6]. This system was used to raster-cut binary microstructures such as the Angstrom symbol and "Thunderbird" described in Section 1.4.
Performance limitations emerged in these early parts which led to equipment modification for the current work. There were four significant issues:
Ultramill temperature instability, which could increase form error. This was addressed by conversion to a closed-circulation cooling configuration for the piezoelectric actuators, from the original